| Param | Original file | Final file |
|---|---|---|
| Filename | modeM0/AS1A07_068T01_9000003760_26000cztM0_level2.evt | modeM0/AS1A07_068T01_9000003760_26000cztM0_level2_quad_clean.evt |
| Size (bytes) | 560,998,080 | 98,991,360 |
| Size | 535.0 MB | 94.4 MB |
| Events in quadrant A | 3,307,219 | 656,599 |
| Events in quadrant B | 3,815,751 | 647,349 |
| Events in quadrant C | 3,813,252 | 614,287 |
| Events in quadrant D | 5,589,436 | 602,204 |
| Mode M0 | |||
|---|---|---|---|
| Quadrant | BADHDUFLAG | Total packets | Discarded packets |
| A | 0 | 14131 | 0 |
| B | 0 | 15709 | 0 |
| C | 0 | 15681 | 0 |
| D | 0 | 21273 | 0 |
| Mode M9 | |||
|---|---|---|---|
| Quadrant | BADHDUFLAG | Total packets | Discarded packets |
| A | 0 | 6 | 0 |
| B | 0 | 6 | 0 |
| C | 0 | 6 | 0 |
| D | 0 | 6 | 0 |
| Quadrant | Total seconds | Saturated seconds | Saturation percentage |
|---|---|---|---|
| A | 6853 | 41 | 0.598278% |
| B | 6853 | 140 | 2.042901% |
| C | 6853 | 84 | 1.225741% |
| D | 6853 | 437 | 6.376769% |
Noise dominated data is calculated using 1-second bins in cleaned event files. If a bin has >2000 counts, and if more than 50% of those come from <1% of pixels, then it is considered to be noise-dominated and hence unusable.
| Quadrant | # 1 sec bins | Bins with >0 counts | Bins with >2000 counts | High rate bins dominated by noise | Noise dominated (total time) | Noise dominated (detector-on time) | Marked lightcurve |
|---|---|---|---|---|---|---|---|
| A | 7413 | 6854 | 0 | 0 | 0.00% | 0.00% | 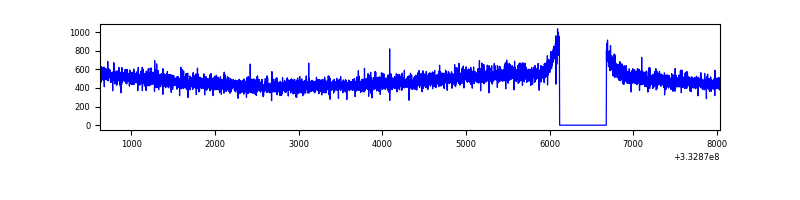 |
| B | 7413 | 6854 | 55 | 55 | 0.74% | 0.80% | 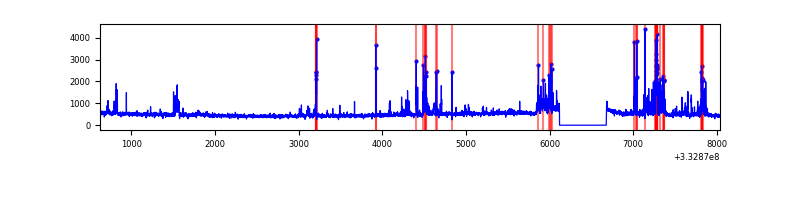 |
| C | 7413 | 6854 | 0 | 0 | 0.00% | 0.00% |  |
| D | 7413 | 6854 | 359 | 359 | 4.84% | 5.24% | 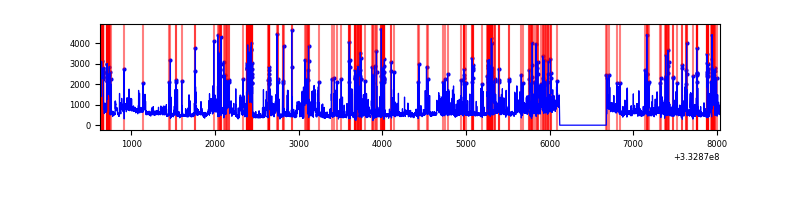 |
Top three noisy pixels from each quadrant. If the there are fewer than three noisy pixels in the level2.evt file, extra rows are filled as -1
| Pixel properties | Quadrant properties | ||||||
|---|---|---|---|---|---|---|---|
| Quadrant | DetID | PixID | Counts | Sigma | Mean | Median | Sigma |
| A | 0 | 13 | 11729 | 63.72 | 853 | 835 | 171.0 |
| A | 13 | 254 | 9903 | 53.04 | 853 | 835 | 171.0 |
| A | 3 | 137 | 8092 | 42.45 | 853 | 835 | 171.0 |
| B | 10 | 245 | 454540 | 2810.34 | 833 | 811 | 161.4 |
| B | 0 | 190 | 81241 | 498.17 | 833 | 811 | 161.4 |
| B | 12 | 111 | 19318 | 114.63 | 833 | 811 | 161.4 |
| C | 0 | 239 | 527691 | 2820.57 | 799 | 805 | 186.8 |
| C | 14 | 238 | 128952 | 686.01 | 799 | 805 | 186.8 |
| C | 0 | 207 | 32546 | 169.92 | 799 | 805 | 186.8 |
| D | 1 | 52 | 2409633 | 12549.29 | 798 | 776 | 192.0 |
| D | 7 | 80 | 57717 | 296.64 | 798 | 776 | 192.0 |
| D | 8 | 195 | 50927 | 261.27 | 798 | 776 | 192.0 |
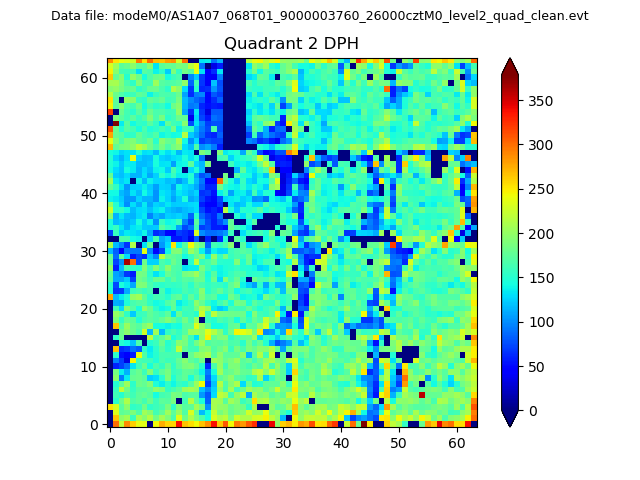
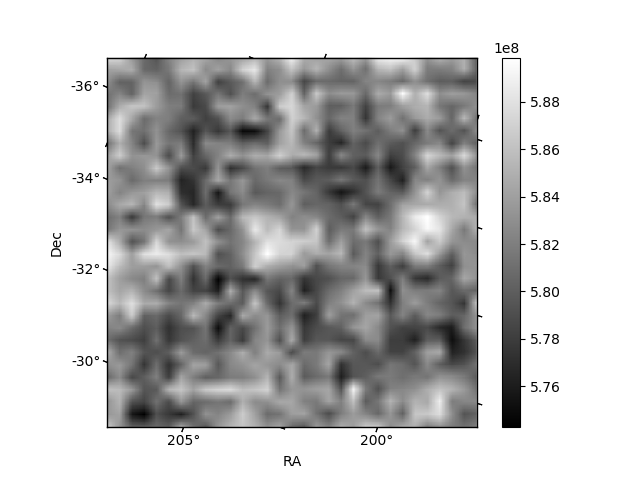
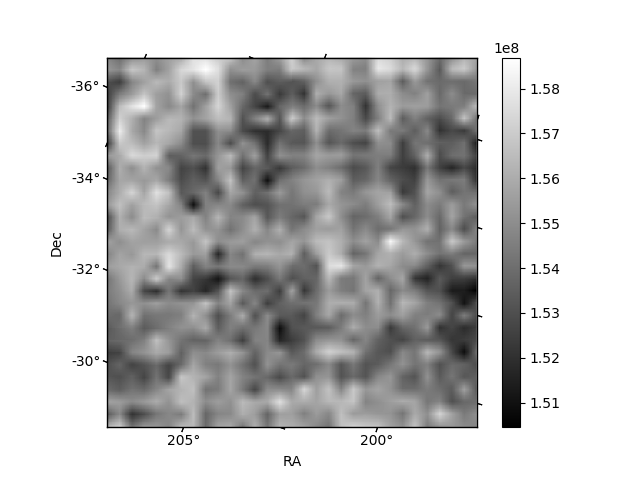
Histogram calculated using DETX and DETY for each event in the final _common_clean file
| Quadrant A | 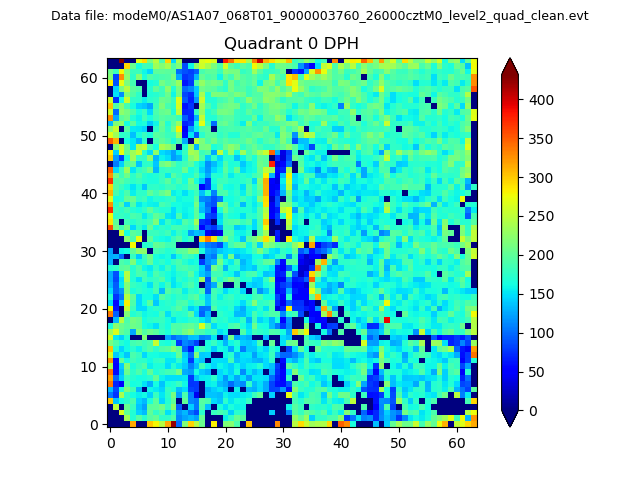 |
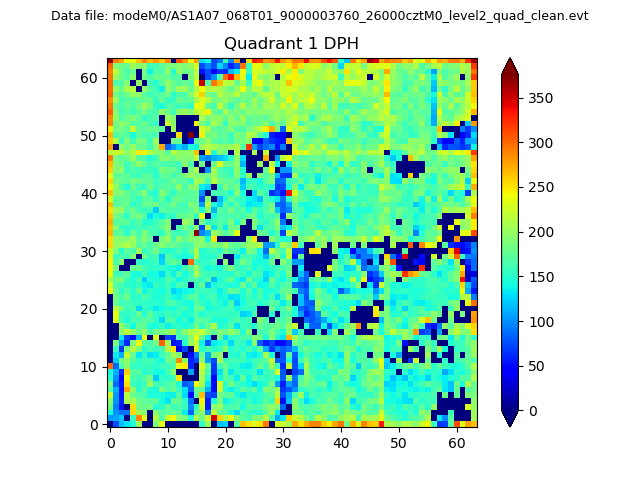 |
Quadrant B |
|---|---|---|---|
| Quadrant D | 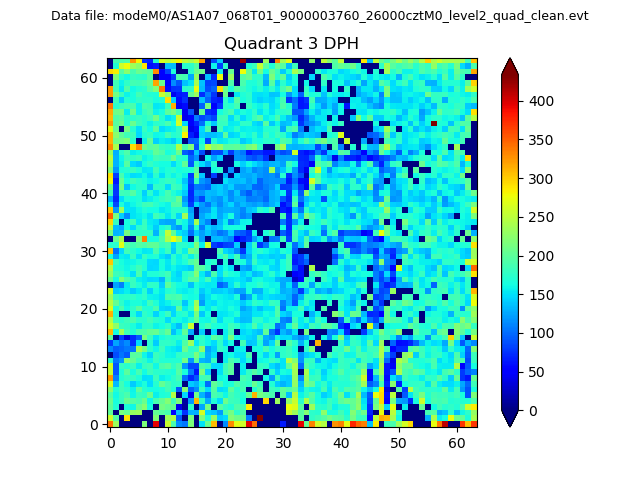 |
 |
Quadrant C |
| Plot type | Count rate plots | Images |
|---|---|---|
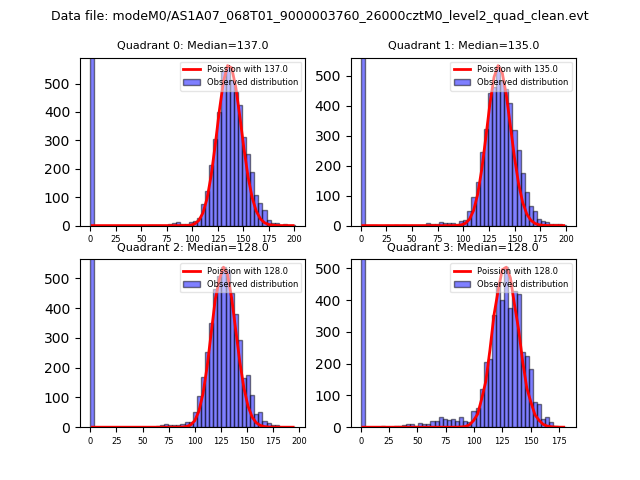
| Comparison with Poisson distribution Blue bars denote a histogram of data divided into 1 sec bins. Red curve is a Poisson curve with rate = median count rate of data. |
 |
 |
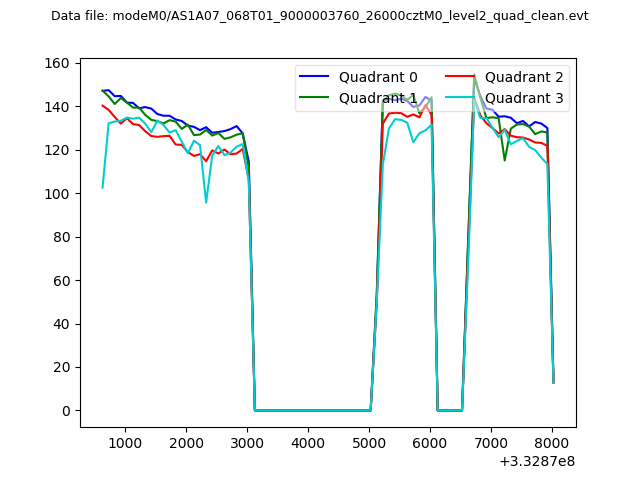
| Quadrant-wise count rates Data is divided into 100 sec bins |
 |
|
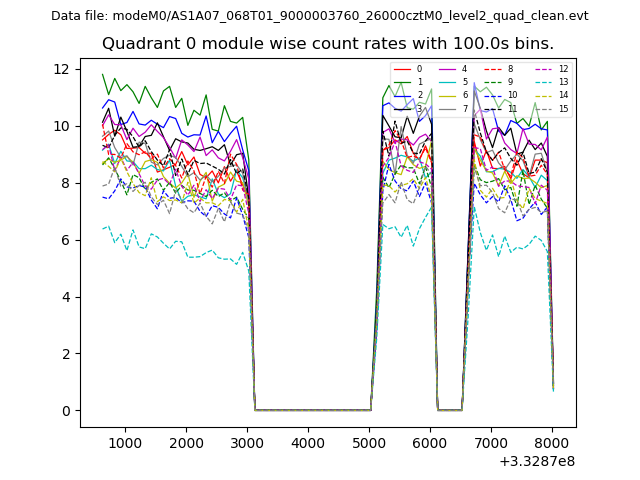
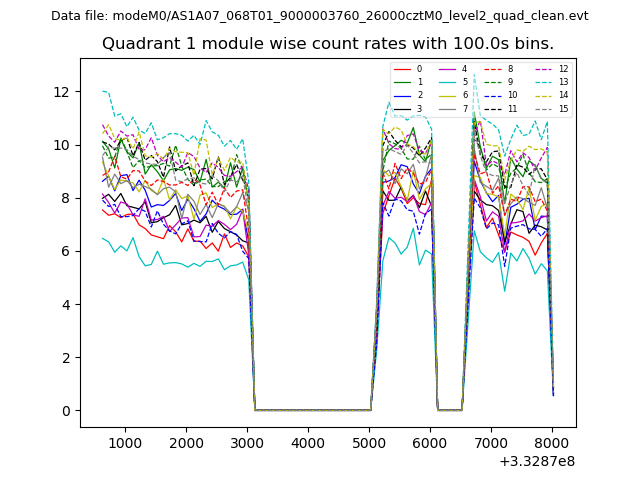
| Module-wise count rates for Quadrant A Data is divided into 100 sec bins |
 |
 |
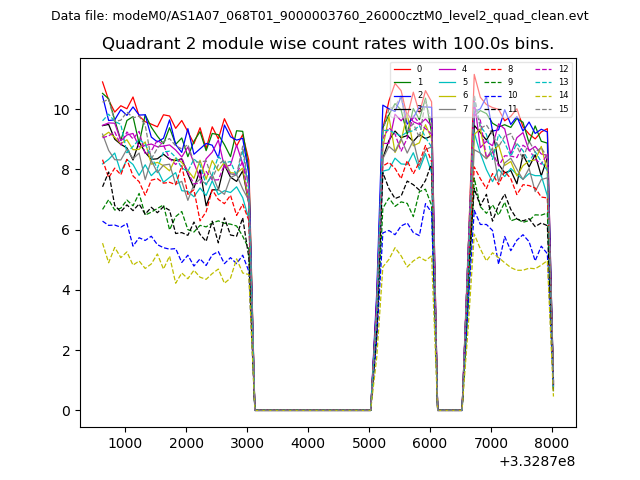
| Module-wise count rates for Quadrant B Data is divided into 100 sec bins |
 |
 |
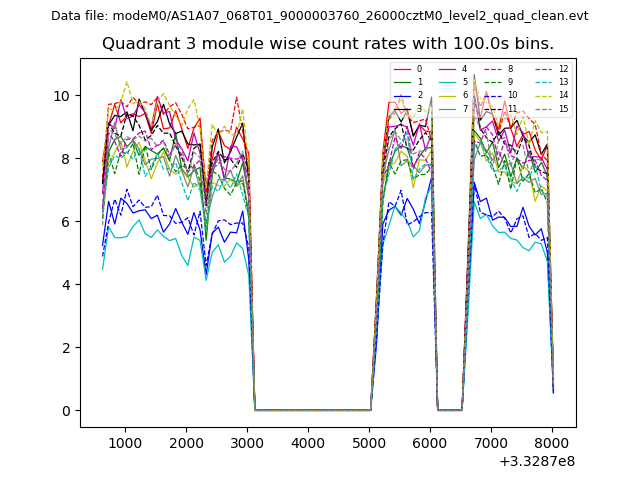
| Module-wise count rates for Quadrant C Data is divided into 100 sec bins |
 |
 |
| Module-wise count rates for Quadrant D Data is divided into 100 sec bins |
 |
 |
| Parameter | Plot |
|---|---|
| CZT HV Monitor | 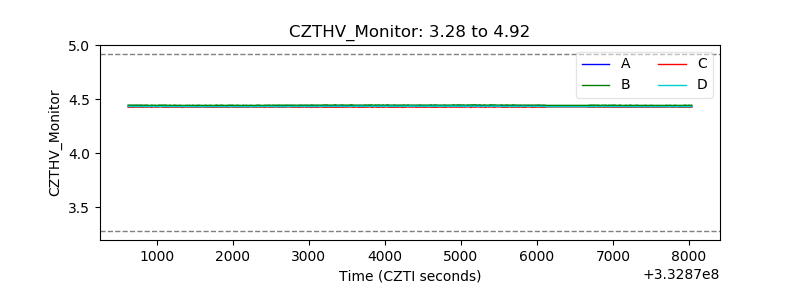 |
| D_VDD | 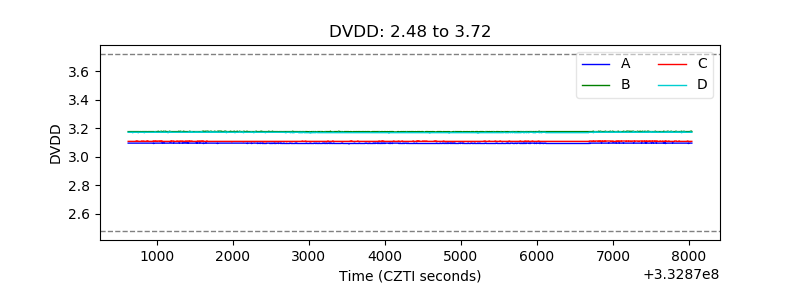 |
| Temperature 1 | 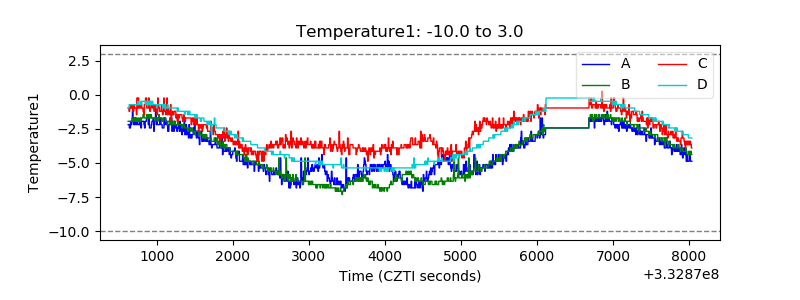 |
| Veto HV Monitor | 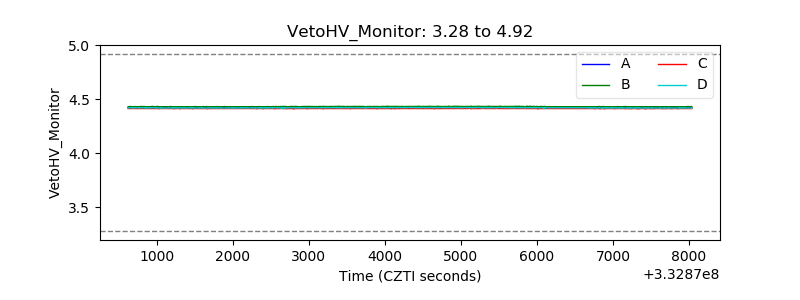 |
| Veto LLD | 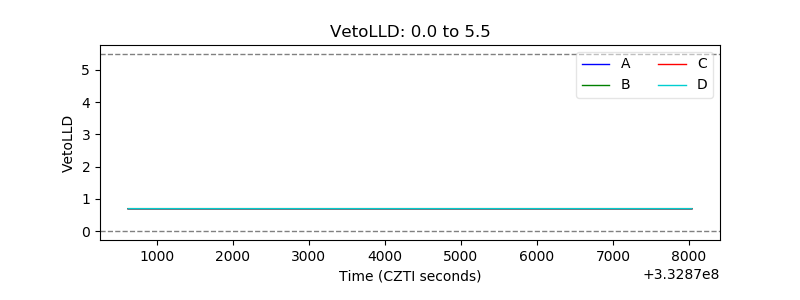 |
| Alpha Counter | 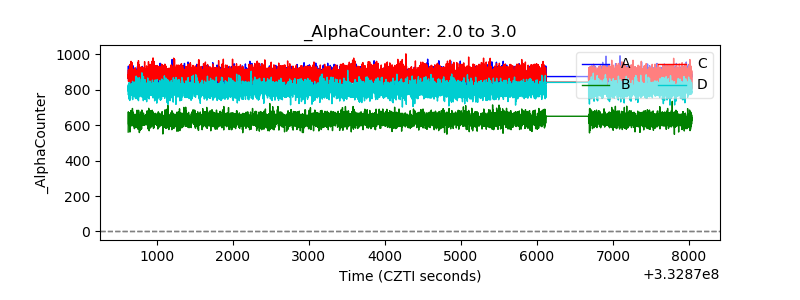 |
| _CPM_Rate | 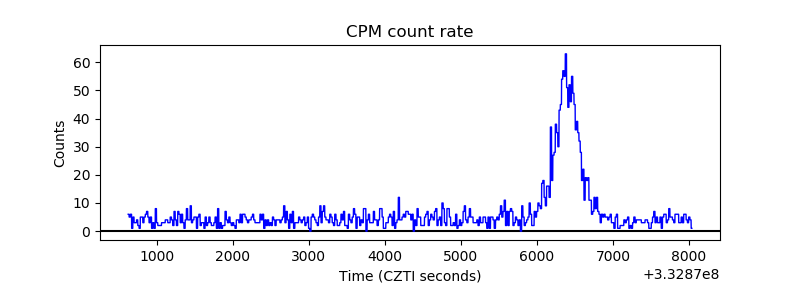 |
| CZT Counter | 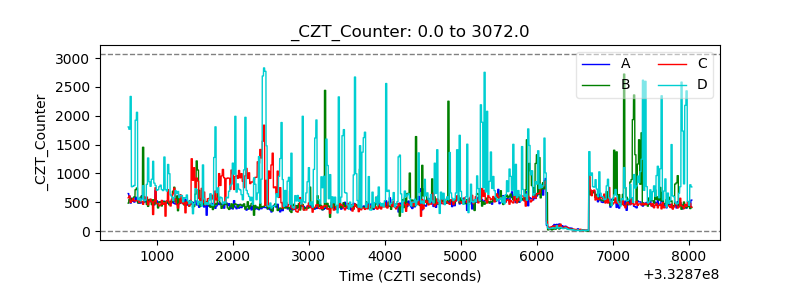 |
| +2.5 Volts monitor |  |
| +5 Volts monitor |  |
| _ROLL_ROT | 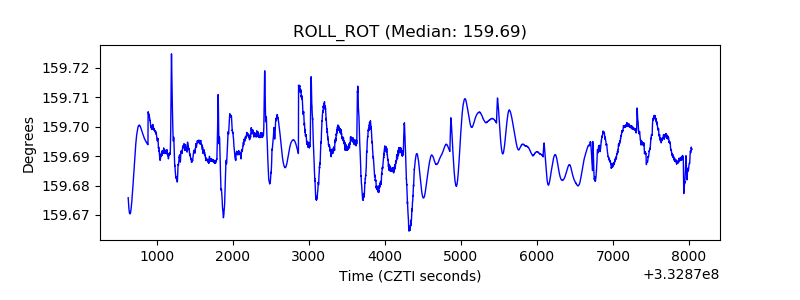 |
| _Roll_DEC | 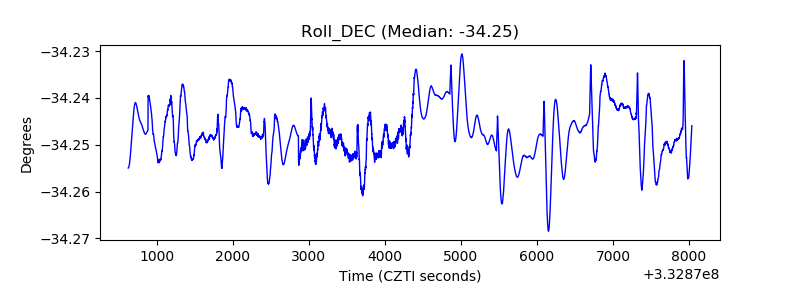 |
| _Roll_RA | 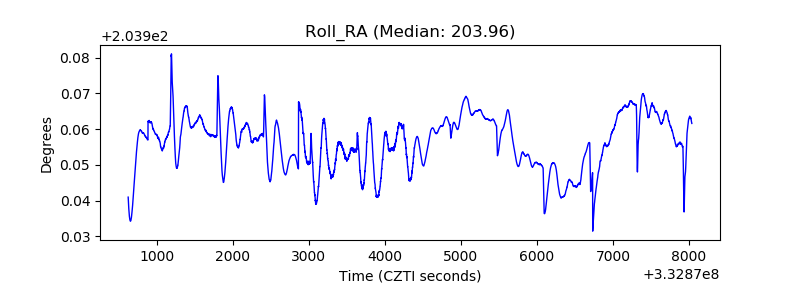 |
| Veto Counter | 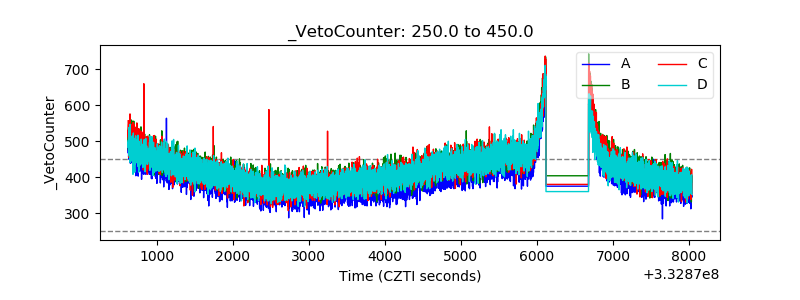 |