| Param | Original file | Final file |
|---|---|---|
| Filename | modeM0/AS1A07_068T01_9000003760_26001cztM0_level2.evt | modeM0/AS1A07_068T01_9000003760_26001cztM0_level2_quad_clean.evt |
| Size (bytes) | 609,301,440 | 105,805,440 |
| Size | 581.1 MB | 100.9 MB |
| Events in quadrant A | 3,494,293 | 702,198 |
| Events in quadrant B | 3,894,515 | 695,834 |
| Events in quadrant C | 3,545,375 | 666,742 |
| Events in quadrant D | 7,022,398 | 629,514 |
| Mode M0 | |||
|---|---|---|---|
| Quadrant | BADHDUFLAG | Total packets | Discarded packets |
| A | 0 | 15035 | 0 |
| B | 0 | 16245 | 0 |
| C | 0 | 15302 | 0 |
| D | 0 | 25832 | 0 |
| Mode M9 | |||
|---|---|---|---|
| Quadrant | BADHDUFLAG | Total packets | Discarded packets |
| A | 0 | 3 | 0 |
| B | 0 | 3 | 0 |
| C | 0 | 3 | 0 |
| D | 0 | 3 | 0 |
| Quadrant | Total seconds | Saturated seconds | Saturation percentage |
|---|---|---|---|
| A | 7323 | 25 | 0.341390% |
| B | 7323 | 129 | 1.761573% |
| C | 7323 | 81 | 1.106104% |
| D | 7323 | 932 | 12.727024% |
Noise dominated data is calculated using 1-second bins in cleaned event files. If a bin has >2000 counts, and if more than 50% of those come from <1% of pixels, then it is considered to be noise-dominated and hence unusable.
| Quadrant | # 1 sec bins | Bins with >0 counts | Bins with >2000 counts | High rate bins dominated by noise | Noise dominated (total time) | Noise dominated (detector-on time) | Marked lightcurve |
|---|---|---|---|---|---|---|---|
| A | 7608 | 7325 | 0 | 0 | 0.00% | 0.00% | 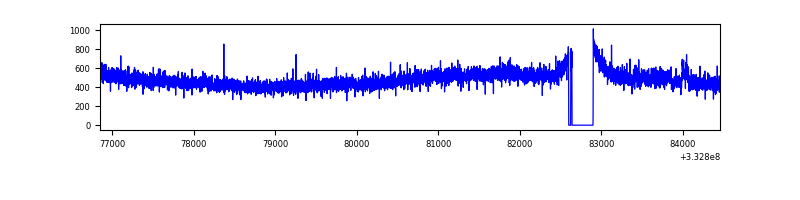 |
| B | 7608 | 7325 | 48 | 48 | 0.63% | 0.66% | 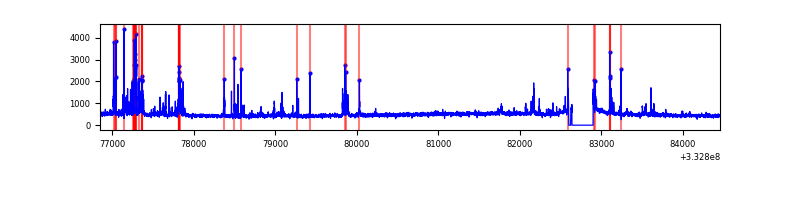 |
| C | 7608 | 7325 | 0 | 0 | 0.00% | 0.00% | 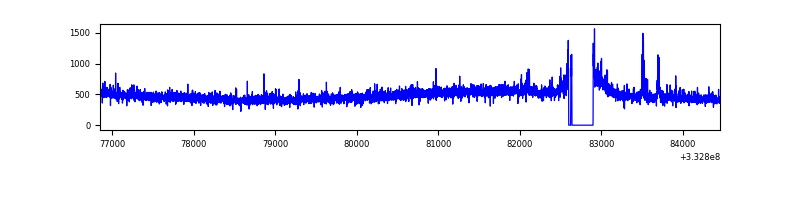 |
| D | 7608 | 7325 | 761 | 761 | 10.00% | 10.39% | 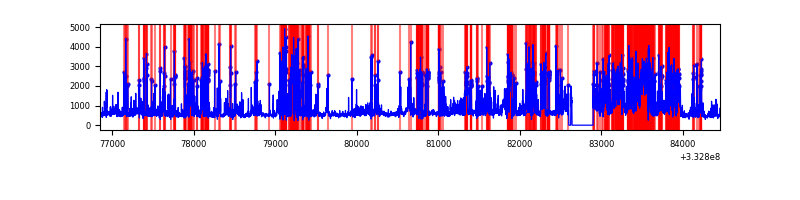 |
Top three noisy pixels from each quadrant. If the there are fewer than three noisy pixels in the level2.evt file, extra rows are filled as -1
| Pixel properties | Quadrant properties | ||||||
|---|---|---|---|---|---|---|---|
| Quadrant | DetID | PixID | Counts | Sigma | Mean | Median | Sigma |
| A | 0 | 13 | 48841 | 266.22 | 892 | 875 | 180.2 |
| A | 13 | 254 | 11294 | 57.83 | 892 | 875 | 180.2 |
| A | 3 | 137 | 8465 | 42.13 | 892 | 875 | 180.2 |
| B | 10 | 245 | 379511 | 2253.51 | 875 | 853 | 168.0 |
| B | 0 | 190 | 58916 | 345.55 | 875 | 853 | 168.0 |
| B | 12 | 111 | 20522 | 117.06 | 875 | 853 | 168.0 |
| C | 14 | 238 | 135774 | 679.5 | 842 | 846 | 198.6 |
| C | 0 | 207 | 83520 | 416.35 | 842 | 846 | 198.6 |
| C | 3 | 233 | 46730 | 231.07 | 842 | 846 | 198.6 |
| D | 1 | 52 | 3643257 | 18503.06 | 819 | 800 | 196.9 |
| D | 12 | 233 | 105718 | 532.97 | 819 | 800 | 196.9 |
| D | 7 | 80 | 60310 | 302.3 | 819 | 800 | 196.9 |
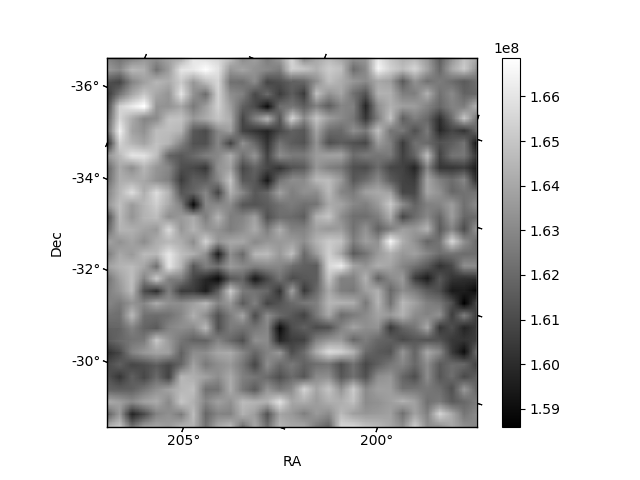
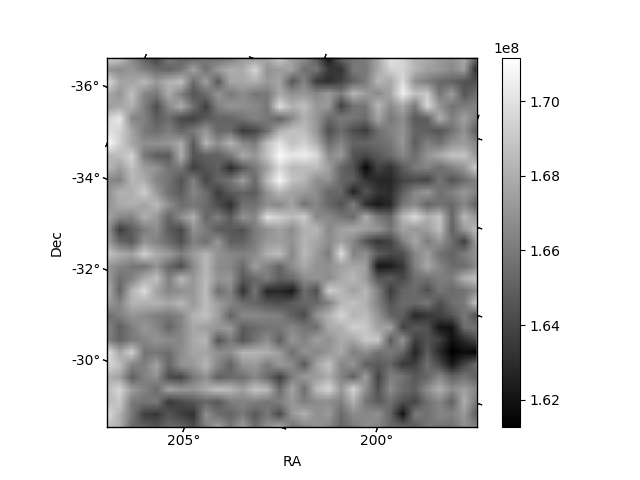
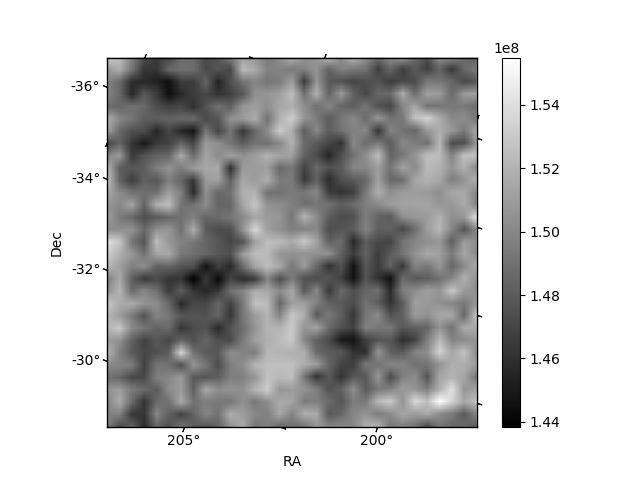
Histogram calculated using DETX and DETY for each event in the final _common_clean file
| Quadrant A | 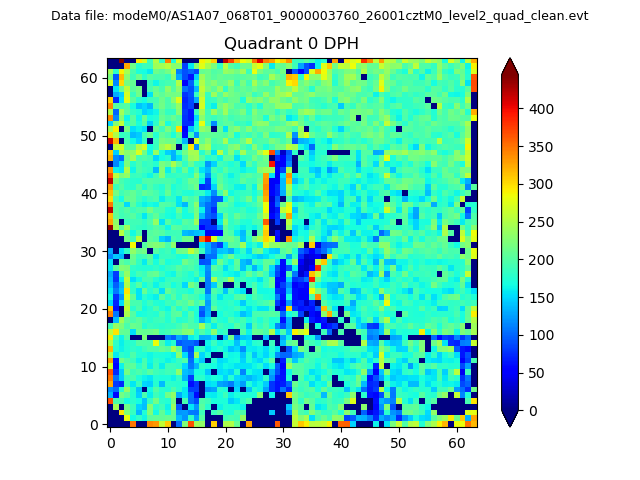 |
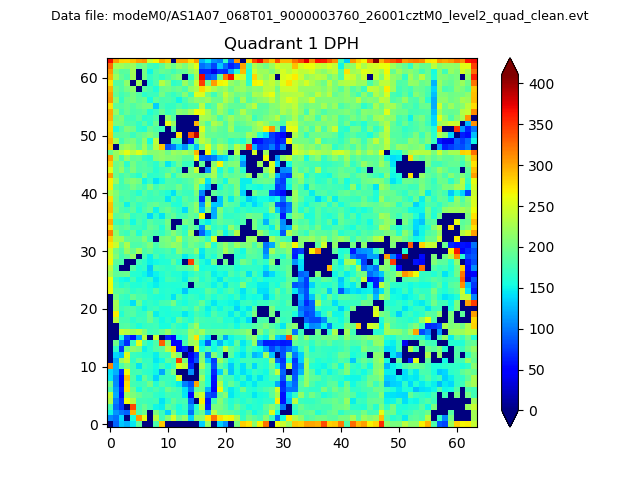 |
Quadrant B |
|---|---|---|---|
| Quadrant D | 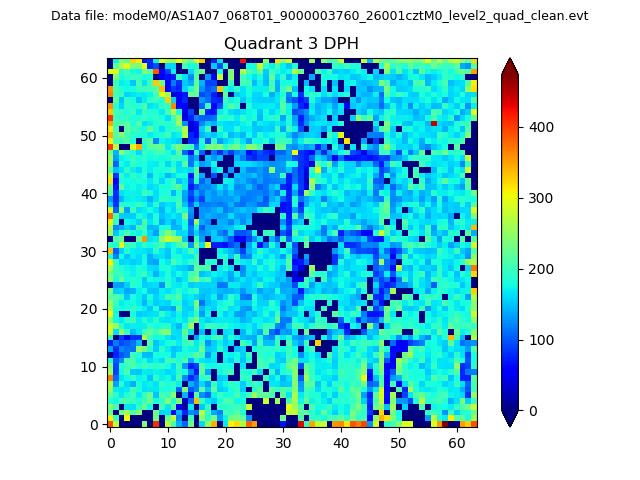 |
 |
Quadrant C |
| Plot type | Count rate plots | Images |
|---|---|---|
| Comparison with Poisson distribution Blue bars denote a histogram of data divided into 1 sec bins. Red curve is a Poisson curve with rate = median count rate of data. |
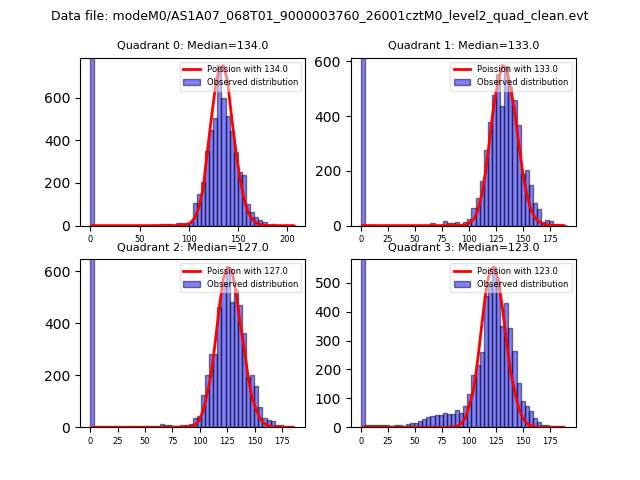 |
 |
| Quadrant-wise count rates Data is divided into 100 sec bins |
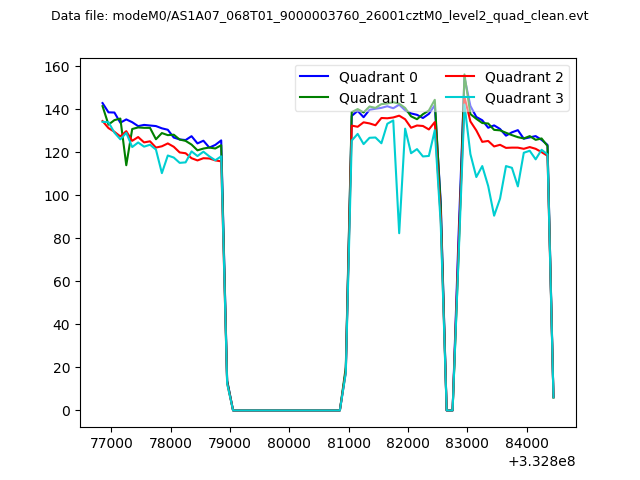 |
|
| Module-wise count rates for Quadrant A Data is divided into 100 sec bins |
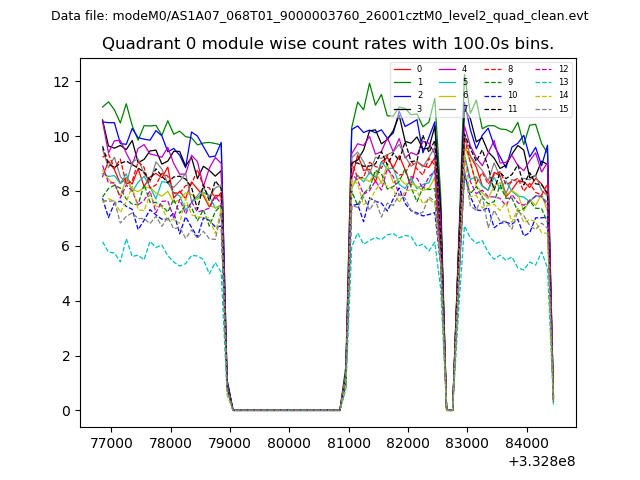 |
 |
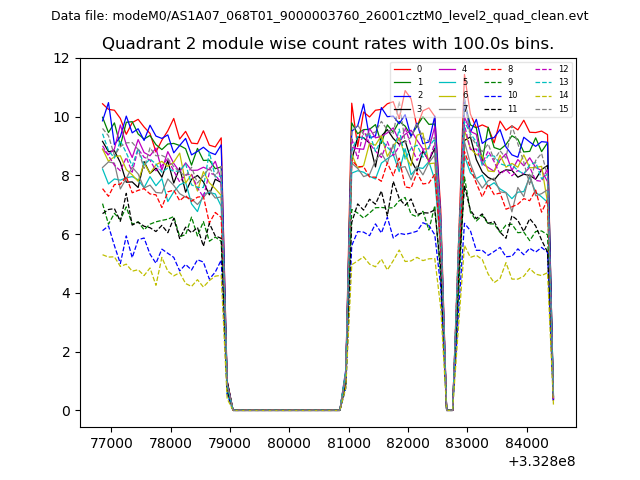
| Module-wise count rates for Quadrant B Data is divided into 100 sec bins |
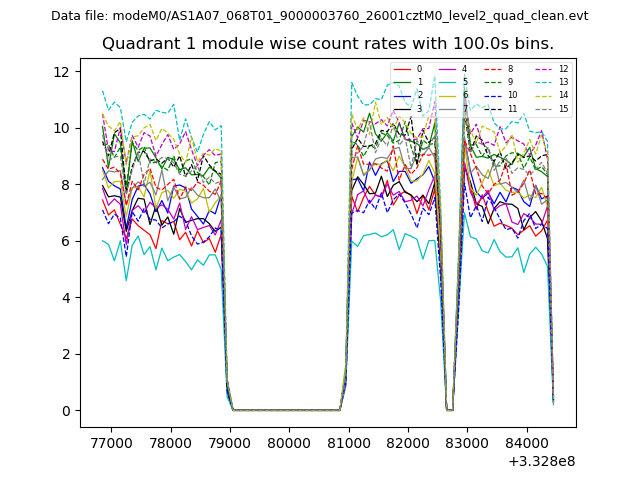 |
 |
| Module-wise count rates for Quadrant C Data is divided into 100 sec bins |
 |
 |
| Module-wise count rates for Quadrant D Data is divided into 100 sec bins |
 |
 |
| Parameter | Plot |
|---|---|
| CZT HV Monitor |  |
| D_VDD |  |
| Temperature 1 | 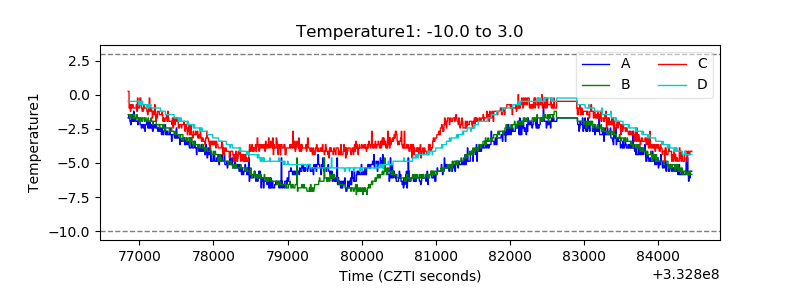 |
| Veto HV Monitor | 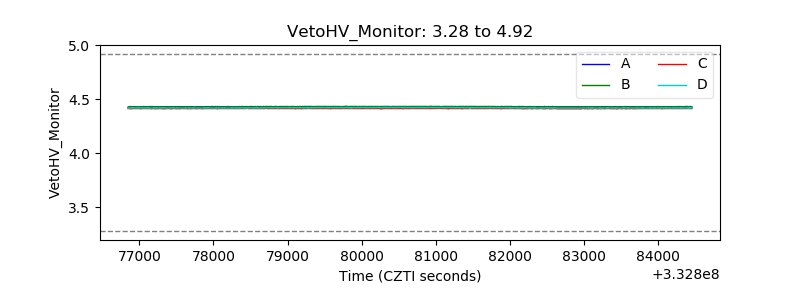 |
| Veto LLD | 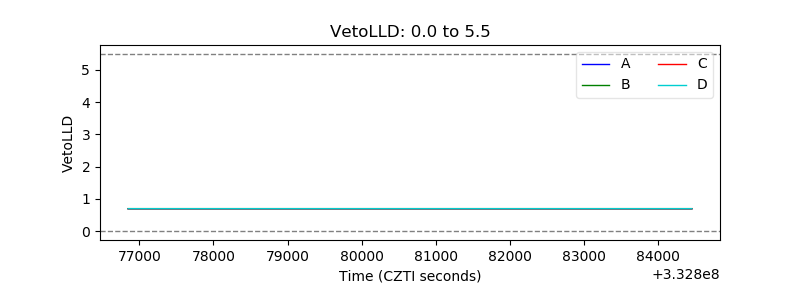 |
| Alpha Counter | 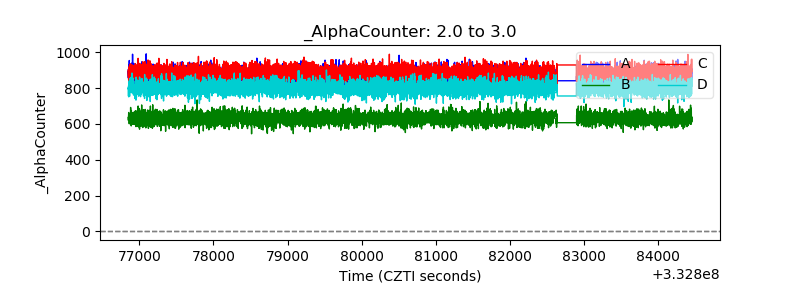 |
| _CPM_Rate | 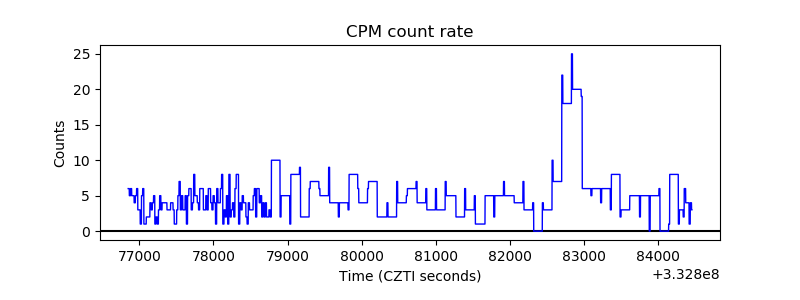 |
| CZT Counter |  |
| +2.5 Volts monitor |  |
| +5 Volts monitor | 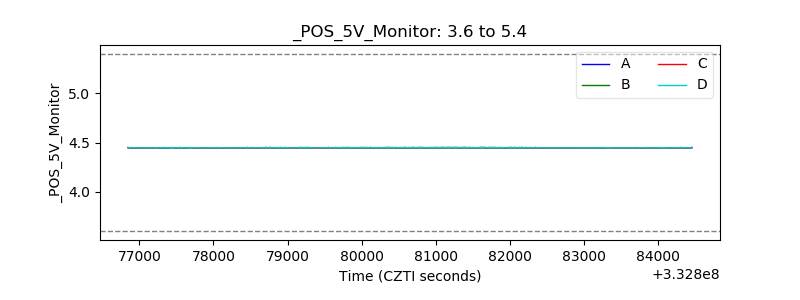 |
| _ROLL_ROT | 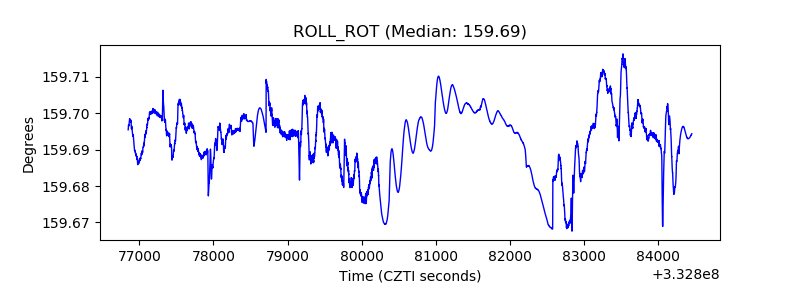 |
| _Roll_DEC | 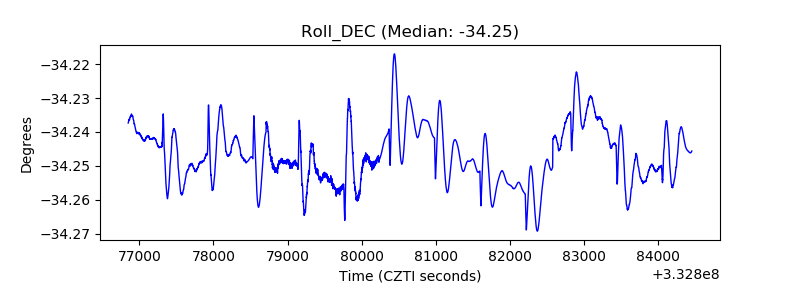 |
| _Roll_RA |  |
| Veto Counter | 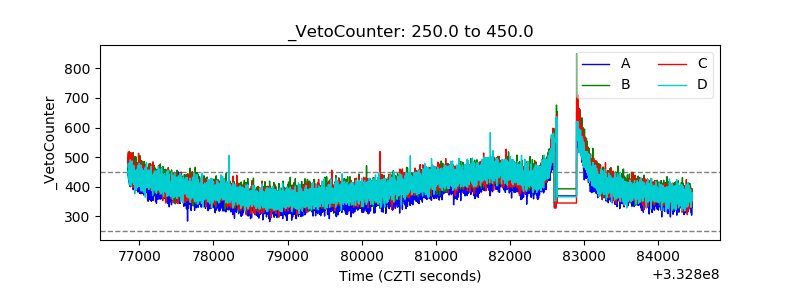 |