| Param | Original file | Final file |
|---|---|---|
| Filename | modeM0/AS1A07_068T01_9000003760_26002cztM0_level2.evt | modeM0/AS1A07_068T01_9000003760_26002cztM0_level2_quad_clean.evt |
| Size (bytes) | 591,779,520 | 107,017,920 |
| Size | 564.4 MB | 102.1 MB |
| Events in quadrant A | 3,595,184 | 711,028 |
| Events in quadrant B | 3,672,455 | 708,193 |
| Events in quadrant C | 3,596,774 | 673,120 |
| Events in quadrant D | 6,550,518 | 628,025 |
| Mode M0 | |||
|---|---|---|---|
| Quadrant | BADHDUFLAG | Total packets | Discarded packets |
| A | 0 | 15510 | 0 |
| B | 0 | 15738 | 0 |
| C | 0 | 15607 | 0 |
| D | 0 | 24430 | 0 |
| Mode M9 | |||
|---|---|---|---|
| Quadrant | BADHDUFLAG | Total packets | Discarded packets |
| A | 0 | 3 | 0 |
| B | 0 | 4 | 0 |
| C | 0 | 4 | 0 |
| D | 0 | 4 | 0 |
| Quadrant | Total seconds | Saturated seconds | Saturation percentage |
|---|---|---|---|
| A | 7477 | 53 | 0.708840% |
| B | 7477 | 92 | 1.230440% |
| C | 7477 | 98 | 1.310686% |
| D | 7476 | 865 | 11.570358% |
Noise dominated data is calculated using 1-second bins in cleaned event files. If a bin has >2000 counts, and if more than 50% of those come from <1% of pixels, then it is considered to be noise-dominated and hence unusable.
| Quadrant | # 1 sec bins | Bins with >0 counts | Bins with >2000 counts | High rate bins dominated by noise | Noise dominated (total time) | Noise dominated (detector-on time) | Marked lightcurve |
|---|---|---|---|---|---|---|---|
| A | 7827 | 7478 | 0 | 0 | 0.00% | 0.00% | 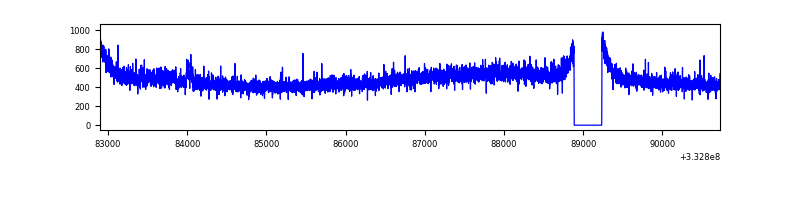 |
| B | 7827 | 7478 | 7 | 7 | 0.09% | 0.09% |  |
| C | 7827 | 7478 | 0 | 0 | 0.00% | 0.00% | 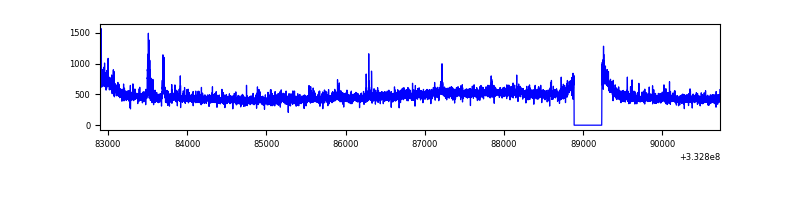 |
| D | 7826 | 7477 | 714 | 714 | 9.12% | 9.55% | 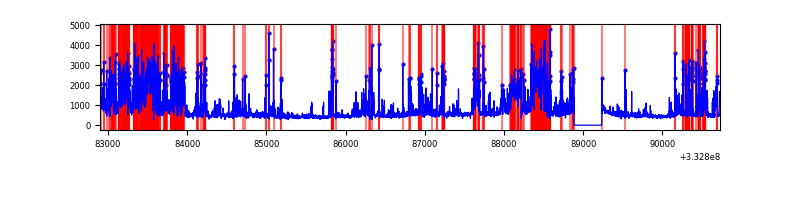 |
Top three noisy pixels from each quadrant. If the there are fewer than three noisy pixels in the level2.evt file, extra rows are filled as -1
| Pixel properties | Quadrant properties | ||||||
|---|---|---|---|---|---|---|---|
| Quadrant | DetID | PixID | Counts | Sigma | Mean | Median | Sigma |
| A | 0 | 13 | 78305 | 420.19 | 912 | 892 | 184.2 |
| A | 13 | 254 | 11491 | 57.53 | 912 | 892 | 184.2 |
| A | 3 | 137 | 8694 | 42.35 | 912 | 892 | 184.2 |
| B | 10 | 245 | 102774 | 587.37 | 898 | 876 | 173.5 |
| B | 0 | 190 | 42903 | 242.26 | 898 | 876 | 173.5 |
| B | 12 | 111 | 21121 | 116.7 | 898 | 876 | 173.5 |
| C | 14 | 238 | 138587 | 682.53 | 858 | 863 | 201.8 |
| C | 0 | 207 | 60745 | 296.76 | 858 | 863 | 201.8 |
| C | 3 | 233 | 55241 | 269.49 | 858 | 863 | 201.8 |
| D | 1 | 52 | 3179955 | 15660.18 | 836 | 814 | 203.0 |
| D | 1 | 3 | 77151 | 376.03 | 836 | 814 | 203.0 |
| D | 7 | 80 | 35221 | 169.49 | 836 | 814 | 203.0 |
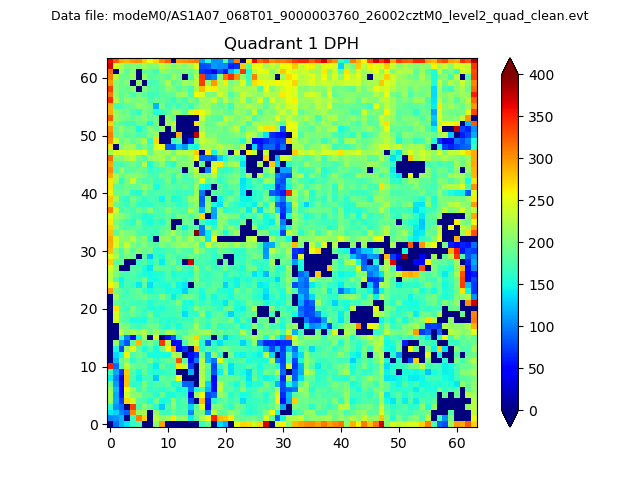
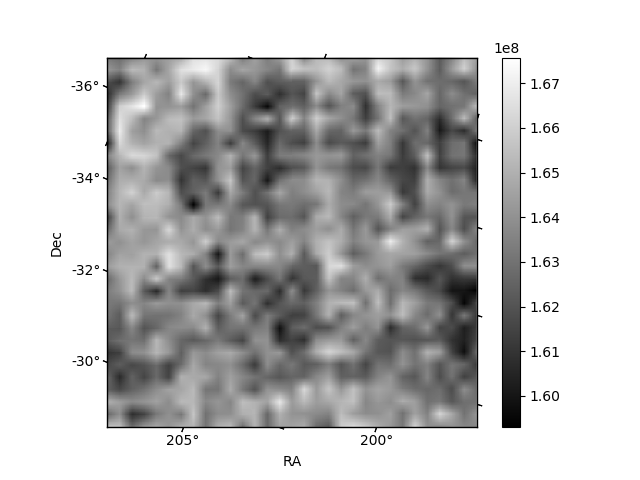
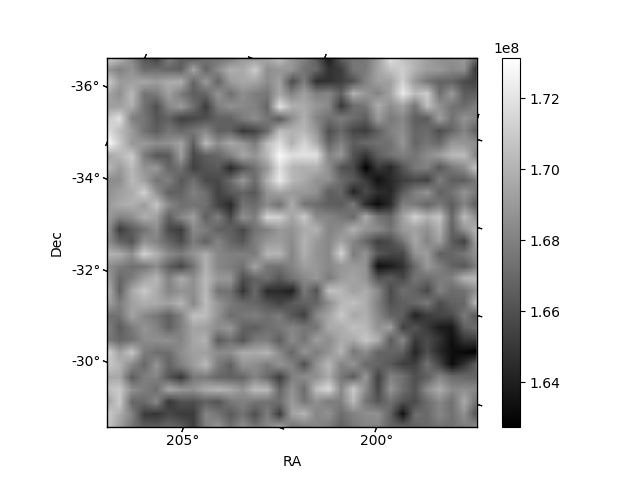
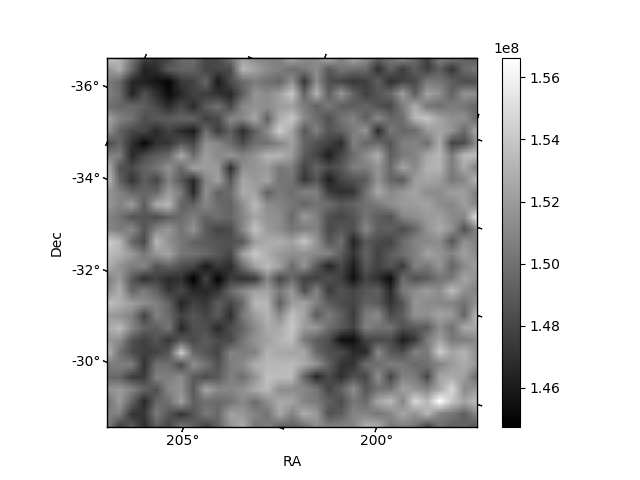
Histogram calculated using DETX and DETY for each event in the final _common_clean file
| Quadrant A | 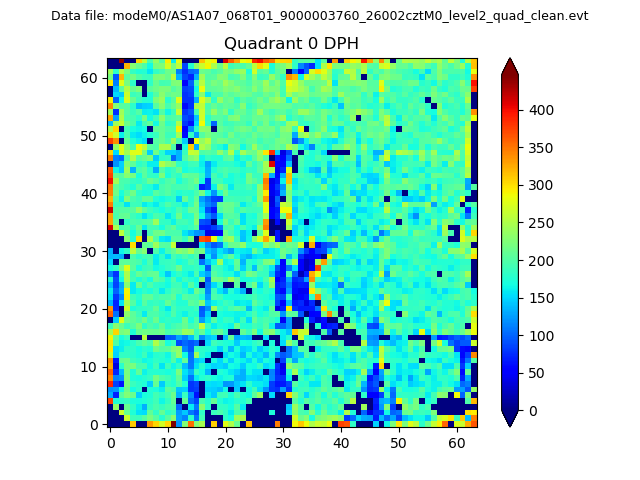 |
 |
Quadrant B |
|---|---|---|---|
| Quadrant D | 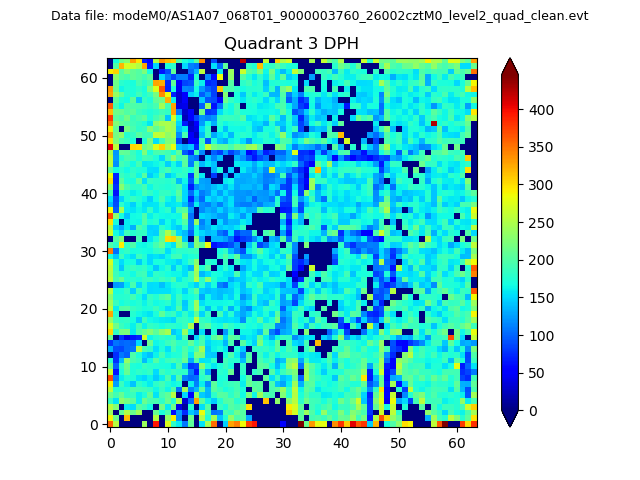 |
 |
Quadrant C |
| Plot type | Count rate plots | Images |
|---|---|---|
| Comparison with Poisson distribution Blue bars denote a histogram of data divided into 1 sec bins. Red curve is a Poisson curve with rate = median count rate of data. |
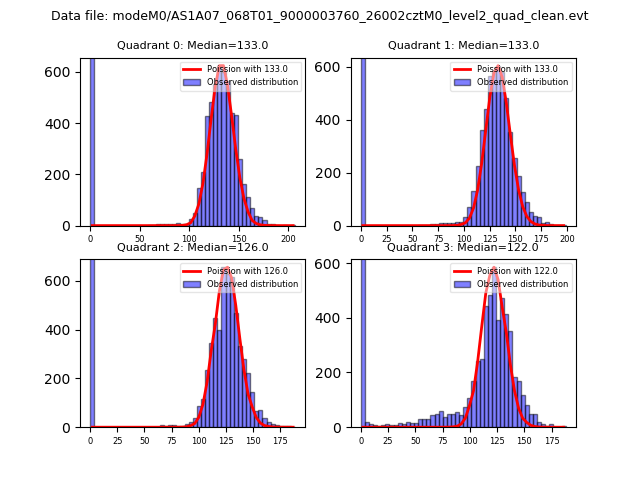 |
 |
| Quadrant-wise count rates Data is divided into 100 sec bins |
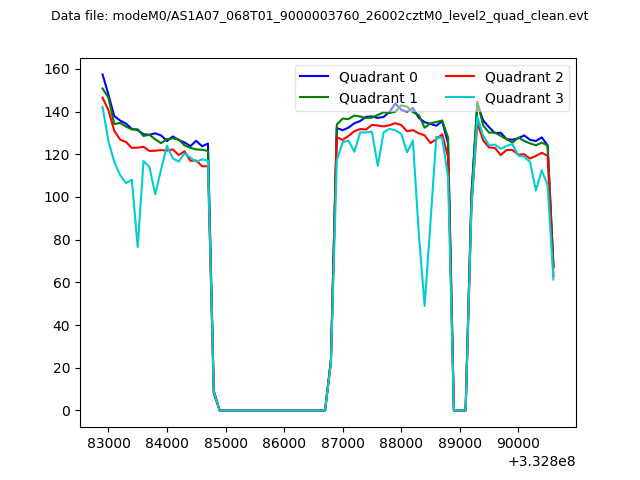 |
|
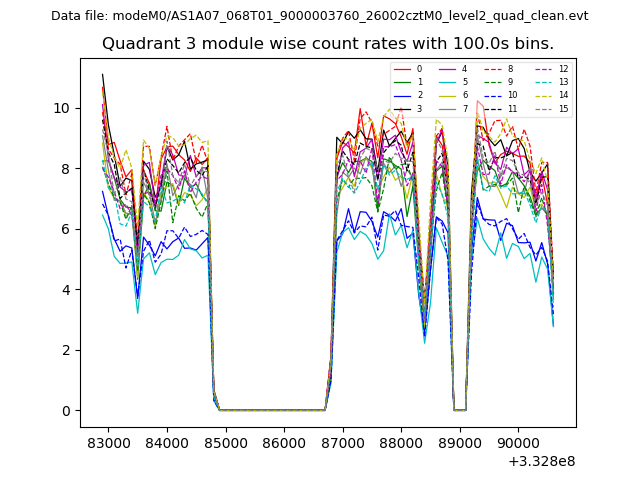
| Module-wise count rates for Quadrant A Data is divided into 100 sec bins |
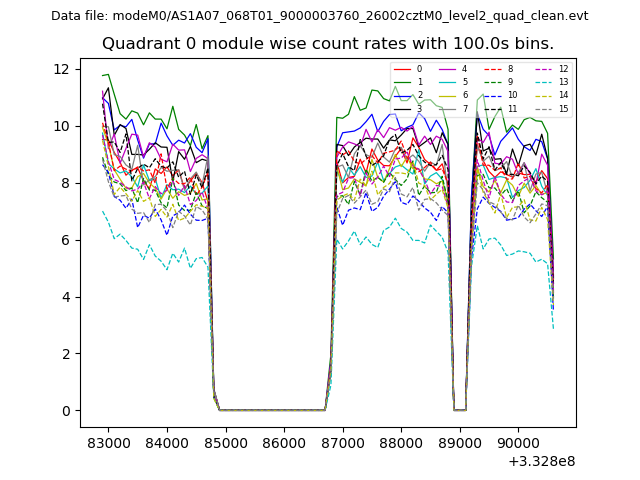 |
 |
| Module-wise count rates for Quadrant B Data is divided into 100 sec bins |
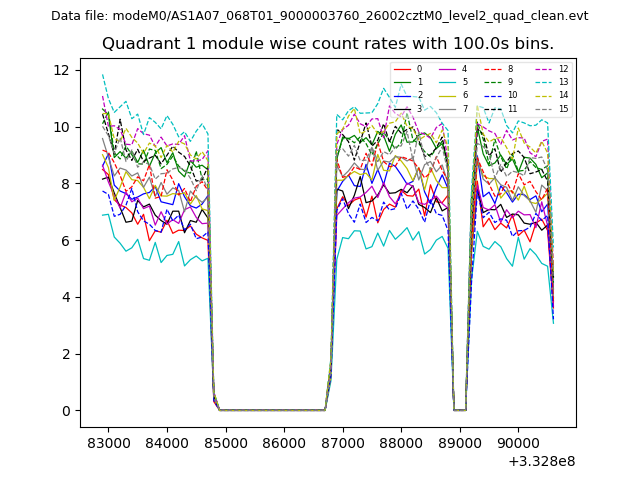 |
 |
| Module-wise count rates for Quadrant C Data is divided into 100 sec bins |
 |
 |
| Module-wise count rates for Quadrant D Data is divided into 100 sec bins |
 |
 |
| Parameter | Plot |
|---|---|
| CZT HV Monitor | 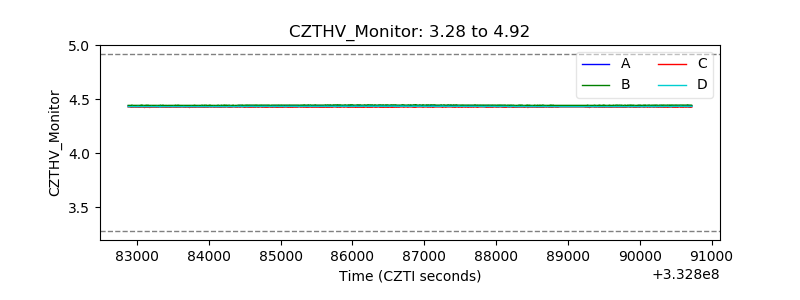 |
| D_VDD | 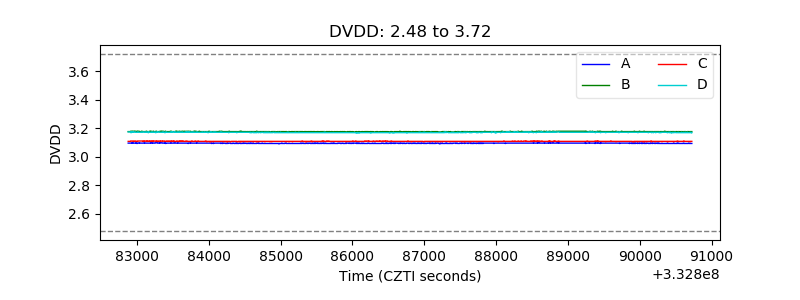 |
| Temperature 1 | 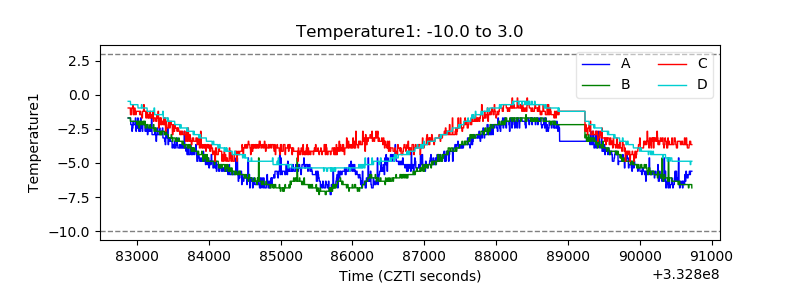 |
| Veto HV Monitor |  |
| Veto LLD | 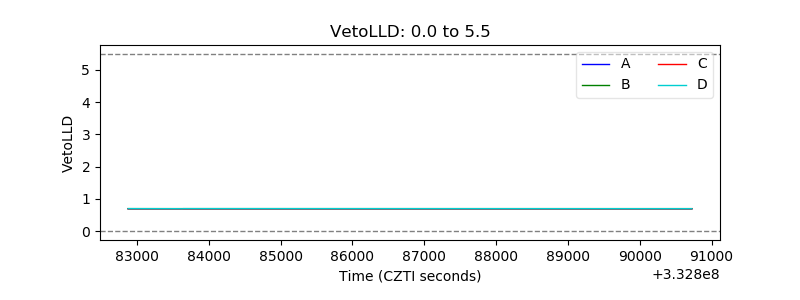 |
| Alpha Counter | 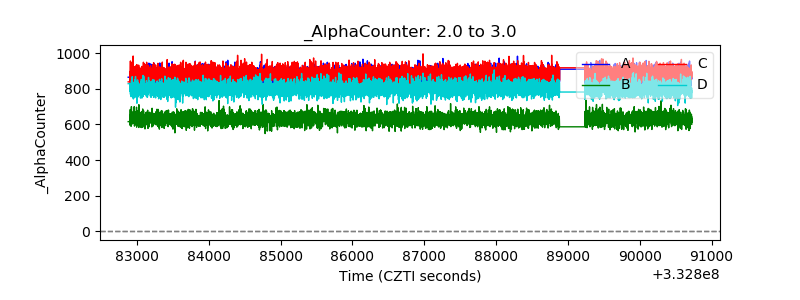 |
| _CPM_Rate | 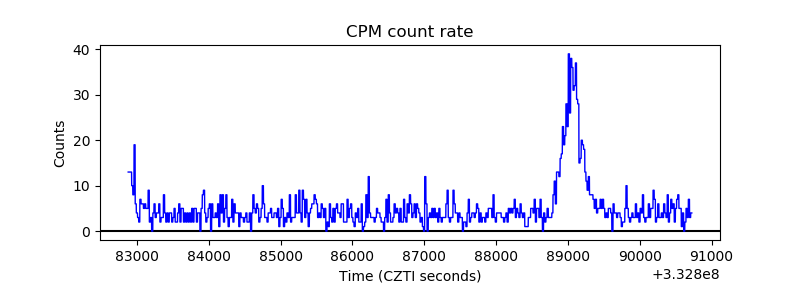 |
| CZT Counter |  |
| +2.5 Volts monitor |  |
| +5 Volts monitor |  |
| _ROLL_ROT | 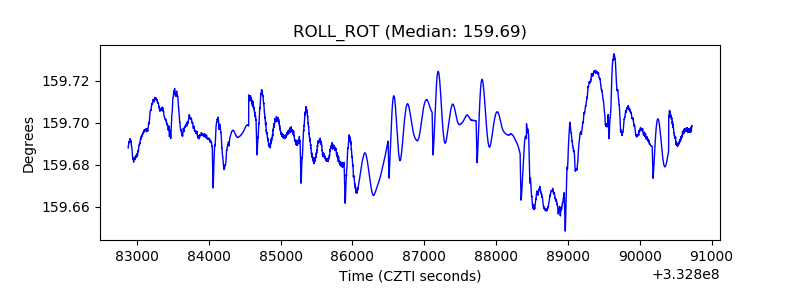 |
| _Roll_DEC | 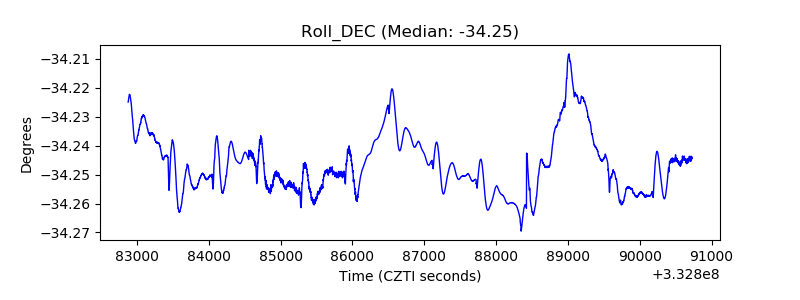 |
| _Roll_RA |  |
| Veto Counter | 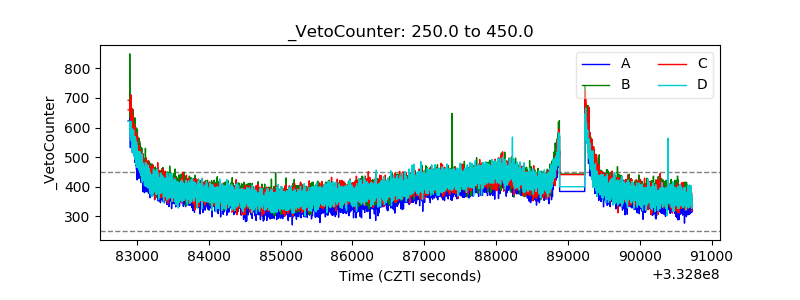 |