| Param | Original file | Final file |
|---|---|---|
| Filename | modeM0/AS1A07_068T01_9000003760_26005cztM0_level2.evt | modeM0/AS1A07_068T01_9000003760_26005cztM0_level2_quad_clean.evt |
| Size (bytes) | 1,469,119,680 | 221,351,040 |
| Size | 1.4 GB | 211.1 MB |
| Events in quadrant A | 9,338,812 | 1,402,273 |
| Events in quadrant B | 8,881,607 | 1,413,075 |
| Events in quadrant C | 8,608,047 | 1,344,483 |
| Events in quadrant D | 16,422,449 | 1,275,754 |
| Mode M0 | |||
|---|---|---|---|
| Quadrant | BADHDUFLAG | Total packets | Discarded packets |
| A | 0 | 39693 | 0 |
| B | 0 | 38167 | 0 |
| C | 0 | 37494 | 0 |
| D | 0 | 61492 | 0 |
| Mode M9 | |||
|---|---|---|---|
| Quadrant | BADHDUFLAG | Total packets | Discarded packets |
| A | 0 | 25 | 0 |
| B | 0 | 25 | 0 |
| C | 0 | 25 | 0 |
| D | 0 | 25 | 0 |
| Quadrant | Total seconds | Saturated seconds | Saturation percentage |
|---|---|---|---|
| A | 18400 | 264 | 1.434783% |
| B | 18400 | 148 | 0.804348% |
| C | 18400 | 173 | 0.940217% |
| D | 18400 | 1503 | 8.168478% |
Noise dominated data is calculated using 1-second bins in cleaned event files. If a bin has >2000 counts, and if more than 50% of those come from <1% of pixels, then it is considered to be noise-dominated and hence unusable.
| Quadrant | # 1 sec bins | Bins with >0 counts | Bins with >2000 counts | High rate bins dominated by noise | Noise dominated (total time) | Noise dominated (detector-on time) | Marked lightcurve |
|---|---|---|---|---|---|---|---|
| A | 20865 | 18404 | 118 | 118 | 0.57% | 0.64% |  |
| B | 20865 | 18404 | 16 | 16 | 0.08% | 0.09% |  |
| C | 20865 | 18404 | 0 | 0 | 0.00% | 0.00% | 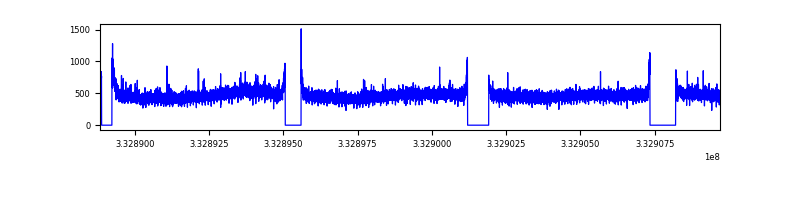 |
| D | 20865 | 18404 | 1269 | 1269 | 6.08% | 6.90% |  |
Top three noisy pixels from each quadrant. If the there are fewer than three noisy pixels in the level2.evt file, extra rows are filled as -1
| Pixel properties | Quadrant properties | ||||||
|---|---|---|---|---|---|---|---|
| Quadrant | DetID | PixID | Counts | Sigma | Mean | Median | Sigma |
| A | 0 | 13 | 780865 | 1749.94 | 2219 | 2172 | 445.0 |
| A | 13 | 254 | 27455 | 56.82 | 2219 | 2172 | 445.0 |
| A | 3 | 137 | 20689 | 41.61 | 2219 | 2172 | 445.0 |
| B | 10 | 245 | 86786 | 202.0 | 2199 | 2143 | 419.0 |
| B | 0 | 190 | 72455 | 167.8 | 2199 | 2143 | 419.0 |
| B | 5 | 172 | 70054 | 162.07 | 2199 | 2143 | 419.0 |
| C | 14 | 238 | 337662 | 679.89 | 2107 | 2118 | 493.5 |
| C | 0 | 207 | 48691 | 94.37 | 2107 | 2118 | 493.5 |
| C | 3 | 233 | 23747 | 43.83 | 2107 | 2118 | 493.5 |
| D | 1 | 52 | 7382711 | 14174.79 | 2068 | 2017 | 520.7 |
| D | 7 | 80 | 685112 | 1311.9 | 2068 | 2017 | 520.7 |
| D | 1 | 3 | 286441 | 546.24 | 2068 | 2017 | 520.7 |
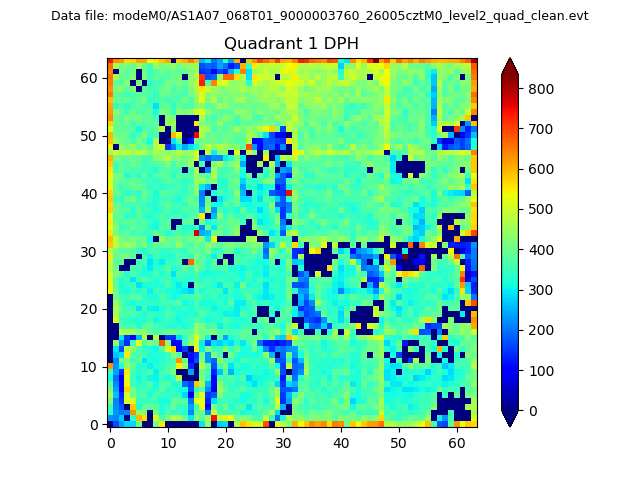
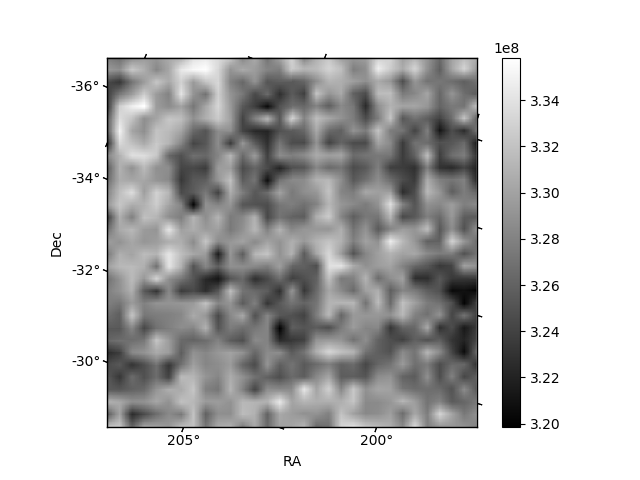
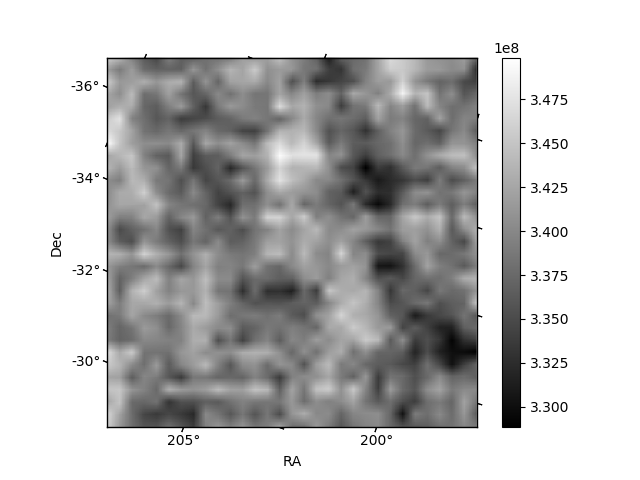
Histogram calculated using DETX and DETY for each event in the final _common_clean file
| Quadrant A | 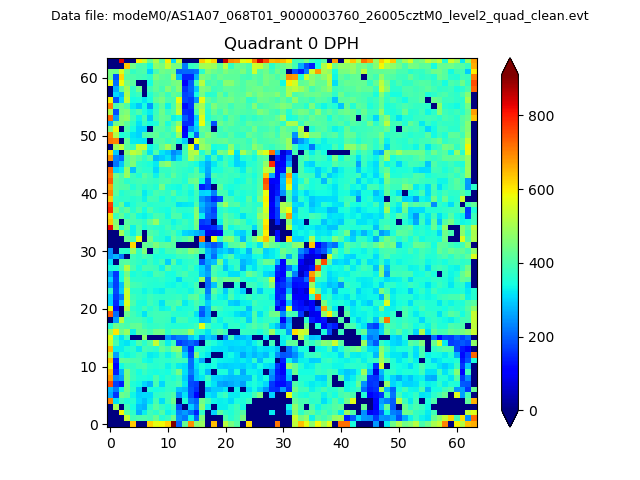 |
 |
Quadrant B |
|---|---|---|---|
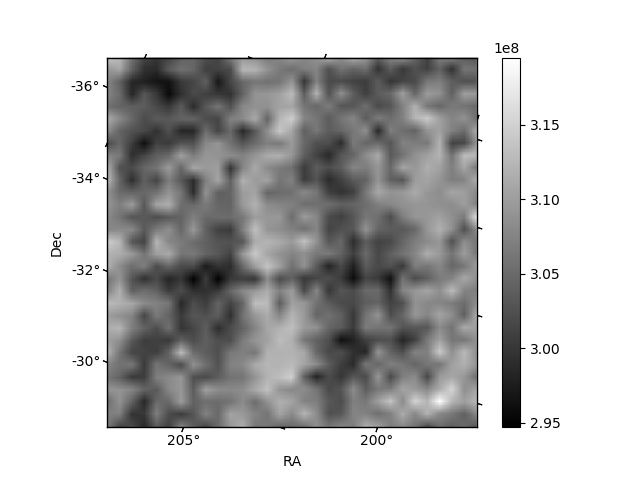
| Quadrant D | 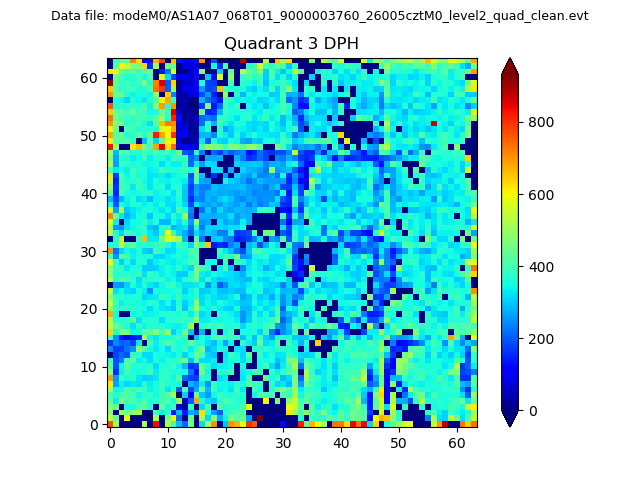 |
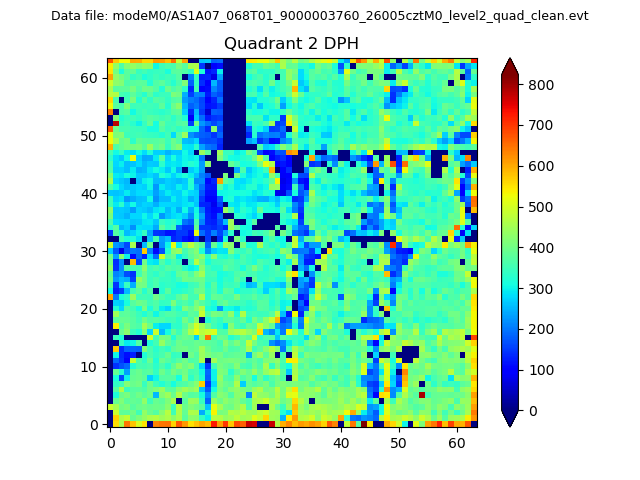 |
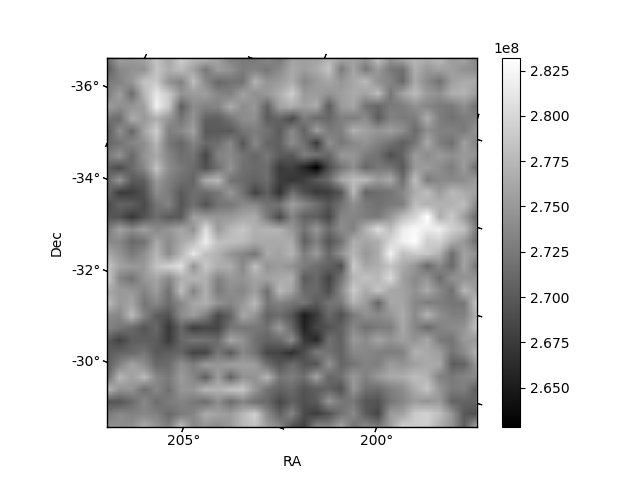
Quadrant C |
| Plot type | Count rate plots | Images |
|---|---|---|
| Comparison with Poisson distribution Blue bars denote a histogram of data divided into 1 sec bins. Red curve is a Poisson curve with rate = median count rate of data. |
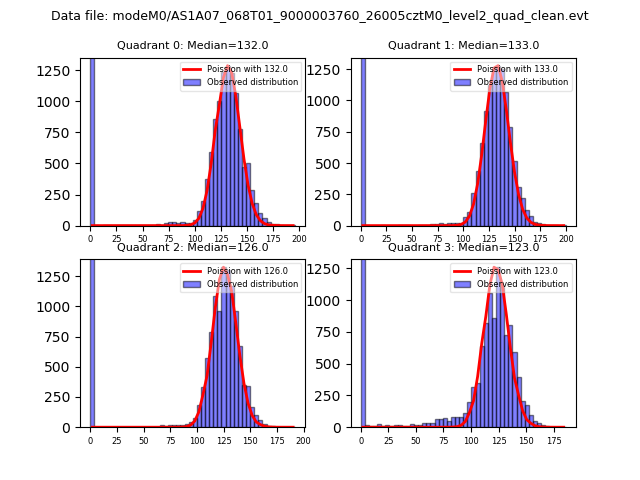 |
 |
| Quadrant-wise count rates Data is divided into 100 sec bins |
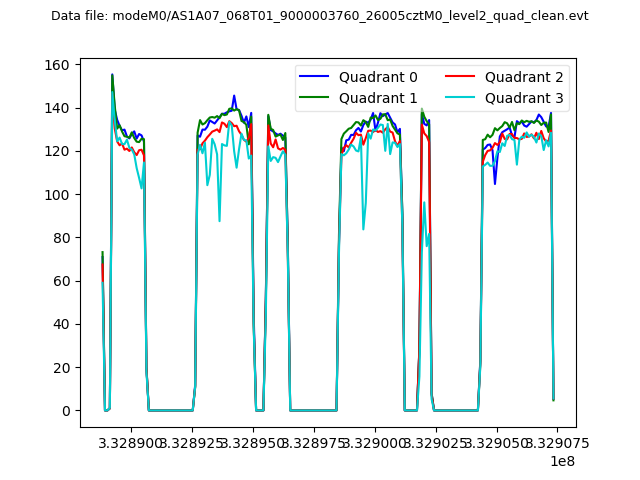 |
|
| Module-wise count rates for Quadrant A Data is divided into 100 sec bins |
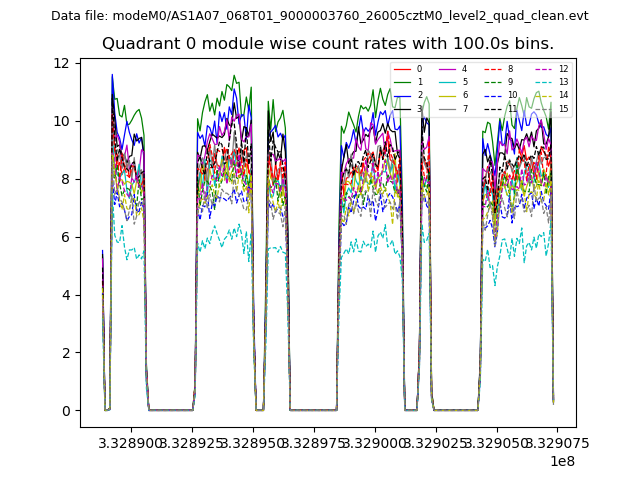 |
 |
| Module-wise count rates for Quadrant B Data is divided into 100 sec bins |
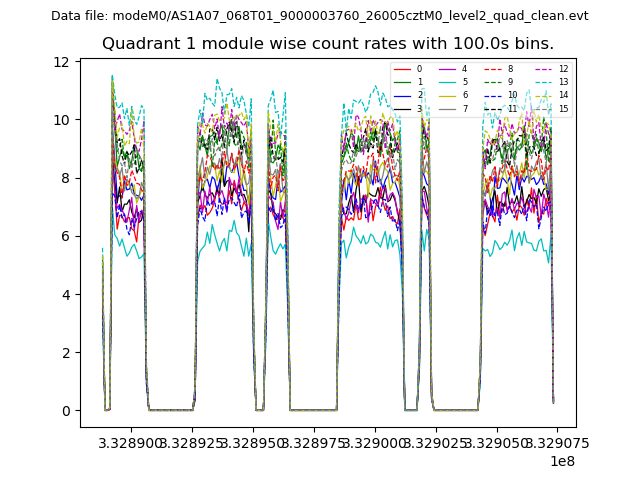 |
 |
| Module-wise count rates for Quadrant C Data is divided into 100 sec bins |
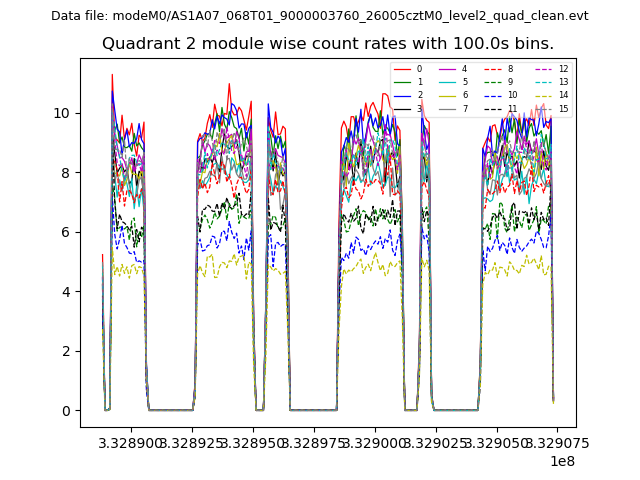 |
 |
| Module-wise count rates for Quadrant D Data is divided into 100 sec bins |
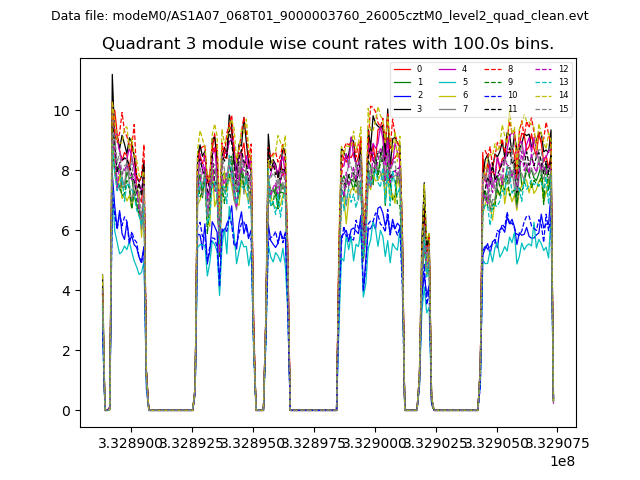 |
 |
| Parameter | Plot |
|---|---|
| CZT HV Monitor | 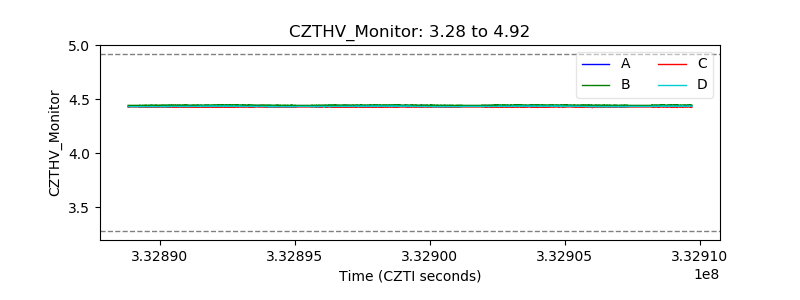 |
| D_VDD | 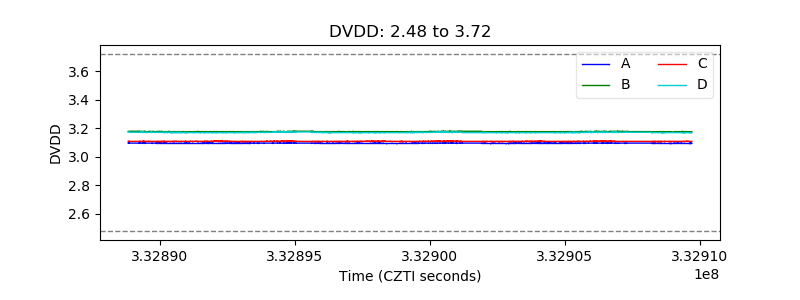 |
| Temperature 1 |  |
| Veto HV Monitor | 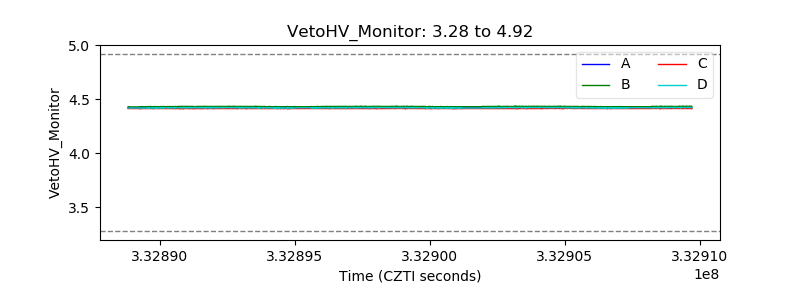 |
| Veto LLD |  |
| Alpha Counter | 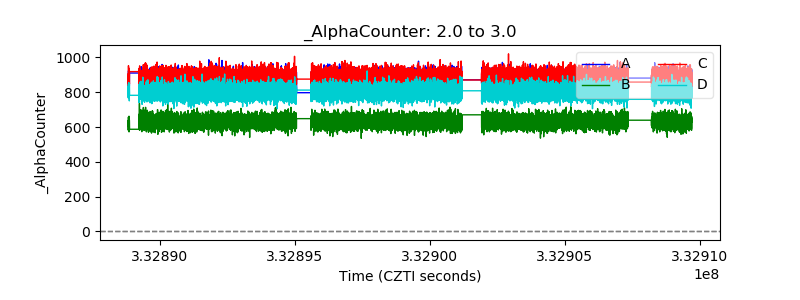 |
| _CPM_Rate | 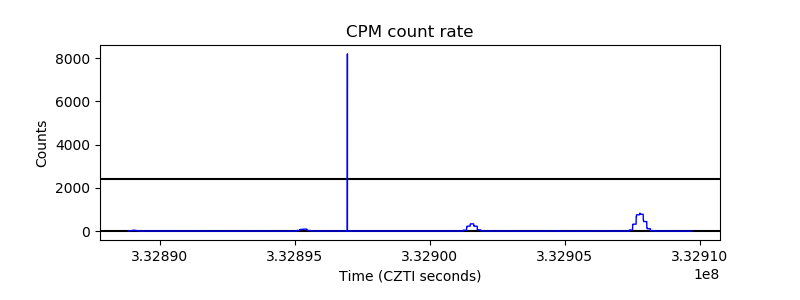 |
| CZT Counter | 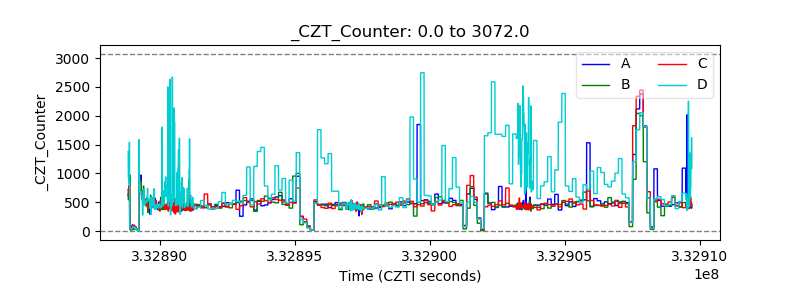 |
| +2.5 Volts monitor |  |
| +5 Volts monitor |  |
| _ROLL_ROT | 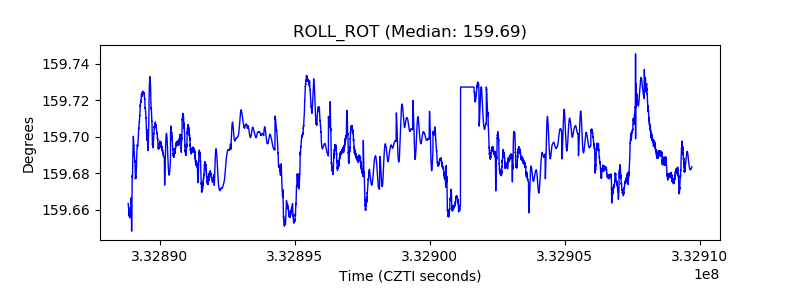 |
| _Roll_DEC | 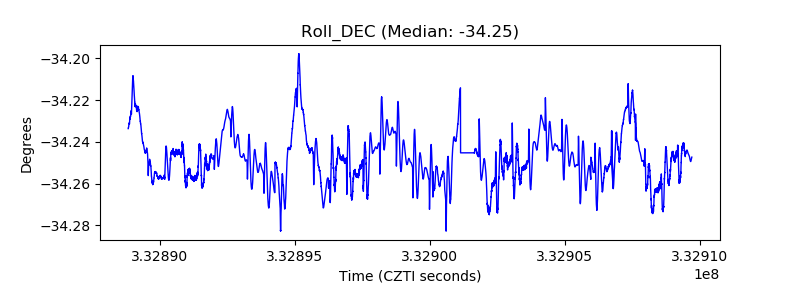 |
| _Roll_RA | 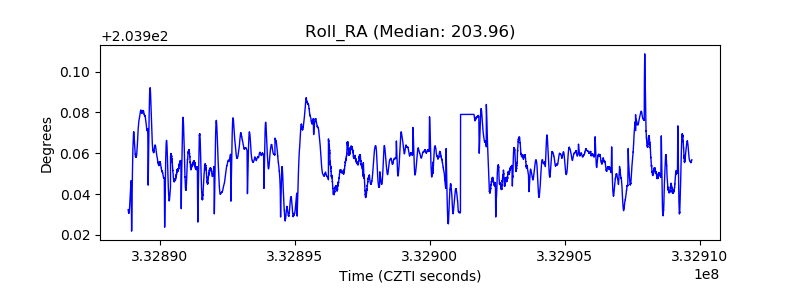 |
| Veto Counter | 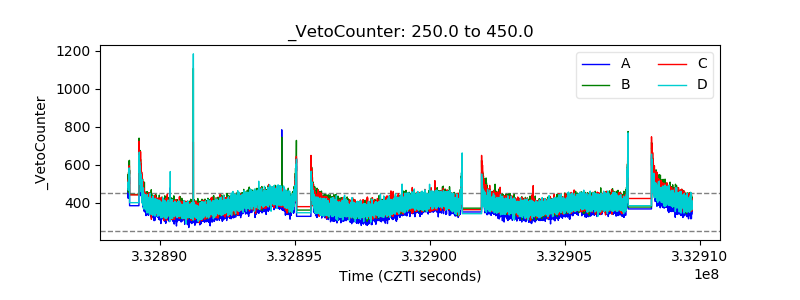 |