| Param | Original file | Final file |
|---|---|---|
| Filename | modeM0/AS1A07_068T01_9000003760_26006cztM0_level2.evt | modeM0/AS1A07_068T01_9000003760_26006cztM0_level2_quad_clean.evt |
| Size (bytes) | 616,037,760 | 68,166,720 |
| Size | 587.5 MB | 65.0 MB |
| Events in quadrant A | 3,736,665 | 420,932 |
| Events in quadrant B | 4,217,753 | 402,680 |
| Events in quadrant C | 3,295,778 | 403,862 |
| Events in quadrant D | 6,947,943 | 363,870 |
| Mode M0 | |||
|---|---|---|---|
| Quadrant | BADHDUFLAG | Total packets | Discarded packets |
| A | 0 | 15267 | 0 |
| B | 0 | 16706 | 0 |
| C | 0 | 13938 | 0 |
| D | 0 | 25254 | 0 |
| Mode M9 | |||
|---|---|---|---|
| Quadrant | BADHDUFLAG | Total packets | Discarded packets |
| A | 0 | 12 | 0 |
| B | 0 | 13 | 0 |
| C | 0 | 13 | 0 |
| D | 0 | 13 | 0 |
| Quadrant | Total seconds | Saturated seconds | Saturation percentage |
|---|---|---|---|
| A | 6771 | 133 | 1.964259% |
| B | 6771 | 389 | 5.745089% |
| C | 6771 | 101 | 1.491656% |
| D | 6771 | 972 | 14.355339% |
Noise dominated data is calculated using 1-second bins in cleaned event files. If a bin has >2000 counts, and if more than 50% of those come from <1% of pixels, then it is considered to be noise-dominated and hence unusable.
| Quadrant | # 1 sec bins | Bins with >0 counts | Bins with >2000 counts | High rate bins dominated by noise | Noise dominated (total time) | Noise dominated (detector-on time) | Marked lightcurve |
|---|---|---|---|---|---|---|---|
| A | 7756 | 6771 | 61 | 61 | 0.79% | 0.90% | 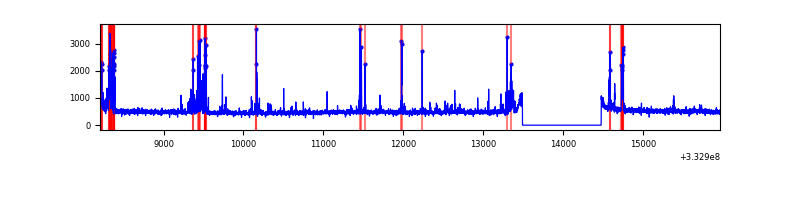 |
| B | 7756 | 6771 | 258 | 258 | 3.33% | 3.81% | 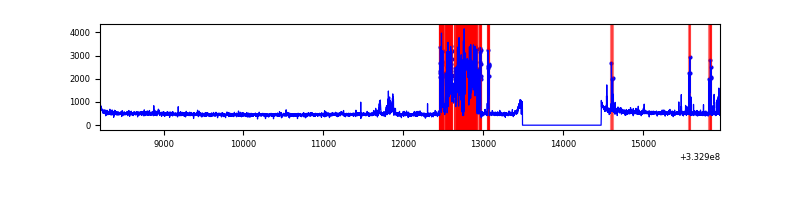 |
| C | 7756 | 6771 | 0 | 0 | 0.00% | 0.00% |  |
| D | 7756 | 6771 | 819 | 819 | 10.56% | 12.10% | 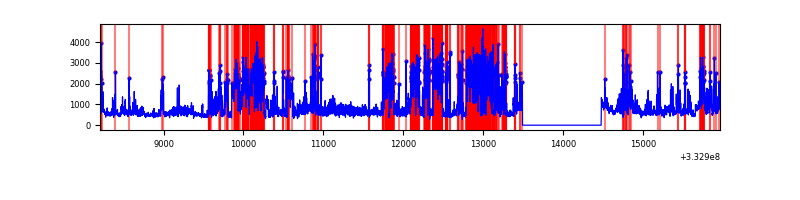 |
Top three noisy pixels from each quadrant. If the there are fewer than three noisy pixels in the level2.evt file, extra rows are filled as -1
| Pixel properties | Quadrant properties | ||||||
|---|---|---|---|---|---|---|---|
| Quadrant | DetID | PixID | Counts | Sigma | Mean | Median | Sigma |
| A | 0 | 13 | 472205 | 2773.45 | 847 | 830 | 170.0 |
| A | 13 | 254 | 10231 | 55.31 | 847 | 830 | 170.0 |
| A | 3 | 137 | 7680 | 40.3 | 847 | 830 | 170.0 |
| B | 10 | 245 | 905383 | 5697.06 | 829 | 808 | 158.8 |
| B | 0 | 190 | 56770 | 352.45 | 829 | 808 | 158.8 |
| B | 12 | 111 | 19703 | 119.0 | 829 | 808 | 158.8 |
| C | 14 | 238 | 131781 | 686.55 | 810 | 815 | 190.8 |
| C | 3 | 233 | 7645 | 35.8 | 810 | 815 | 190.8 |
| C | 13 | 61 | 5549 | 24.82 | 810 | 815 | 190.8 |
| D | 1 | 52 | 3936244 | 20880.05 | 780 | 761 | 188.5 |
| D | 8 | 195 | 29653 | 153.29 | 780 | 761 | 188.5 |
| D | 2 | 234 | 24607 | 126.52 | 780 | 761 | 188.5 |
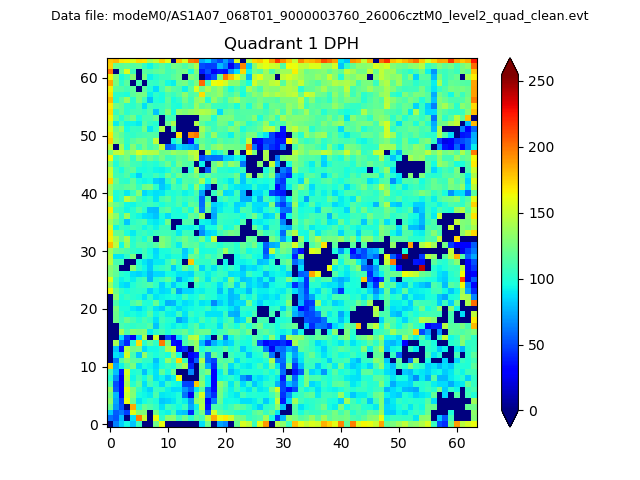
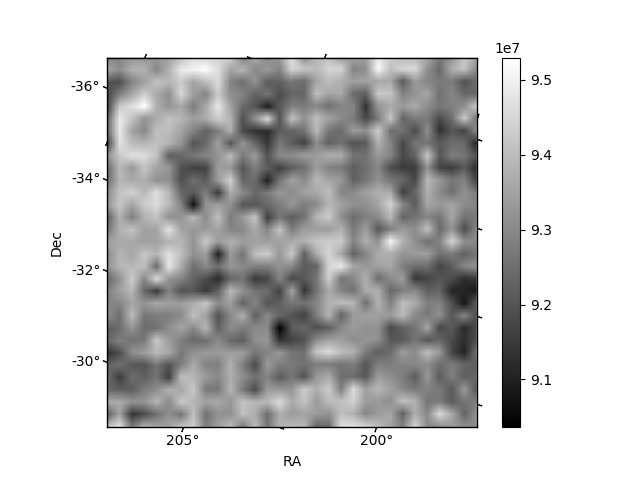
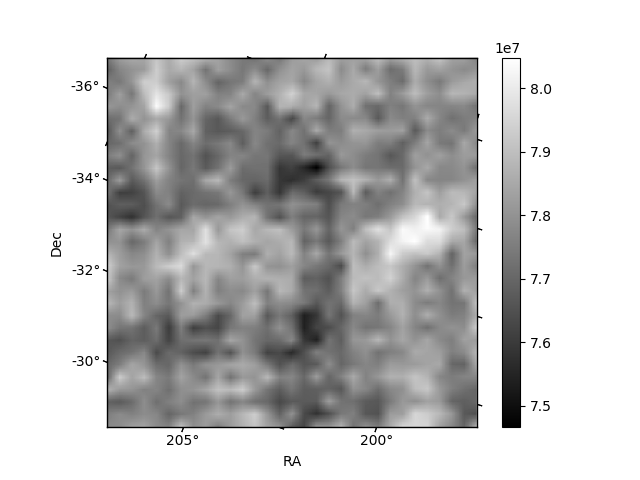
Histogram calculated using DETX and DETY for each event in the final _common_clean file
| Quadrant A | 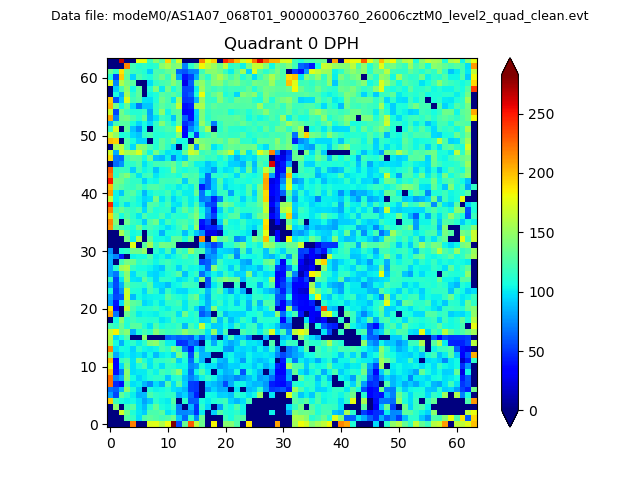 |
 |
Quadrant B |
|---|---|---|---|
| Quadrant D |  |
 |
Quadrant C |
| Plot type | Count rate plots | Images |
|---|---|---|
| Comparison with Poisson distribution Blue bars denote a histogram of data divided into 1 sec bins. Red curve is a Poisson curve with rate = median count rate of data. |
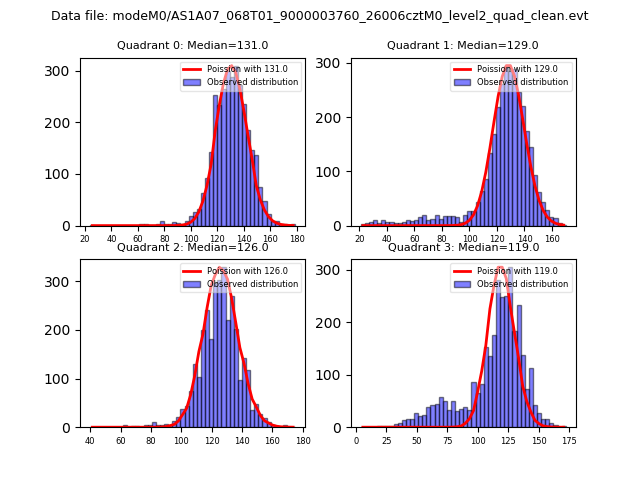 |
 |
| Quadrant-wise count rates Data is divided into 100 sec bins |
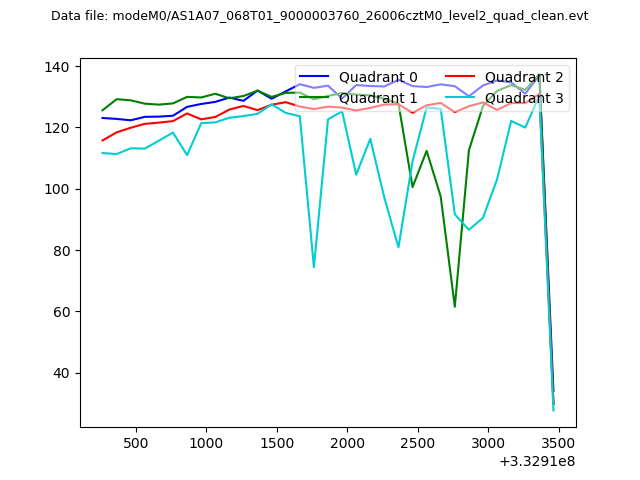 |
|
| Module-wise count rates for Quadrant A Data is divided into 100 sec bins |
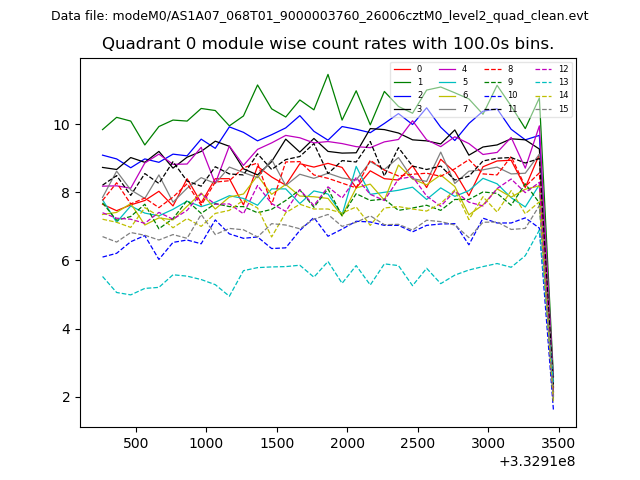 |
 |
| Module-wise count rates for Quadrant B Data is divided into 100 sec bins |
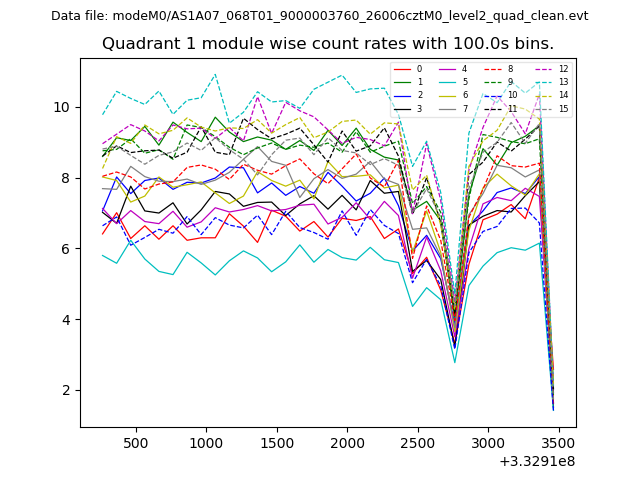 |
 |
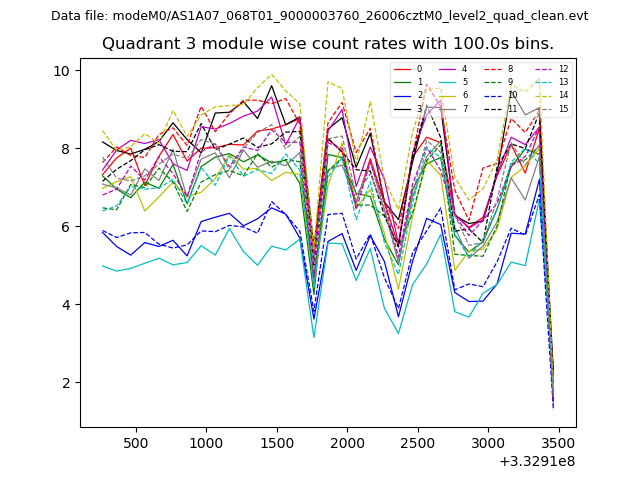
| Module-wise count rates for Quadrant C Data is divided into 100 sec bins |
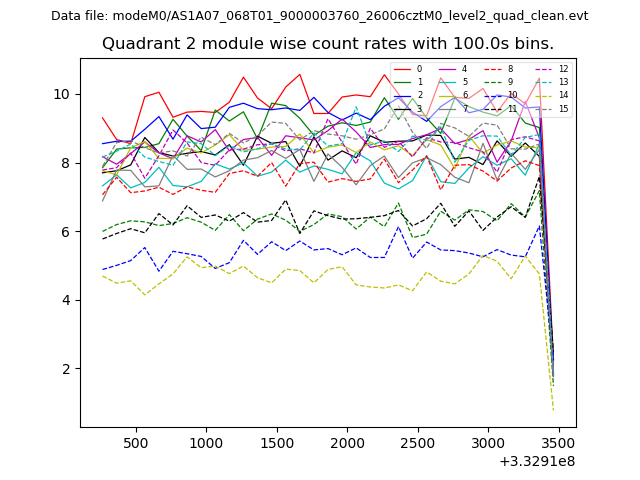 |
 |
| Module-wise count rates for Quadrant D Data is divided into 100 sec bins |
 |
 |
| Parameter | Plot |
|---|---|
| CZT HV Monitor | 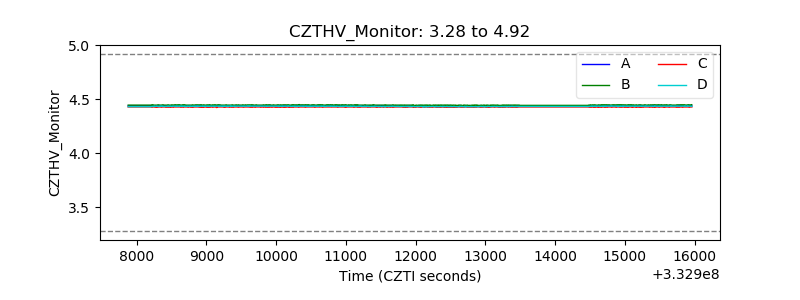 |
| D_VDD | 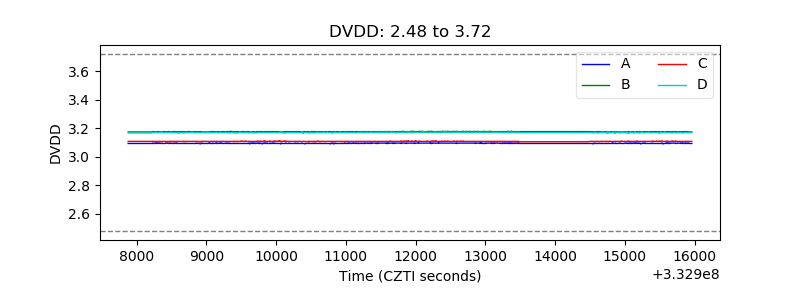 |
| Temperature 1 | 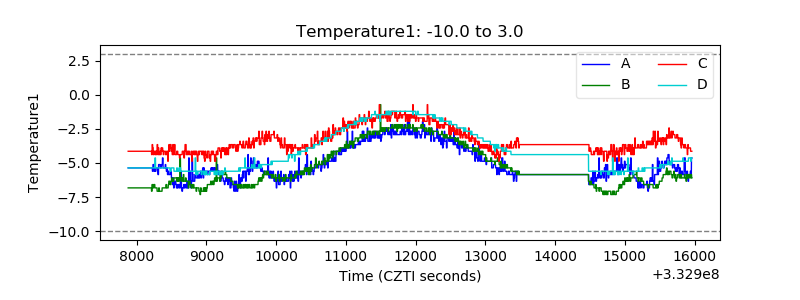 |
| Veto HV Monitor | 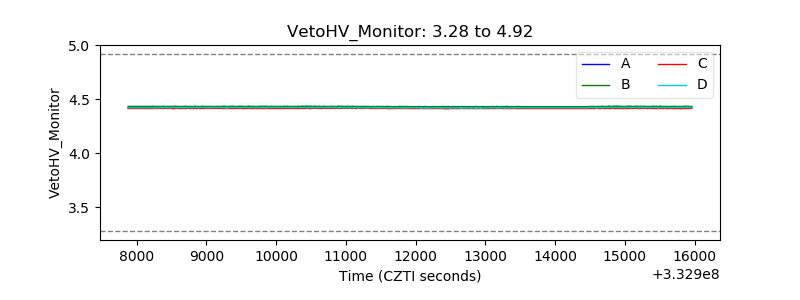 |
| Veto LLD | 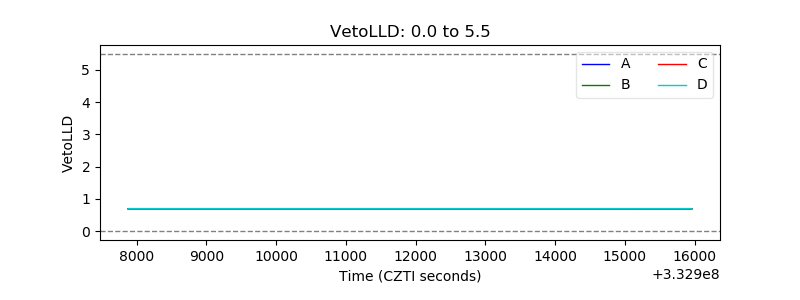 |
| Alpha Counter | 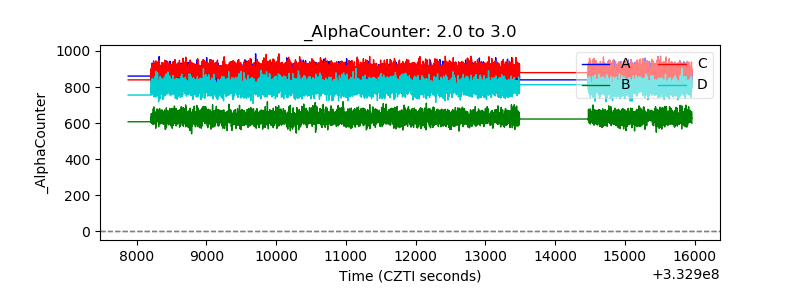 |
| _CPM_Rate | 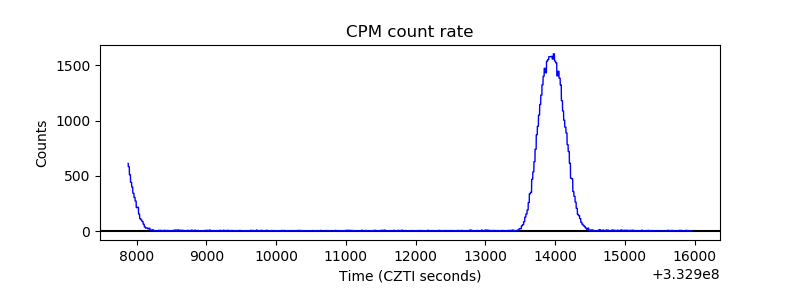 |
| CZT Counter |  |
| +2.5 Volts monitor |  |
| +5 Volts monitor |  |
| _ROLL_ROT | 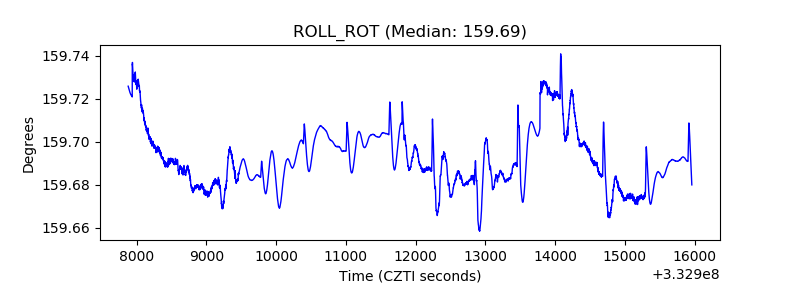 |
| _Roll_DEC | 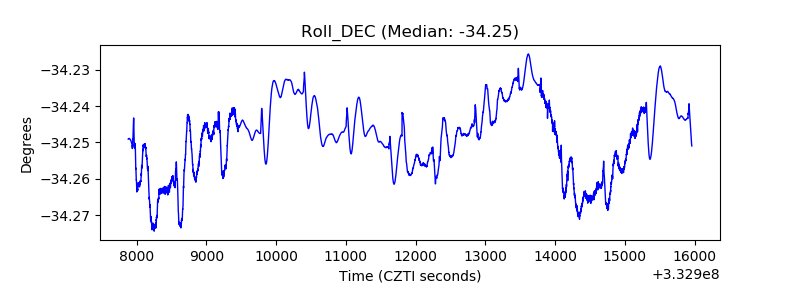 |
| _Roll_RA | 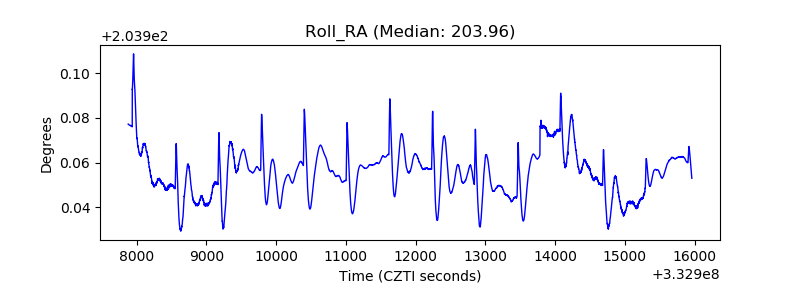 |
| Veto Counter | 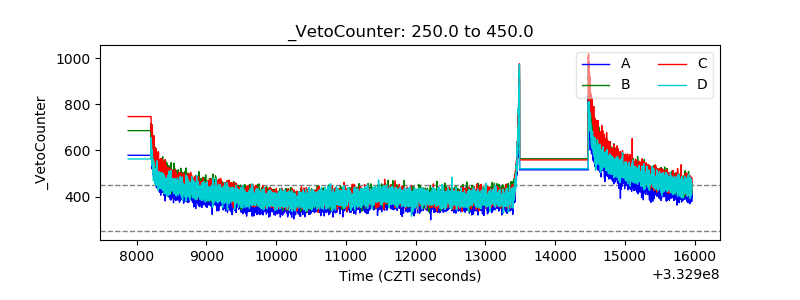 |