| Param | Original file | Final file |
|---|---|---|
| Filename | modeM0/AS1A07_068T01_9000003760_26008cztM0_level2.evt | modeM0/AS1A07_068T01_9000003760_26008cztM0_level2_quad_clean.evt |
| Size (bytes) | 552,697,920 | 80,709,120 |
| Size | 527.1 MB | 77.0 MB |
| Events in quadrant A | 3,778,555 | 506,349 |
| Events in quadrant B | 3,663,794 | 510,168 |
| Events in quadrant C | 3,382,245 | 489,061 |
| Events in quadrant D | 5,467,570 | 479,078 |
| Mode M0 | |||
|---|---|---|---|
| Quadrant | BADHDUFLAG | Total packets | Discarded packets |
| A | 0 | 15266 | 0 |
| B | 0 | 14940 | 0 |
| C | 0 | 14137 | 0 |
| D | 0 | 20729 | 0 |
| Mode M9 | |||
|---|---|---|---|
| Quadrant | BADHDUFLAG | Total packets | Discarded packets |
| A | 0 | 16 | 0 |
| B | 0 | 17 | 0 |
| C | 0 | 17 | 0 |
| D | 0 | 17 | 0 |
| Quadrant | Total seconds | Saturated seconds | Saturation percentage |
|---|---|---|---|
| A | 6579 | 139 | 2.112783% |
| B | 6579 | 125 | 1.899985% |
| C | 6579 | 131 | 1.991184% |
| D | 6579 | 324 | 4.924761% |
Noise dominated data is calculated using 1-second bins in cleaned event files. If a bin has >2000 counts, and if more than 50% of those come from <1% of pixels, then it is considered to be noise-dominated and hence unusable.
| Quadrant | # 1 sec bins | Bins with >0 counts | Bins with >2000 counts | High rate bins dominated by noise | Noise dominated (total time) | Noise dominated (detector-on time) | Marked lightcurve |
|---|---|---|---|---|---|---|---|
| A | 7704 | 6580 | 72 | 72 | 0.93% | 1.09% | 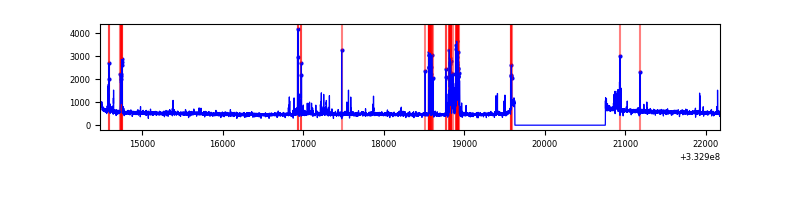 |
| B | 7704 | 6579 | 39 | 39 | 0.51% | 0.59% | 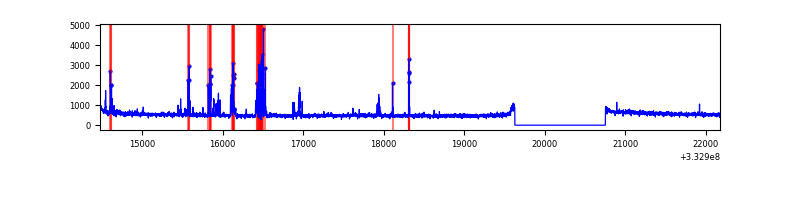 |
| C | 7704 | 6579 | 0 | 0 | 0.00% | 0.00% | 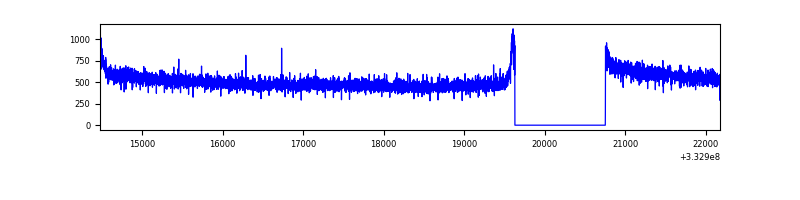 |
| D | 7704 | 6579 | 241 | 241 | 3.13% | 3.66% |  |
Top three noisy pixels from each quadrant. If the there are fewer than three noisy pixels in the level2.evt file, extra rows are filled as -1
| Pixel properties | Quadrant properties | ||||||
|---|---|---|---|---|---|---|---|
| Quadrant | DetID | PixID | Counts | Sigma | Mean | Median | Sigma |
| A | 0 | 13 | 444521 | 2582.68 | 865 | 850 | 171.8 |
| A | 13 | 254 | 9654 | 51.25 | 865 | 850 | 171.8 |
| A | 3 | 137 | 7751 | 40.17 | 865 | 850 | 171.8 |
| B | 10 | 245 | 273624 | 1703.37 | 856 | 838 | 160.1 |
| B | 0 | 190 | 24623 | 148.52 | 856 | 838 | 160.1 |
| B | 12 | 111 | 19497 | 116.51 | 856 | 838 | 160.1 |
| C | 14 | 238 | 136876 | 701.84 | 832 | 838 | 193.8 |
| C | 3 | 233 | 5940 | 26.32 | 832 | 838 | 193.8 |
| C | 13 | 61 | 5695 | 25.06 | 832 | 838 | 193.8 |
| D | 1 | 52 | 2269039 | 11289.4 | 826 | 805 | 200.9 |
| D | 12 | 233 | 44265 | 216.31 | 826 | 805 | 200.9 |
| D | 2 | 234 | 25422 | 122.52 | 826 | 805 | 200.9 |
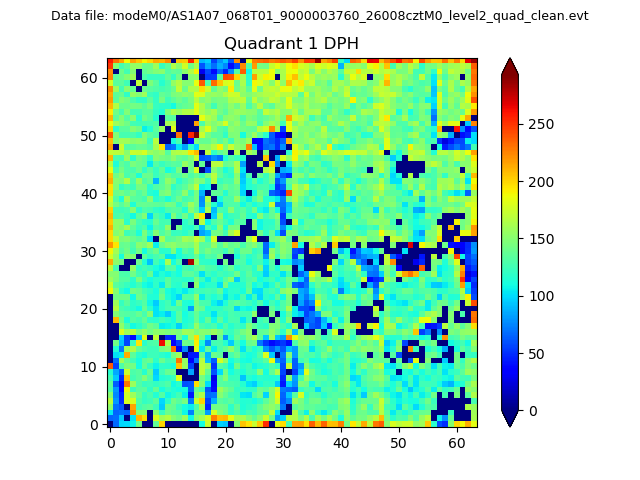
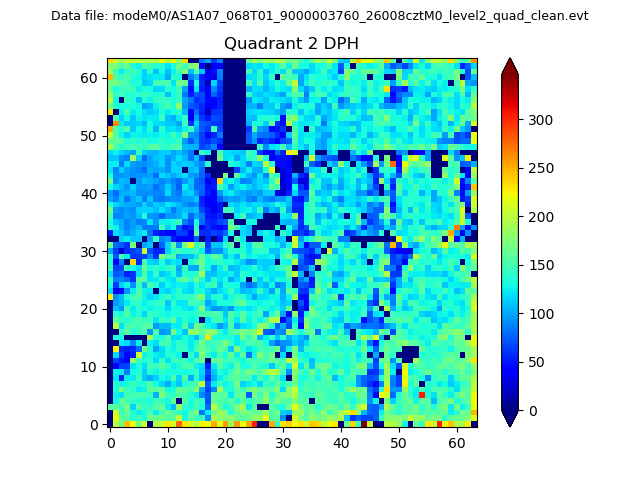
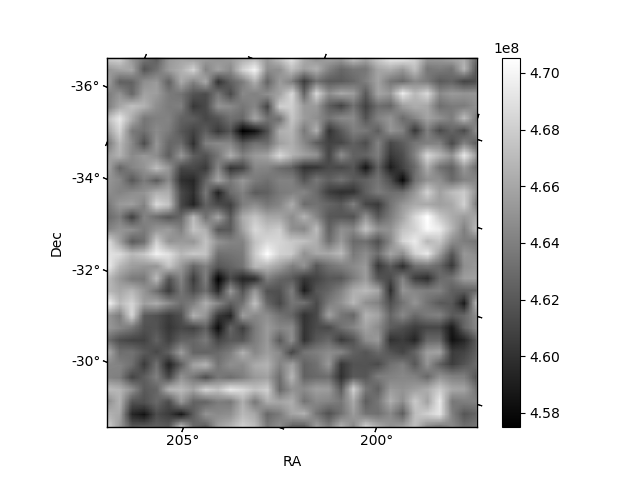
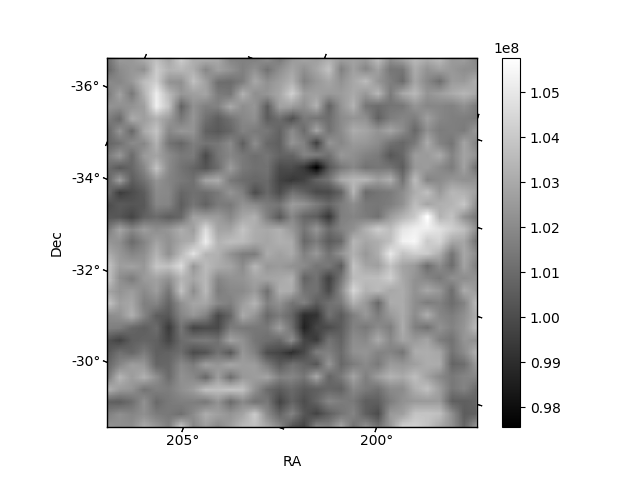
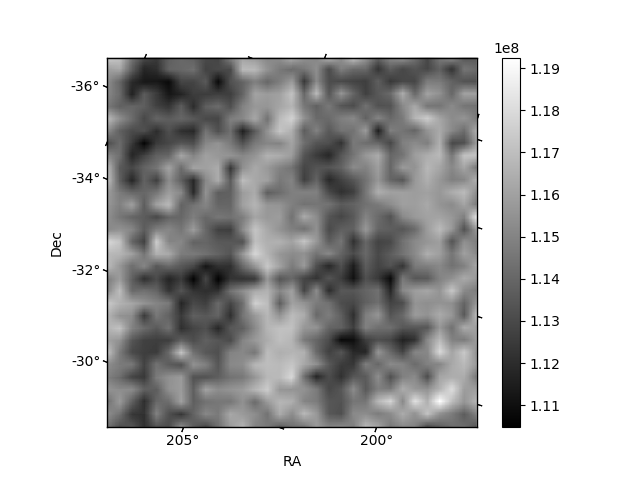
Histogram calculated using DETX and DETY for each event in the final _common_clean file
| Quadrant A | 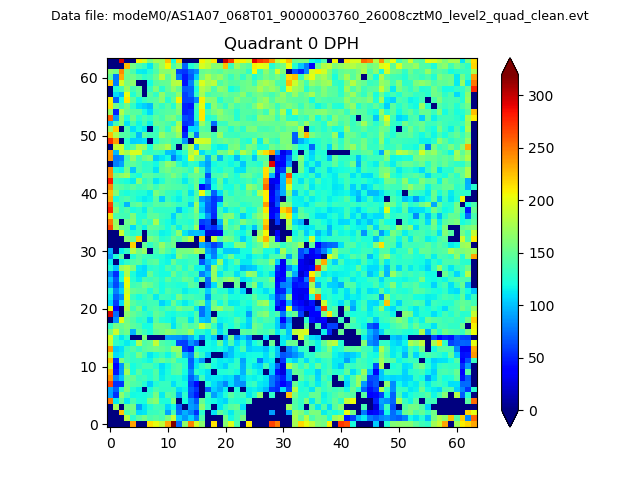 |
 |
Quadrant B |
|---|---|---|---|
| Quadrant D | 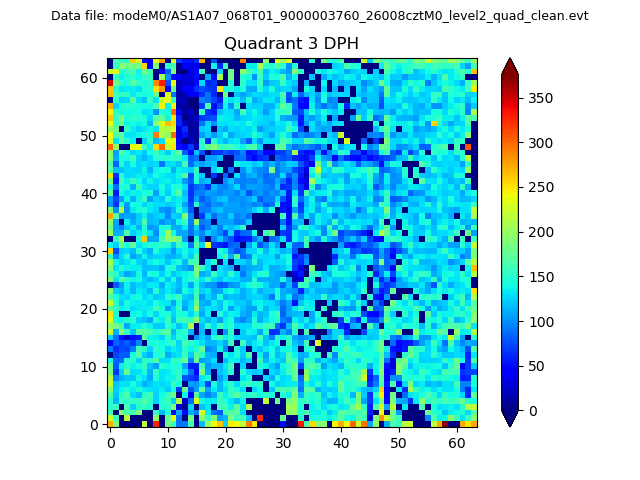 |
 |
Quadrant C |
| Plot type | Count rate plots | Images |
|---|---|---|
| Comparison with Poisson distribution Blue bars denote a histogram of data divided into 1 sec bins. Red curve is a Poisson curve with rate = median count rate of data. |
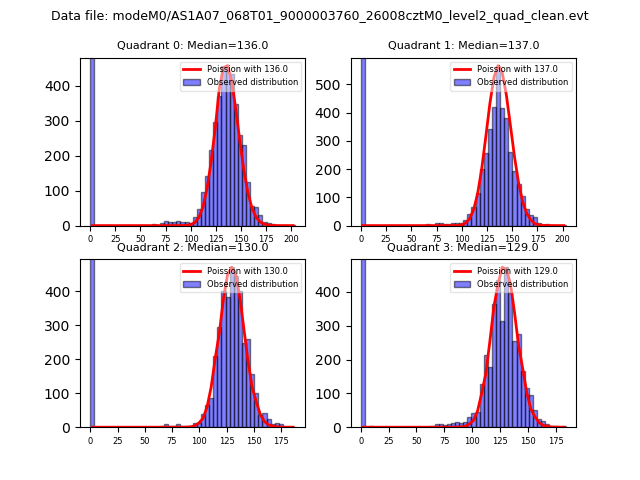 |
 |
| Quadrant-wise count rates Data is divided into 100 sec bins |
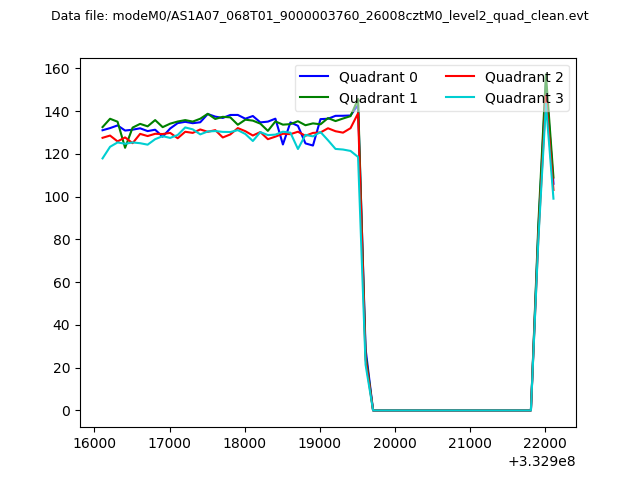 |
|
| Module-wise count rates for Quadrant A Data is divided into 100 sec bins |
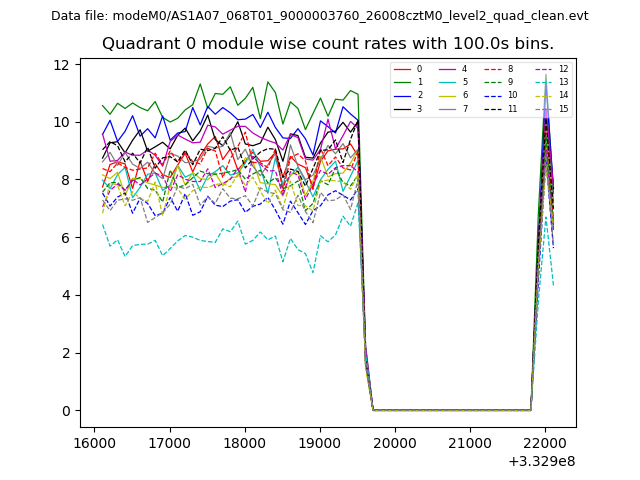 |
 |
| Module-wise count rates for Quadrant B Data is divided into 100 sec bins |
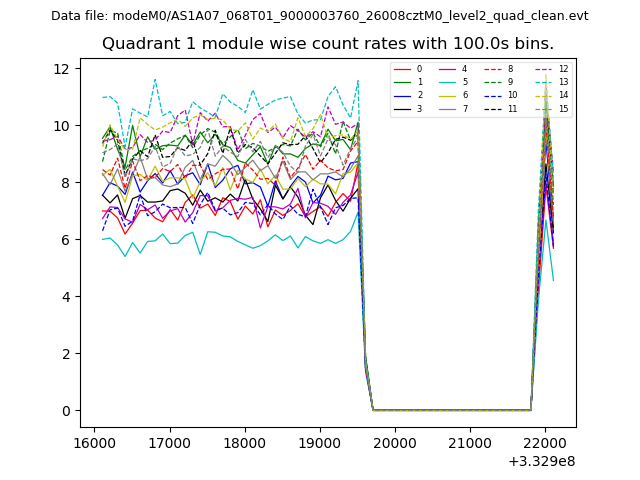 |
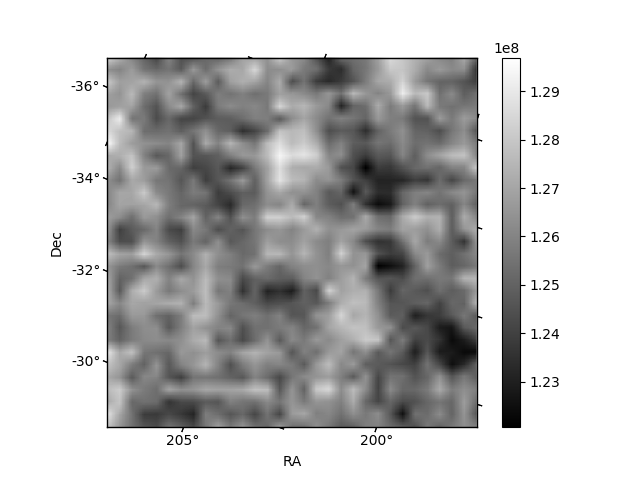 |
| Module-wise count rates for Quadrant C Data is divided into 100 sec bins |
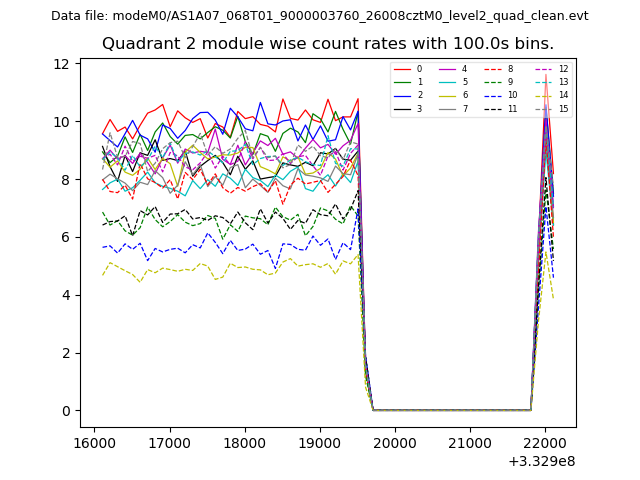 |
 |
| Module-wise count rates for Quadrant D Data is divided into 100 sec bins |
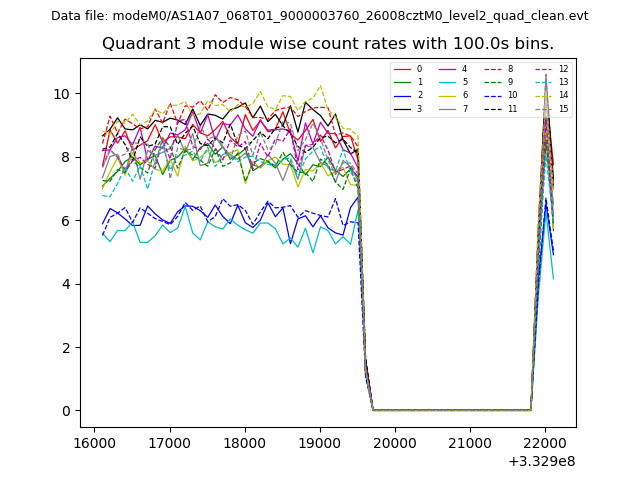 |
 |
| Parameter | Plot |
|---|---|
| CZT HV Monitor | 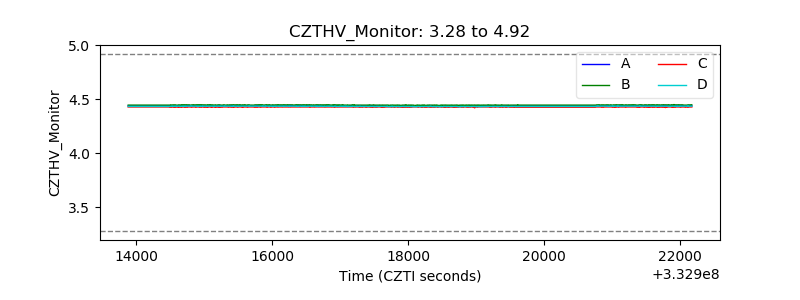 |
| D_VDD | 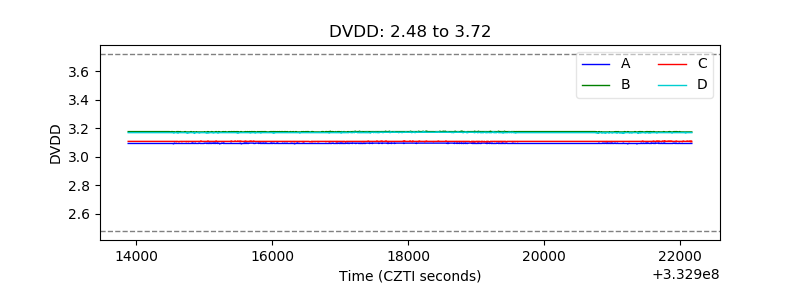 |
| Temperature 1 | 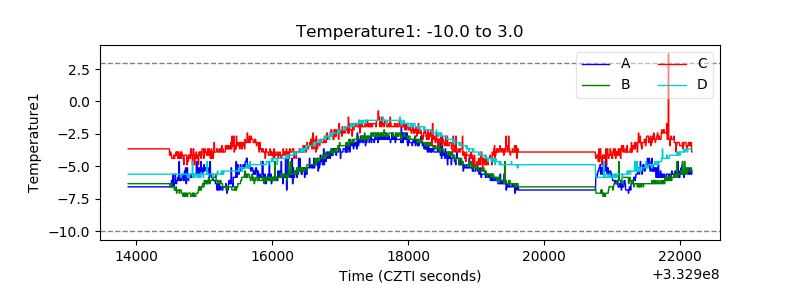 |
| Veto HV Monitor | 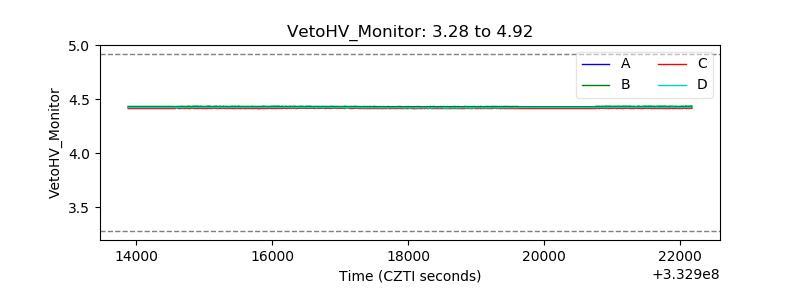 |
| Veto LLD | 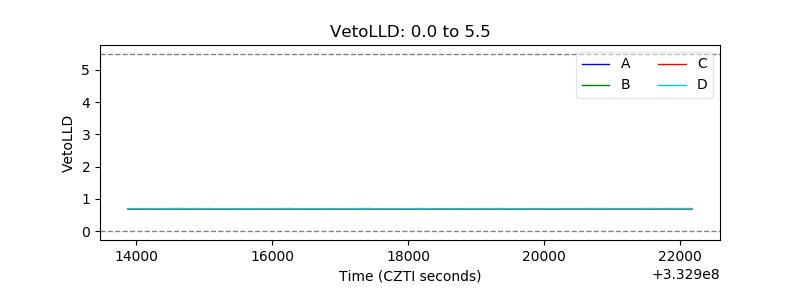 |
| Alpha Counter | 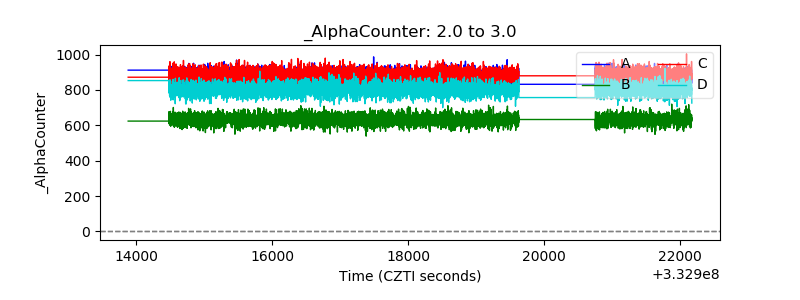 |
| _CPM_Rate | 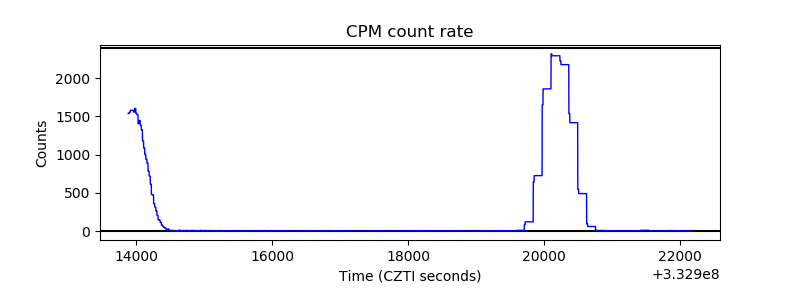 |
| CZT Counter | 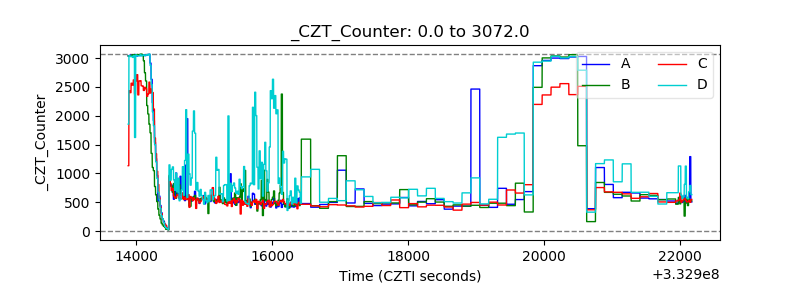 |
| +2.5 Volts monitor |  |
| +5 Volts monitor |  |
| _ROLL_ROT | 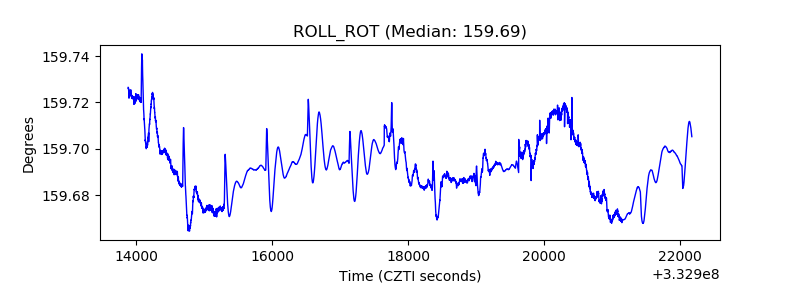 |
| _Roll_DEC | 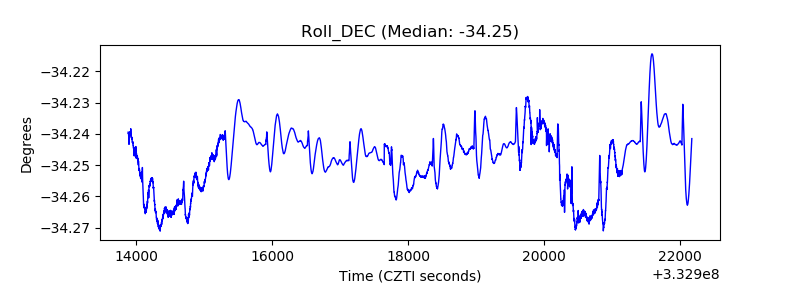 |
| _Roll_RA | 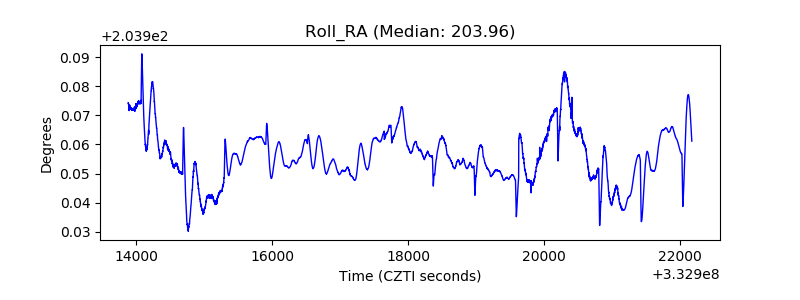 |
| Veto Counter | 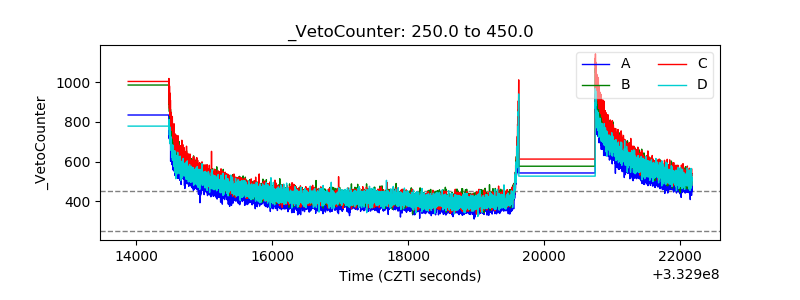 |