| Param | Original file | Final file |
|---|---|---|
| Filename | modeM0/AS1A07_068T01_9000003760_26009cztM0_level2.evt | modeM0/AS1A07_068T01_9000003760_26009cztM0_level2_quad_clean.evt |
| Size (bytes) | 590,549,760 | 93,271,680 |
| Size | 563.2 MB | 89.0 MB |
| Events in quadrant A | 3,642,494 | 624,605 |
| Events in quadrant B | 3,321,131 | 633,558 |
| Events in quadrant C | 3,245,356 | 606,847 |
| Events in quadrant D | 7,266,927 | 537,236 |
| Mode M0 | |||
|---|---|---|---|
| Quadrant | BADHDUFLAG | Total packets | Discarded packets |
| A | 0 | 14666 | 0 |
| B | 0 | 13706 | 0 |
| C | 0 | 13543 | 0 |
| D | 0 | 25780 | 0 |
| Mode M9 | |||
|---|---|---|---|
| Quadrant | BADHDUFLAG | Total packets | Discarded packets |
| A | 0 | 12 | 0 |
| B | 0 | 12 | 0 |
| C | 0 | 12 | 0 |
| D | 0 | 12 | 0 |
| Quadrant | Total seconds | Saturated seconds | Saturation percentage |
|---|---|---|---|
| A | 6040 | 160 | 2.649007% |
| B | 6040 | 66 | 1.092715% |
| C | 6040 | 115 | 1.903974% |
| D | 6040 | 1123 | 18.592715% |
Noise dominated data is calculated using 1-second bins in cleaned event files. If a bin has >2000 counts, and if more than 50% of those come from <1% of pixels, then it is considered to be noise-dominated and hence unusable.
| Quadrant | # 1 sec bins | Bins with >0 counts | Bins with >2000 counts | High rate bins dominated by noise | Noise dominated (total time) | Noise dominated (detector-on time) | Marked lightcurve |
|---|---|---|---|---|---|---|---|
| A | 7265 | 6040 | 91 | 91 | 1.25% | 1.51% | 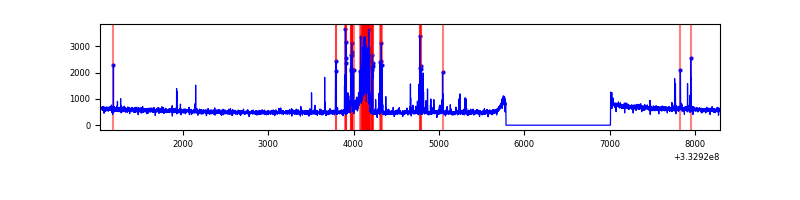 |
| B | 7265 | 6040 | 2 | 2 | 0.03% | 0.03% |  |
| C | 7265 | 6040 | 0 | 0 | 0.00% | 0.00% | 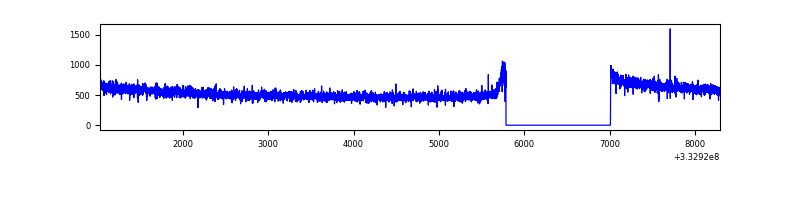 |
| D | 7265 | 6040 | 1047 | 1047 | 14.41% | 17.33% | 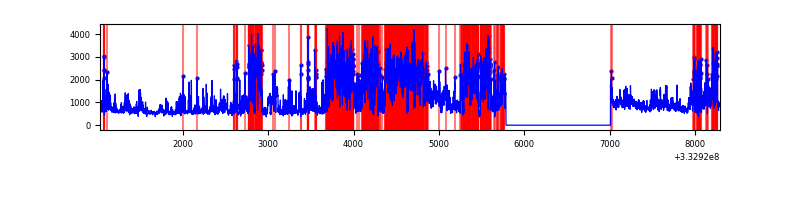 |
Top three noisy pixels from each quadrant. If the there are fewer than three noisy pixels in the level2.evt file, extra rows are filled as -1
| Pixel properties | Quadrant properties | ||||||
|---|---|---|---|---|---|---|---|
| Quadrant | DetID | PixID | Counts | Sigma | Mean | Median | Sigma |
| A | 0 | 13 | 428887 | 2581.55 | 834 | 821 | 165.8 |
| A | 13 | 254 | 8760 | 47.88 | 834 | 821 | 165.8 |
| A | 0 | 226 | 7157 | 38.21 | 834 | 821 | 165.8 |
| B | 0 | 190 | 60882 | 395.77 | 819 | 800 | 151.8 |
| B | 10 | 245 | 42167 | 272.49 | 819 | 800 | 151.8 |
| B | 12 | 111 | 18365 | 115.7 | 819 | 800 | 151.8 |
| C | 14 | 238 | 132224 | 716.75 | 798 | 805 | 183.4 |
| C | 3 | 233 | 6389 | 30.45 | 798 | 805 | 183.4 |
| C | 13 | 61 | 5513 | 25.68 | 798 | 805 | 183.4 |
| D | 1 | 52 | 4050486 | 22074.33 | 766 | 750 | 183.5 |
| D | 12 | 233 | 274851 | 1494.07 | 766 | 750 | 183.5 |
| D | 2 | 234 | 22934 | 120.92 | 766 | 750 | 183.5 |
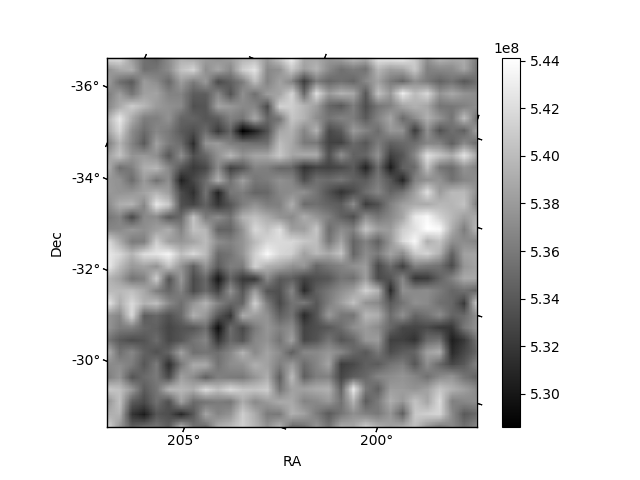
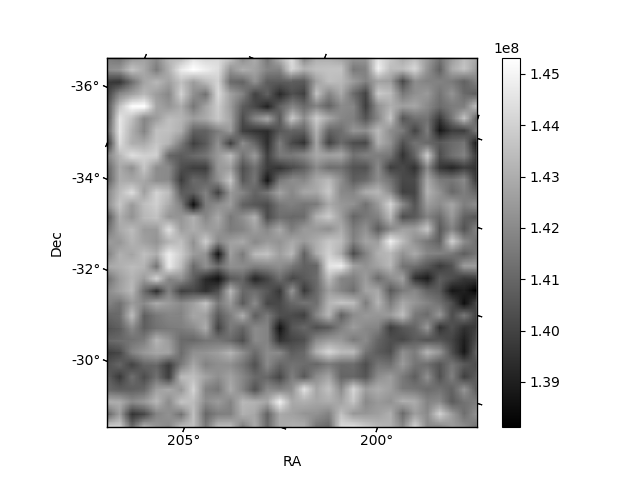
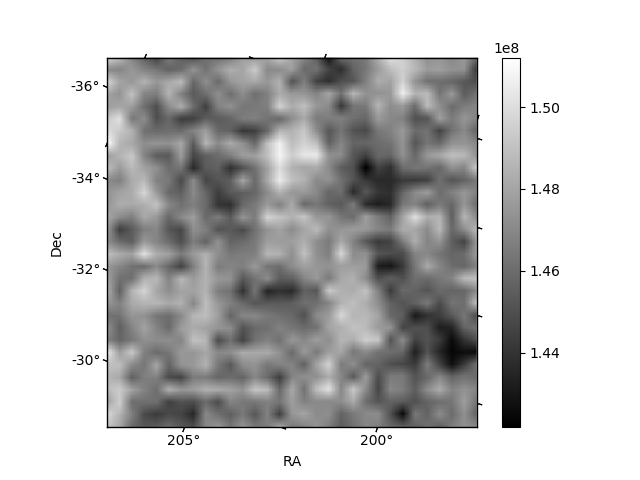
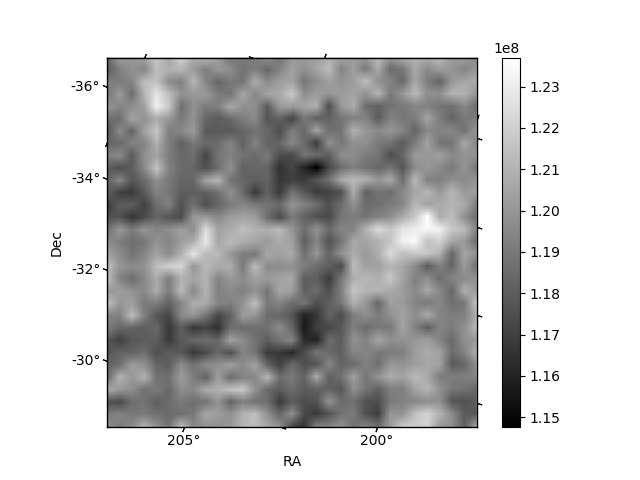
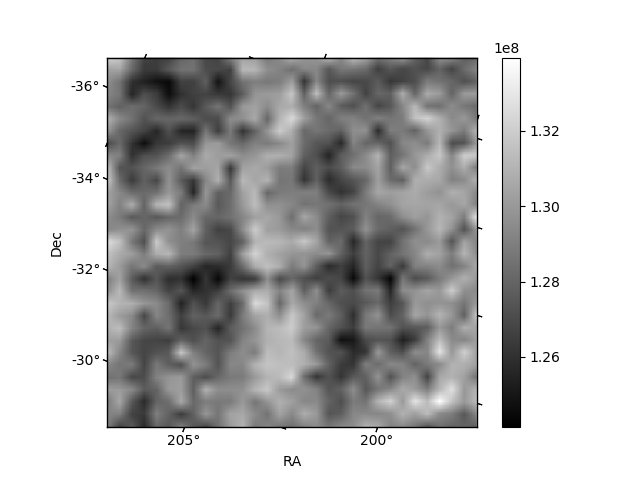
Histogram calculated using DETX and DETY for each event in the final _common_clean file
| Quadrant A | 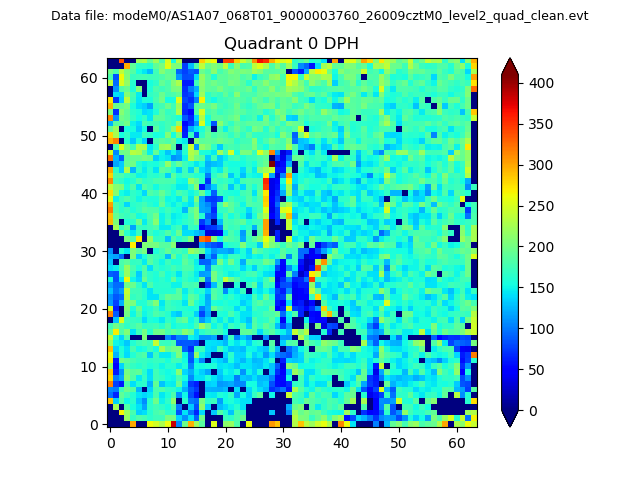 |
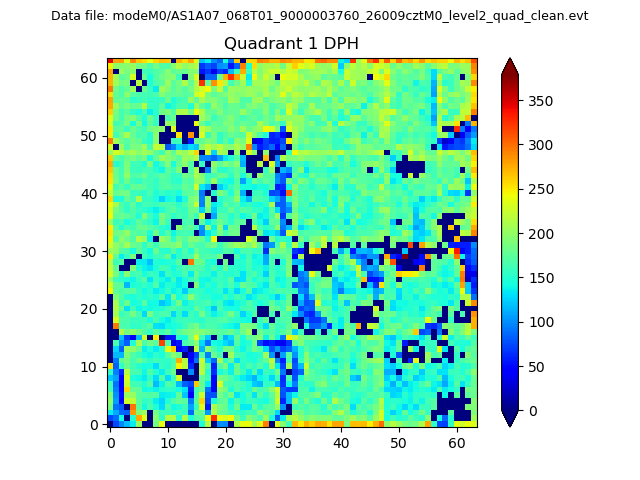 |
Quadrant B |
|---|---|---|---|
| Quadrant D |  |
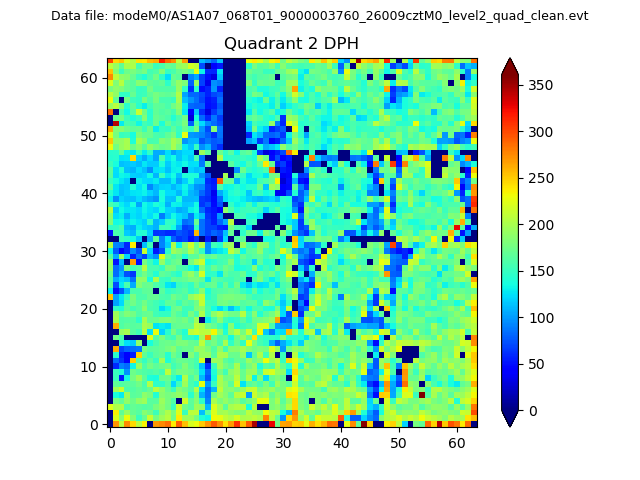 |
Quadrant C |
| Plot type | Count rate plots | Images |
|---|---|---|
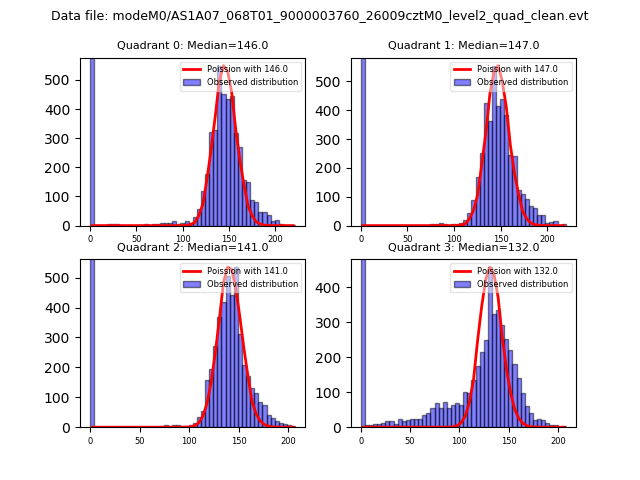
| Comparison with Poisson distribution Blue bars denote a histogram of data divided into 1 sec bins. Red curve is a Poisson curve with rate = median count rate of data. |
 |
 |
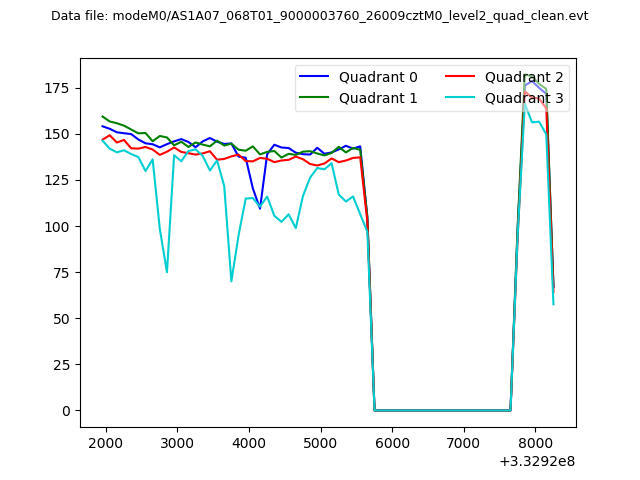
| Quadrant-wise count rates Data is divided into 100 sec bins |
 |
|
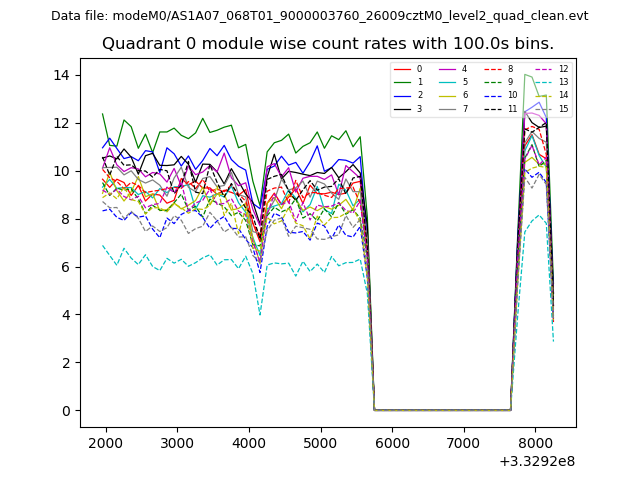
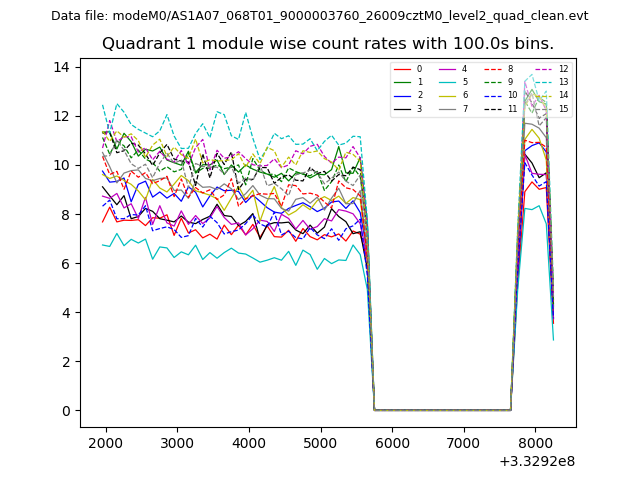
| Module-wise count rates for Quadrant A Data is divided into 100 sec bins |
 |
 |
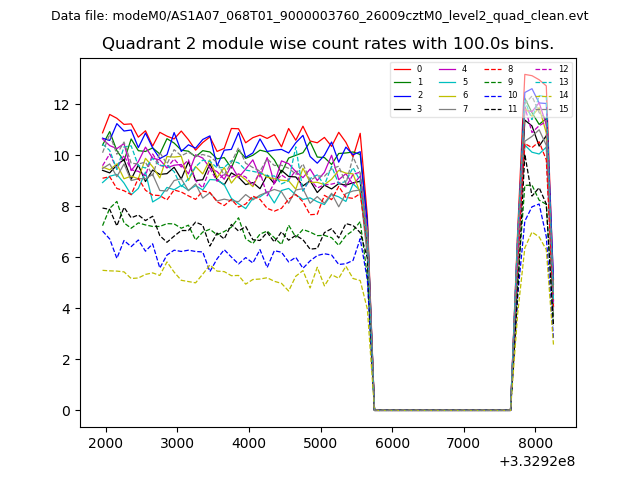
| Module-wise count rates for Quadrant B Data is divided into 100 sec bins |
 |
 |
| Module-wise count rates for Quadrant C Data is divided into 100 sec bins |
 |
 |
| Module-wise count rates for Quadrant D Data is divided into 100 sec bins |
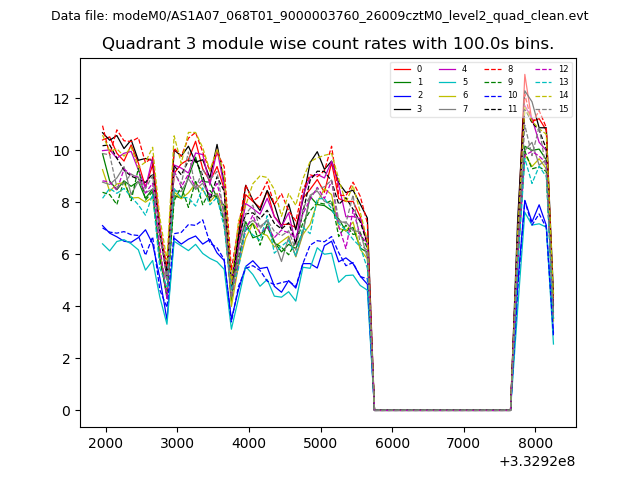 |
 |
| Parameter | Plot |
|---|---|
| CZT HV Monitor | 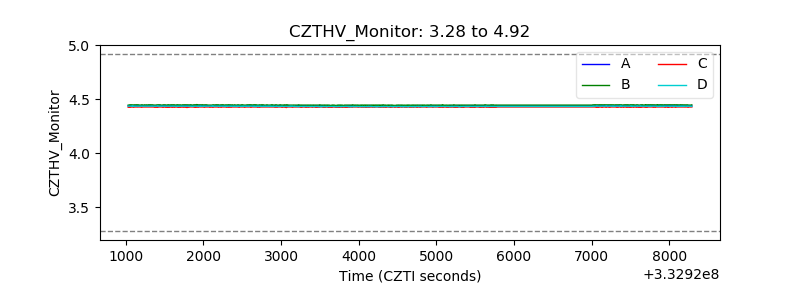 |
| D_VDD | 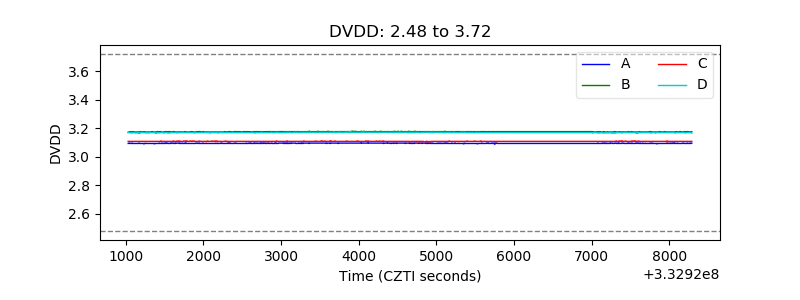 |
| Temperature 1 | 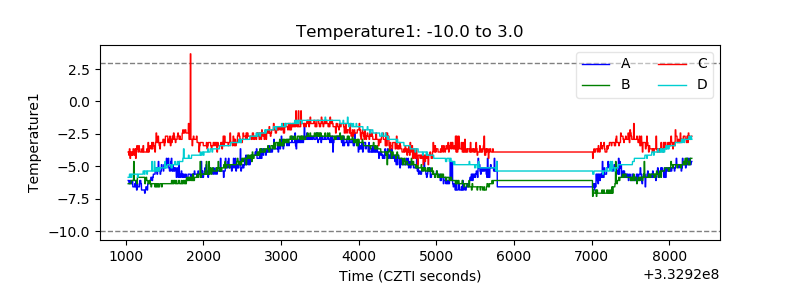 |
| Veto HV Monitor | 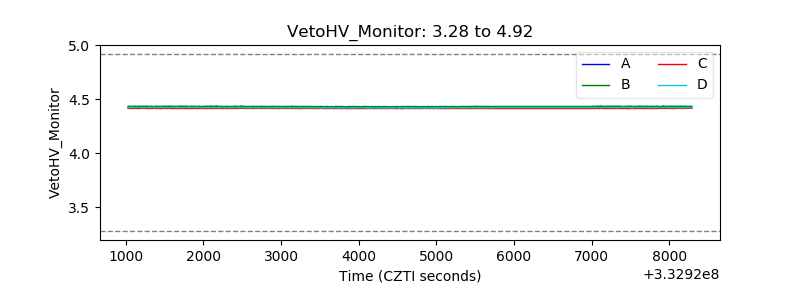 |
| Veto LLD |  |
| Alpha Counter | 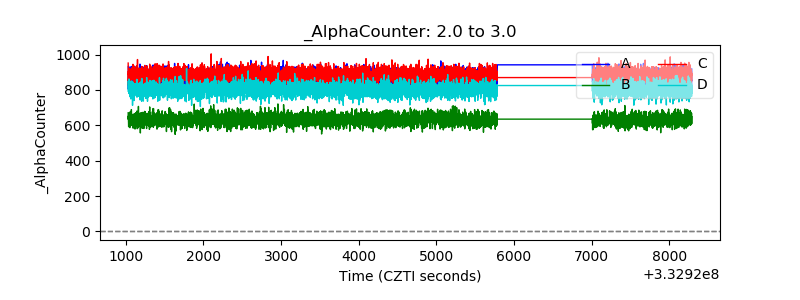 |
| _CPM_Rate | 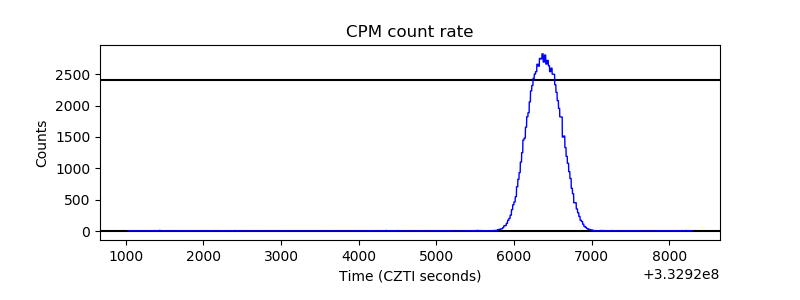 |
| CZT Counter | 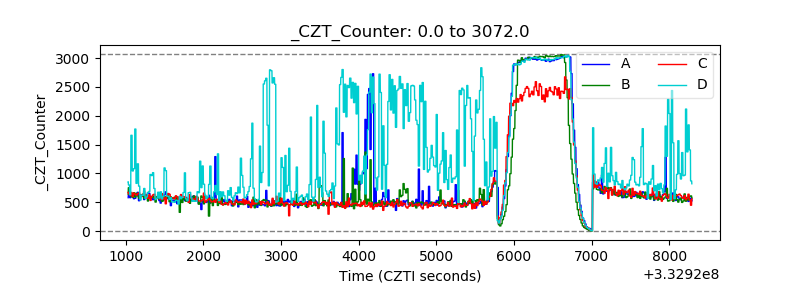 |
| +2.5 Volts monitor |  |
| +5 Volts monitor |  |
| _ROLL_ROT | 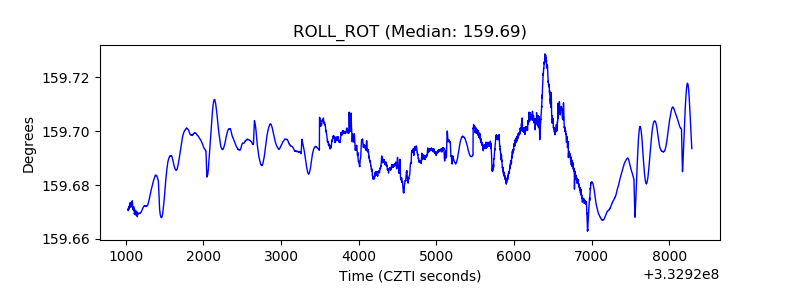 |
| _Roll_DEC | 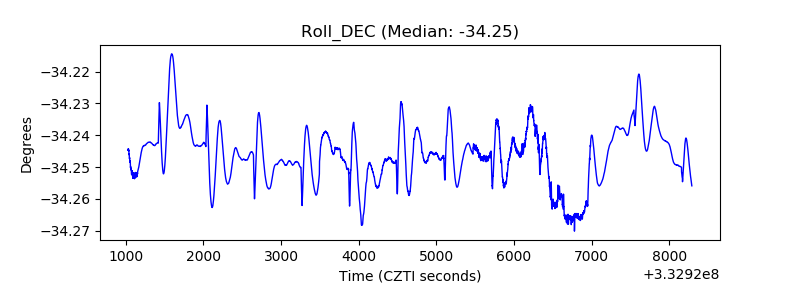 |
| _Roll_RA | 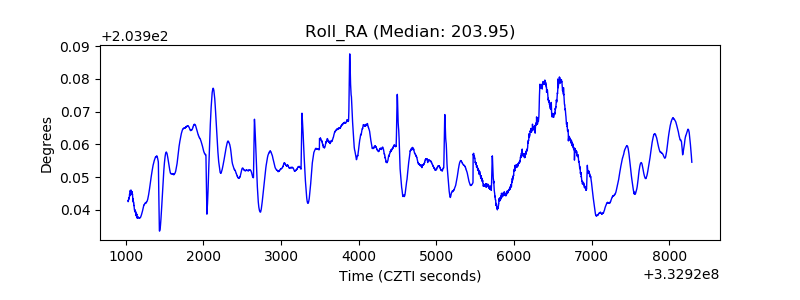 |
| Veto Counter | 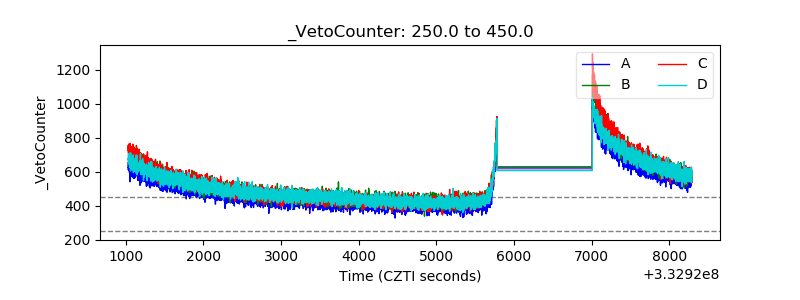 |