| Param | Original file | Final file |
|---|---|---|
| Filename | modeM0/AS1A07_068T01_9000003760_26010cztM0_level2.evt | modeM0/AS1A07_068T01_9000003760_26010cztM0_level2_quad_clean.evt |
| Size (bytes) | 682,692,480 | 108,509,760 |
| Size | 651.1 MB | 103.5 MB |
| Events in quadrant A | 3,866,482 | 752,984 |
| Events in quadrant B | 3,587,252 | 756,816 |
| Events in quadrant C | 3,551,144 | 720,048 |
| Events in quadrant D | 9,248,122 | 619,502 |
| Mode M0 | |||
|---|---|---|---|
| Quadrant | BADHDUFLAG | Total packets | Discarded packets |
| A | 0 | 15674 | 0 |
| B | 0 | 14725 | 0 |
| C | 0 | 14778 | 0 |
| D | 0 | 31888 | 0 |
| Mode M9 | |||
|---|---|---|---|
| Quadrant | BADHDUFLAG | Total packets | Discarded packets |
| A | 0 | 15 | 0 |
| B | 0 | 16 | 0 |
| C | 0 | 16 | 0 |
| D | 0 | 16 | 0 |
| Quadrant | Total seconds | Saturated seconds | Saturation percentage |
|---|---|---|---|
| A | 6257 | 175 | 2.796868% |
| B | 6257 | 114 | 1.821959% |
| C | 6257 | 188 | 3.004635% |
| D | 6257 | 1699 | 27.153588% |
Noise dominated data is calculated using 1-second bins in cleaned event files. If a bin has >2000 counts, and if more than 50% of those come from <1% of pixels, then it is considered to be noise-dominated and hence unusable.
| Quadrant | # 1 sec bins | Bins with >0 counts | Bins with >2000 counts | High rate bins dominated by noise | Noise dominated (total time) | Noise dominated (detector-on time) | Marked lightcurve |
|---|---|---|---|---|---|---|---|
| A | 7532 | 6257 | 61 | 61 | 0.81% | 0.97% | 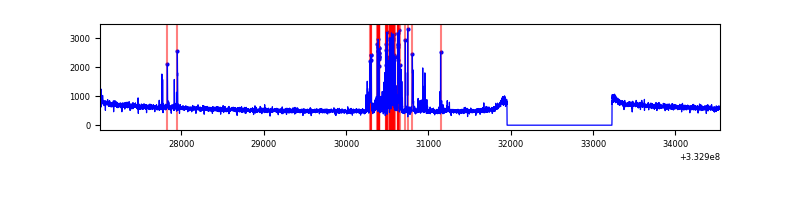 |
| B | 7532 | 6257 | 1 | 1 | 0.01% | 0.02% | 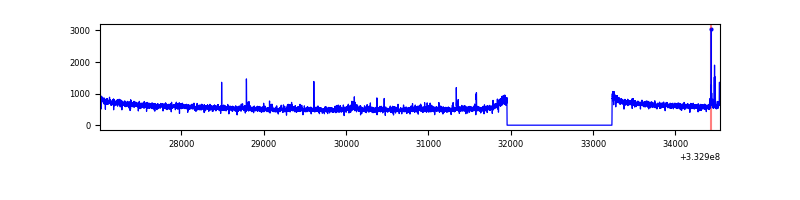 |
| C | 7532 | 6257 | 0 | 0 | 0.00% | 0.00% | 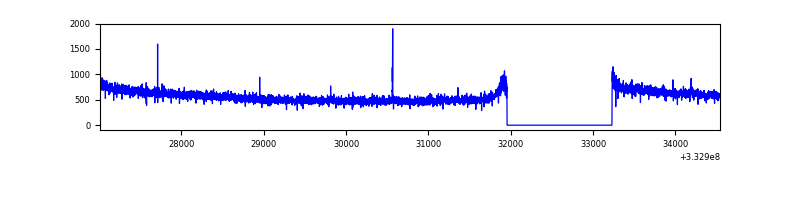 |
| D | 7532 | 6257 | 1492 | 1492 | 19.81% | 23.85% | 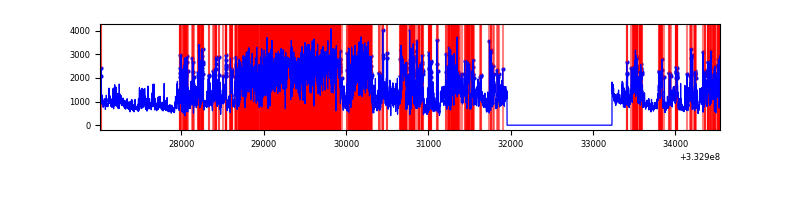 |
Top three noisy pixels from each quadrant. If the there are fewer than three noisy pixels in the level2.evt file, extra rows are filled as -1
| Pixel properties | Quadrant properties | ||||||
|---|---|---|---|---|---|---|---|
| Quadrant | DetID | PixID | Counts | Sigma | Mean | Median | Sigma |
| A | 0 | 13 | 339338 | 1884.13 | 916 | 901 | 179.6 |
| A | 13 | 254 | 8978 | 44.97 | 916 | 901 | 179.6 |
| A | 0 | 226 | 7978 | 39.4 | 916 | 901 | 179.6 |
| B | 10 | 245 | 64373 | 384.76 | 894 | 875 | 165.0 |
| B | 12 | 111 | 19664 | 113.85 | 894 | 875 | 165.0 |
| B | 11 | 111 | 17521 | 100.87 | 894 | 875 | 165.0 |
| C | 14 | 238 | 142757 | 711.17 | 871 | 879 | 199.5 |
| C | 3 | 233 | 10216 | 46.8 | 871 | 879 | 199.5 |
| C | 2 | 16 | 6799 | 29.67 | 871 | 879 | 199.5 |
| D | 1 | 52 | 5974973 | 29997.5 | 823 | 803 | 199.2 |
| D | 12 | 233 | 91812 | 456.97 | 823 | 803 | 199.2 |
| D | 8 | 195 | 28473 | 138.94 | 823 | 803 | 199.2 |
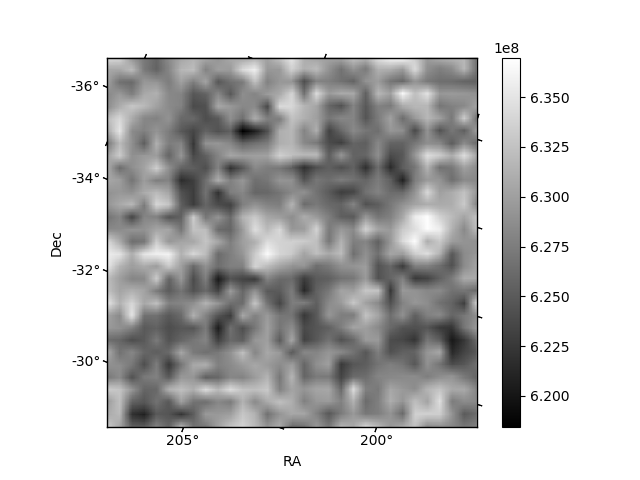
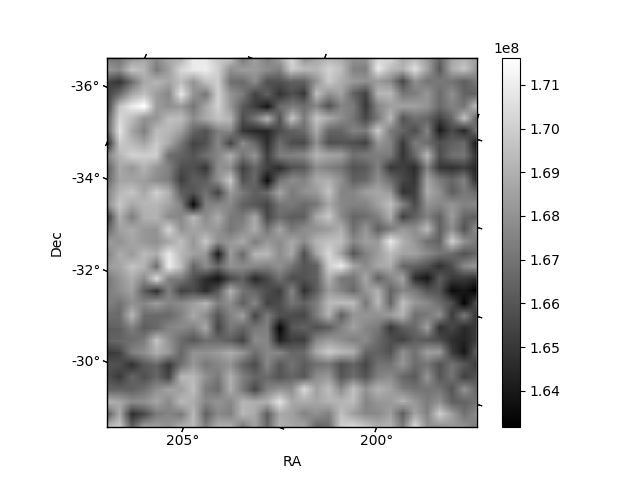
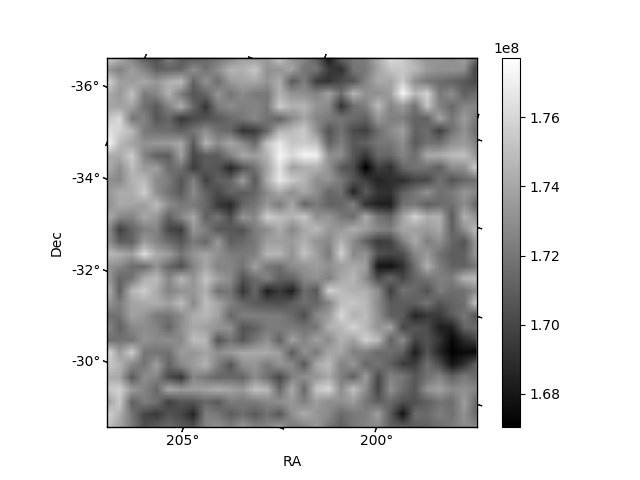
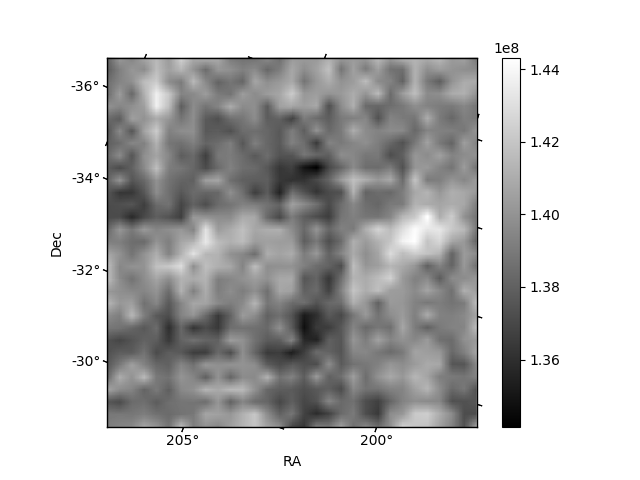
Histogram calculated using DETX and DETY for each event in the final _common_clean file
| Quadrant A | 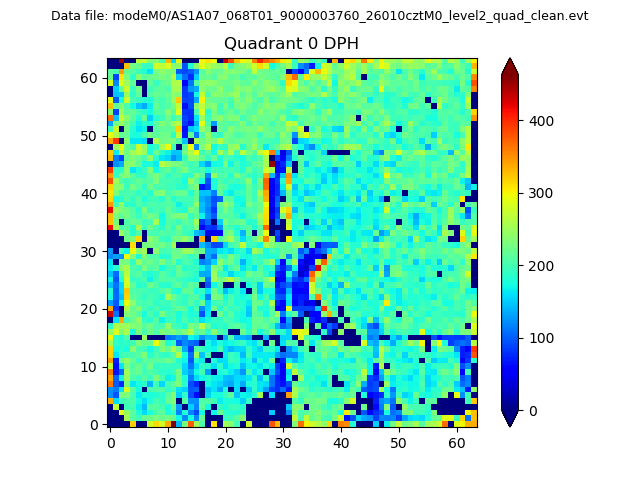 |
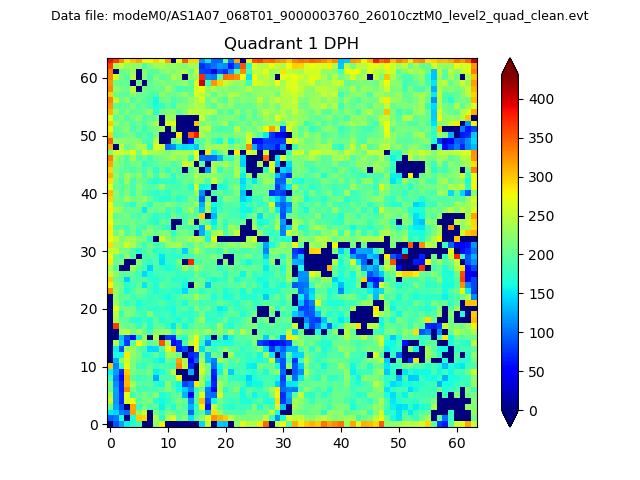 |
Quadrant B |
|---|---|---|---|
| Quadrant D |  |
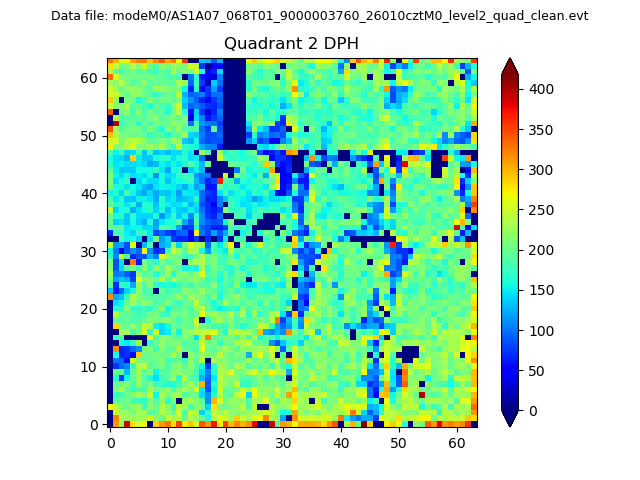 |
Quadrant C |
| Plot type | Count rate plots | Images |
|---|---|---|
| Comparison with Poisson distribution Blue bars denote a histogram of data divided into 1 sec bins. Red curve is a Poisson curve with rate = median count rate of data. |
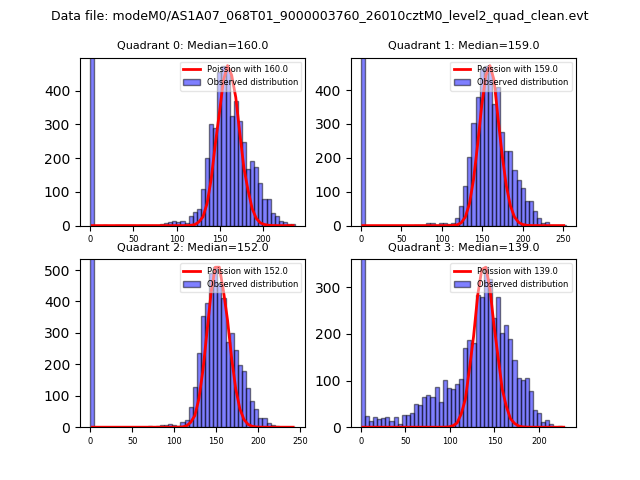 |
 |
| Quadrant-wise count rates Data is divided into 100 sec bins |
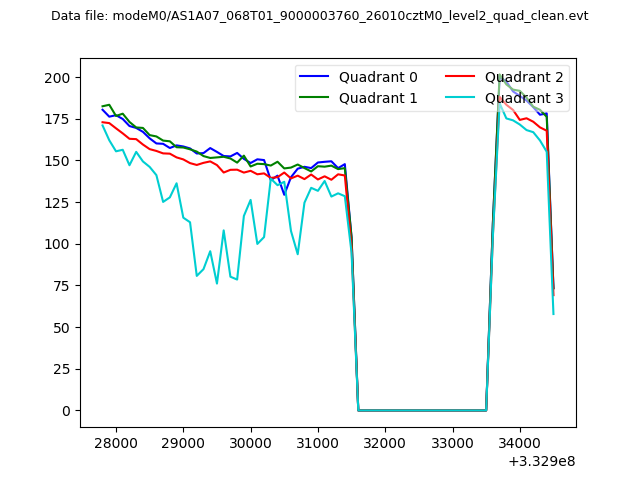 |
|
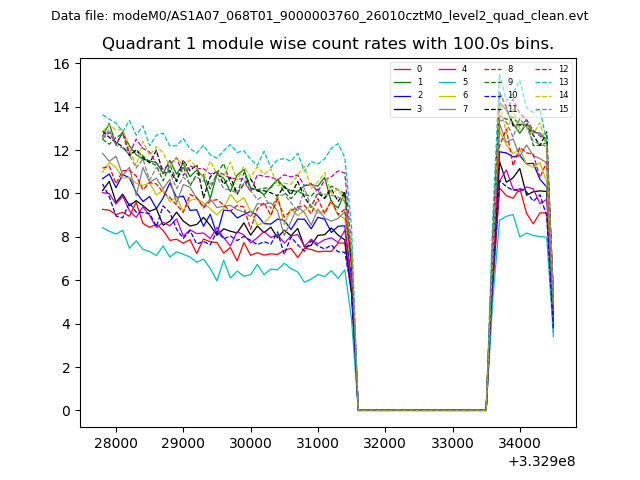
| Module-wise count rates for Quadrant A Data is divided into 100 sec bins |
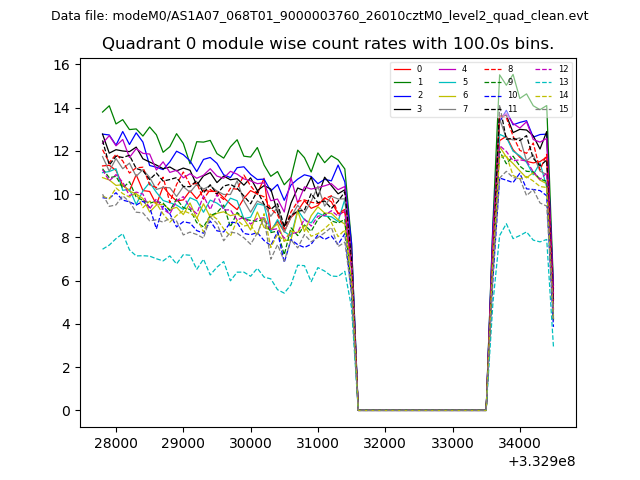 |
 |
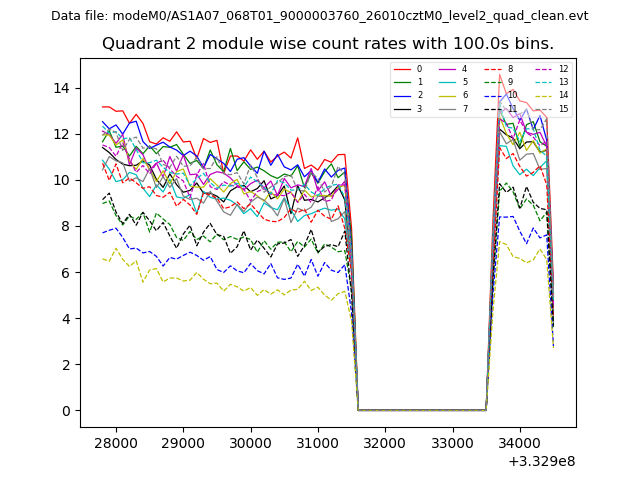
| Module-wise count rates for Quadrant B Data is divided into 100 sec bins |
 |
 |
| Module-wise count rates for Quadrant C Data is divided into 100 sec bins |
 |
 |
| Module-wise count rates for Quadrant D Data is divided into 100 sec bins |
 |
 |
| Parameter | Plot |
|---|---|
| CZT HV Monitor | 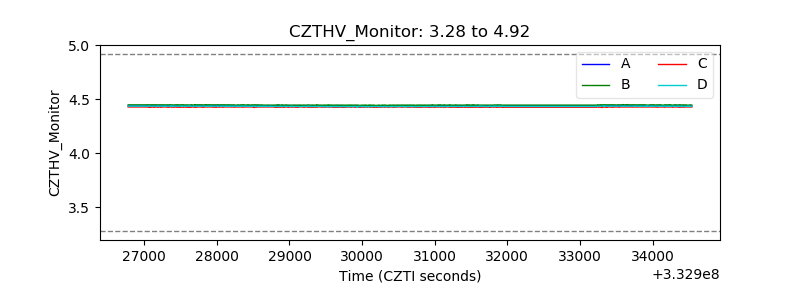 |
| D_VDD | 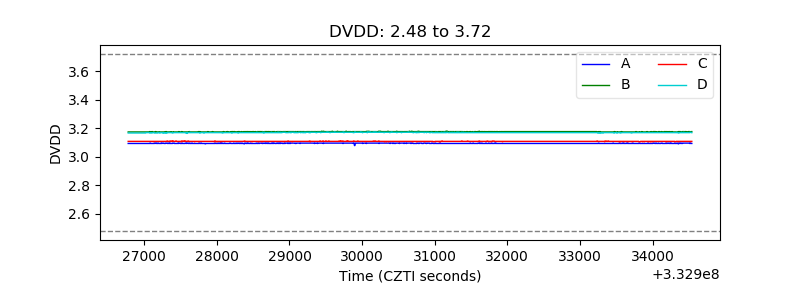 |
| Temperature 1 | 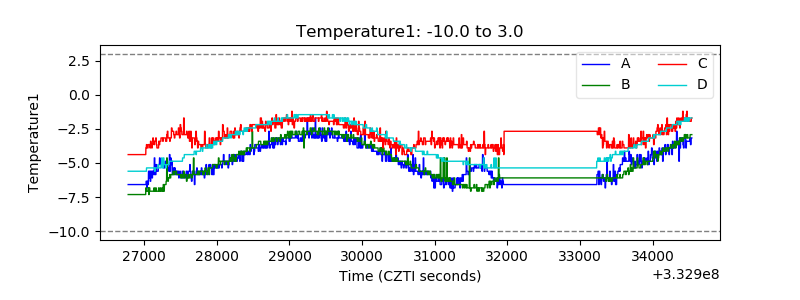 |
| Veto HV Monitor | 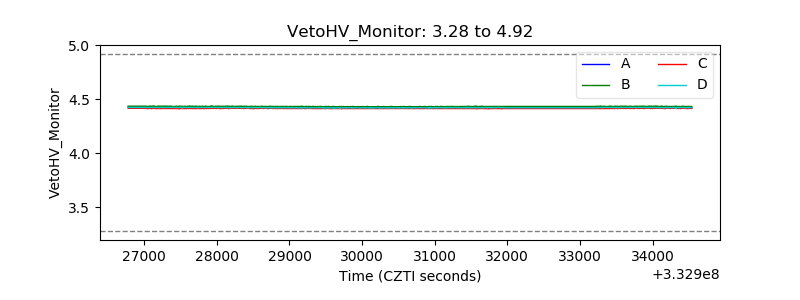 |
| Veto LLD | 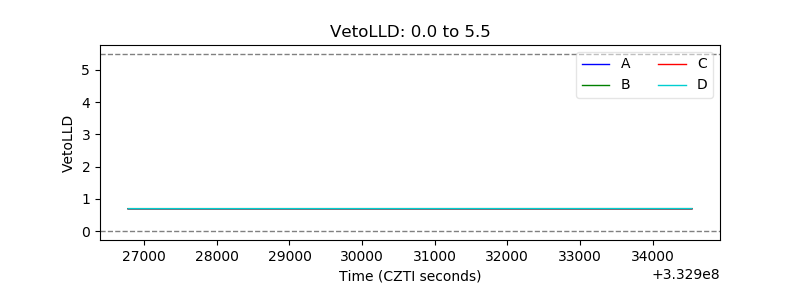 |
| Alpha Counter | 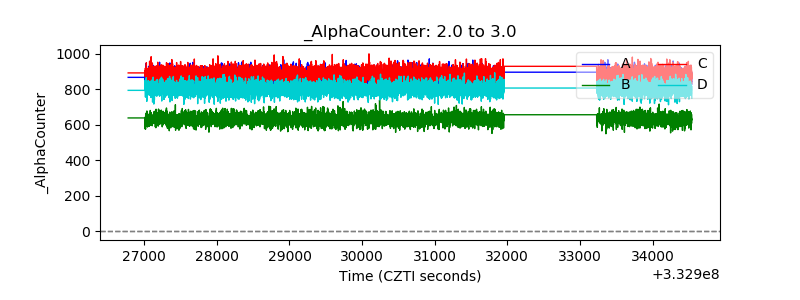 |
| _CPM_Rate | 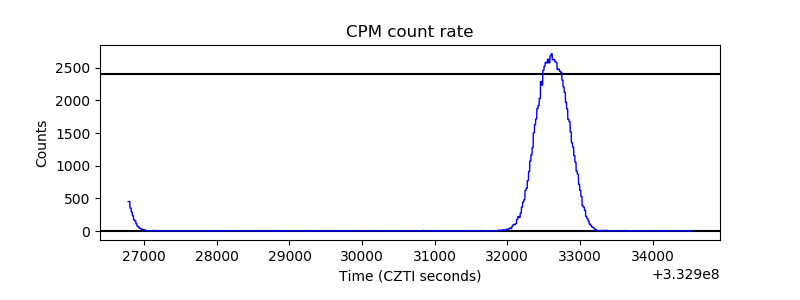 |
| CZT Counter | 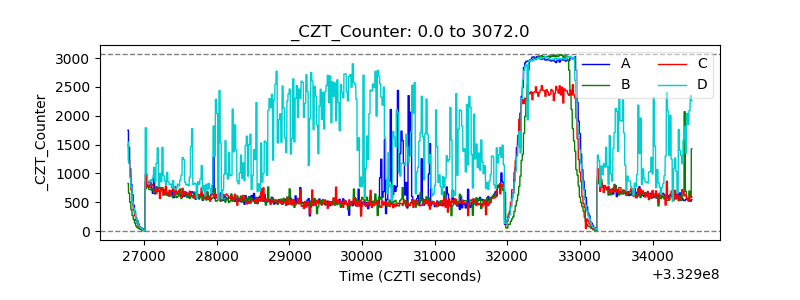 |
| +2.5 Volts monitor | 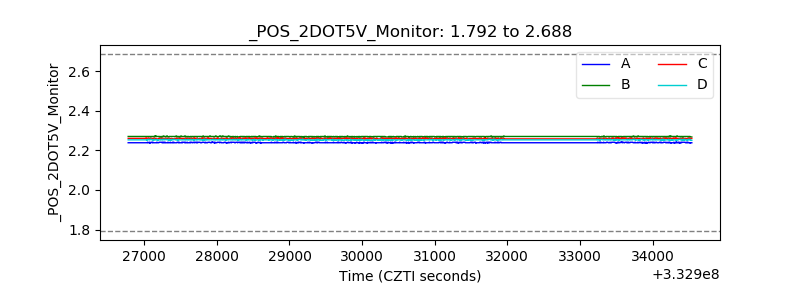 |
| +5 Volts monitor | 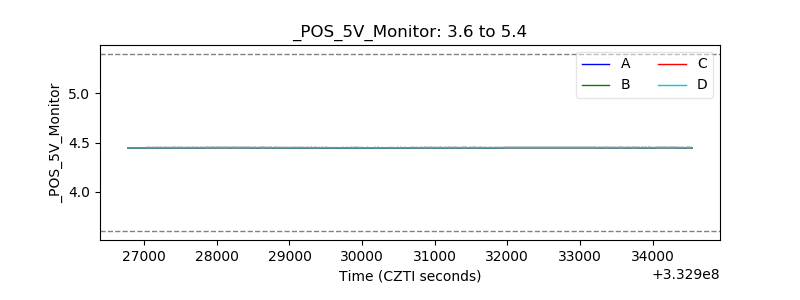 |
| _ROLL_ROT | 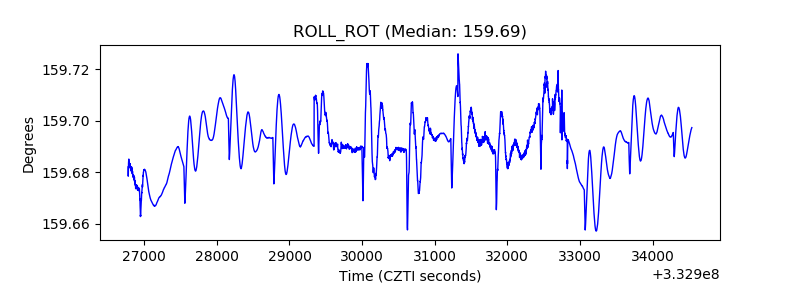 |
| _Roll_DEC | 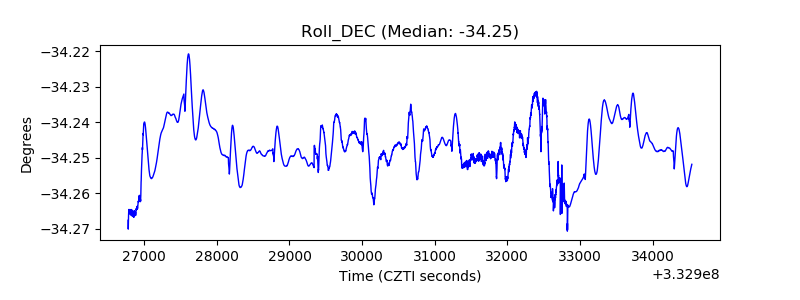 |
| _Roll_RA | 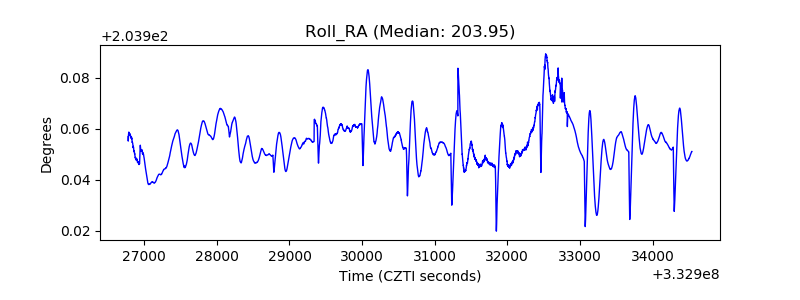 |
| Veto Counter | 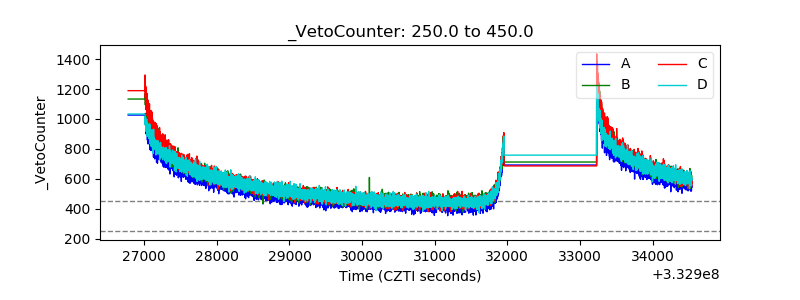 |