| Param | Original file | Final file |
|---|---|---|
| Filename | modeM0/AS1A07_068T01_9000003760_26011cztM0_level2.evt | modeM0/AS1A07_068T01_9000003760_26011cztM0_level2_quad_clean.evt |
| Size (bytes) | 580,573,440 | 118,189,440 |
| Size | 553.7 MB | 112.7 MB |
| Events in quadrant A | 3,190,495 | 843,723 |
| Events in quadrant B | 3,220,656 | 838,444 |
| Events in quadrant C | 3,165,982 | 791,135 |
| Events in quadrant D | 7,616,566 | 704,251 |
| Mode M0 | |||
|---|---|---|---|
| Quadrant | BADHDUFLAG | Total packets | Discarded packets |
| A | 0 | 13231 | 0 |
| B | 0 | 13293 | 0 |
| C | 0 | 13190 | 0 |
| D | 0 | 26679 | 0 |
| Mode M9 | |||
|---|---|---|---|
| Quadrant | BADHDUFLAG | Total packets | Discarded packets |
| A | 0 | 13 | 0 |
| B | 0 | 13 | 0 |
| C | 0 | 13 | 0 |
| D | 0 | 13 | 0 |
| Quadrant | Total seconds | Saturated seconds | Saturation percentage |
|---|---|---|---|
| A | 5746 | 131 | 2.279847% |
| B | 5747 | 137 | 2.383852% |
| C | 5747 | 187 | 3.253872% |
| D | 5747 | 1384 | 24.082130% |
Noise dominated data is calculated using 1-second bins in cleaned event files. If a bin has >2000 counts, and if more than 50% of those come from <1% of pixels, then it is considered to be noise-dominated and hence unusable.
| Quadrant | # 1 sec bins | Bins with >0 counts | Bins with >2000 counts | High rate bins dominated by noise | Noise dominated (total time) | Noise dominated (detector-on time) | Marked lightcurve |
|---|---|---|---|---|---|---|---|
| A | 7036 | 5746 | 0 | 0 | 0.00% | 0.00% | 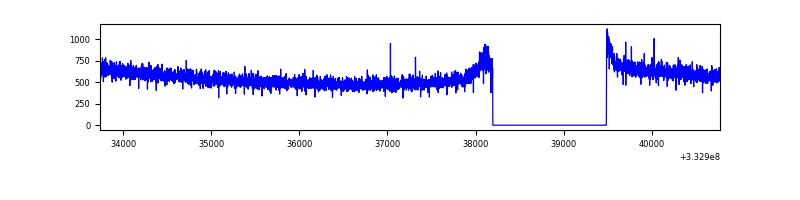 |
| B | 7037 | 5747 | 5 | 5 | 0.07% | 0.09% | 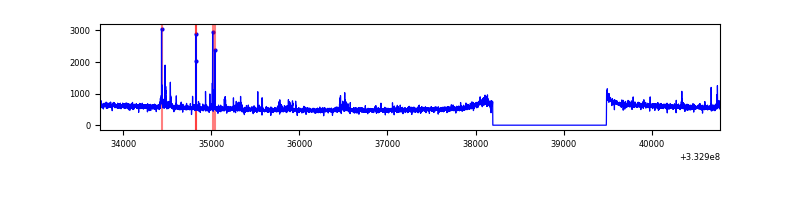 |
| C | 7037 | 5747 | 0 | 0 | 0.00% | 0.00% | 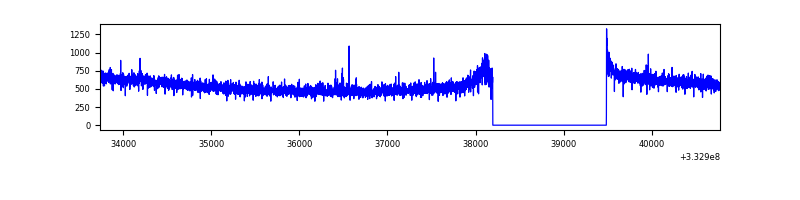 |
| D | 7036 | 5746 | 1249 | 1249 | 17.75% | 21.74% |  |
Top three noisy pixels from each quadrant. If the there are fewer than three noisy pixels in the level2.evt file, extra rows are filled as -1
| Pixel properties | Quadrant properties | ||||||
|---|---|---|---|---|---|---|---|
| Quadrant | DetID | PixID | Counts | Sigma | Mean | Median | Sigma |
| A | 13 | 254 | 8981 | 50.25 | 828 | 815 | 162.5 |
| A | 0 | 226 | 7170 | 39.1 | 828 | 815 | 162.5 |
| A | 3 | 137 | 6911 | 37.51 | 828 | 815 | 162.5 |
| B | 10 | 245 | 53294 | 354.08 | 800 | 782 | 148.3 |
| B | 0 | 190 | 23934 | 156.11 | 800 | 782 | 148.3 |
| B | 15 | 222 | 17724 | 114.24 | 800 | 782 | 148.3 |
| C | 14 | 238 | 126470 | 710.97 | 772 | 779 | 176.8 |
| C | 3 | 233 | 20742 | 112.92 | 772 | 779 | 176.8 |
| C | 2 | 16 | 6749 | 33.77 | 772 | 779 | 176.8 |
| D | 1 | 52 | 4563895 | 24584.15 | 744 | 726 | 185.6 |
| D | 12 | 1 | 102007 | 545.65 | 744 | 726 | 185.6 |
| D | 12 | 233 | 89214 | 476.73 | 744 | 726 | 185.6 |
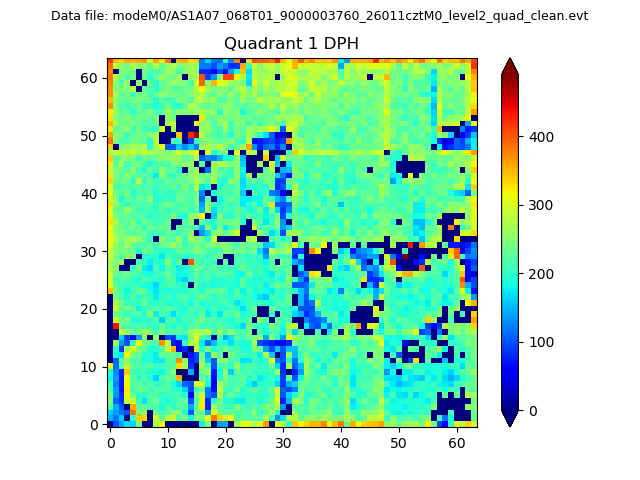
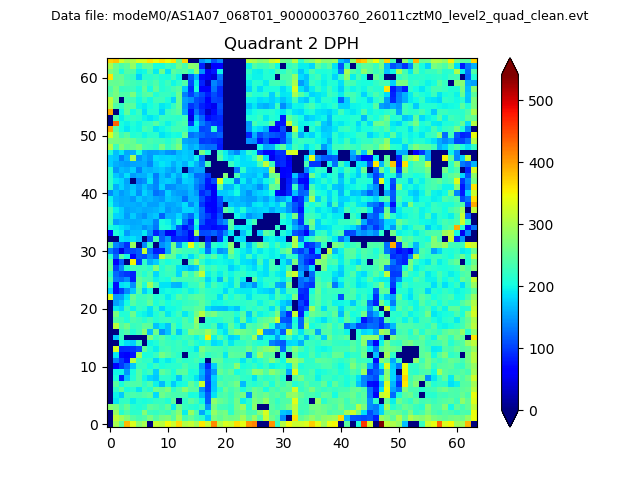
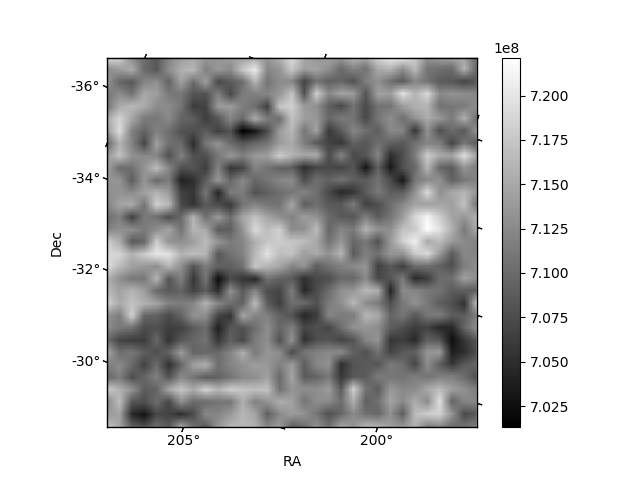
Histogram calculated using DETX and DETY for each event in the final _common_clean file
| Quadrant A | 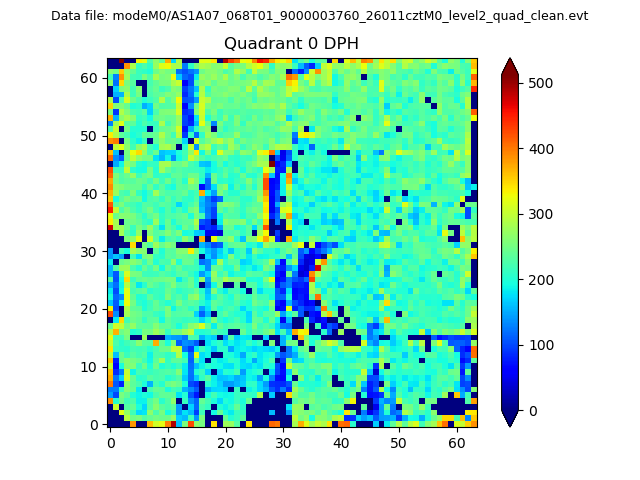 |
 |
Quadrant B |
|---|---|---|---|
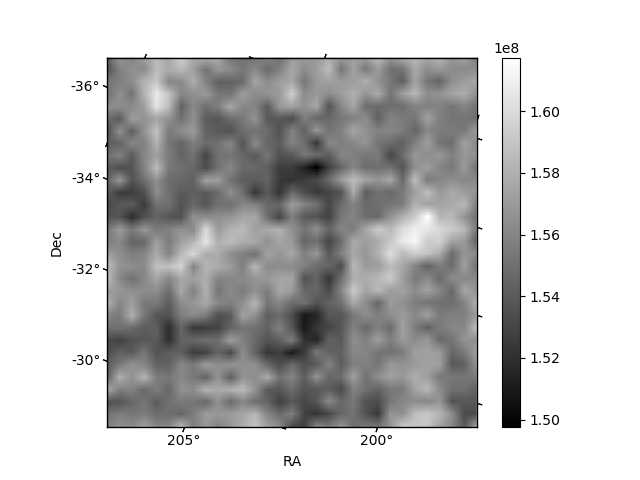
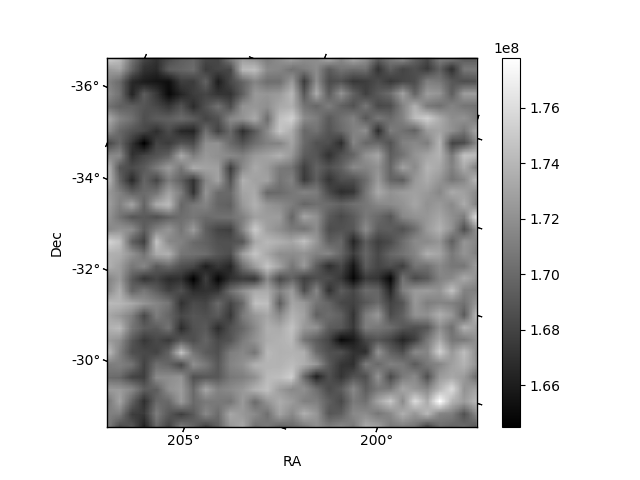
| Quadrant D | 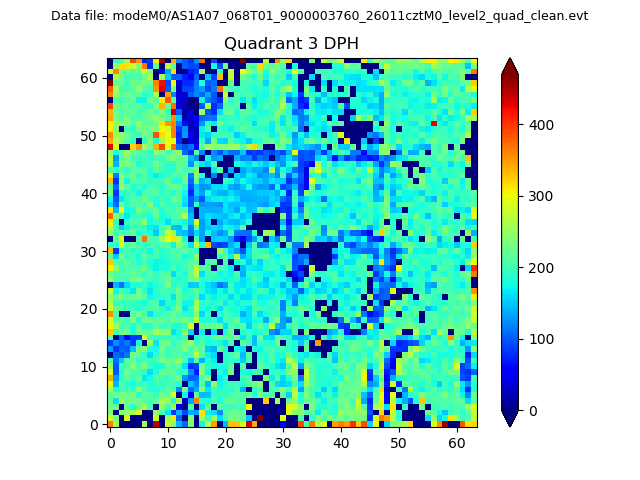 |
 |
Quadrant C |
| Plot type | Count rate plots | Images |
|---|---|---|
| Comparison with Poisson distribution Blue bars denote a histogram of data divided into 1 sec bins. Red curve is a Poisson curve with rate = median count rate of data. |
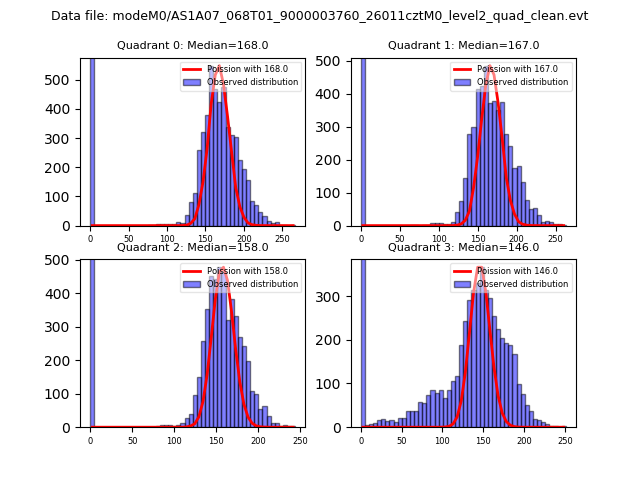 |
 |
| Quadrant-wise count rates Data is divided into 100 sec bins |
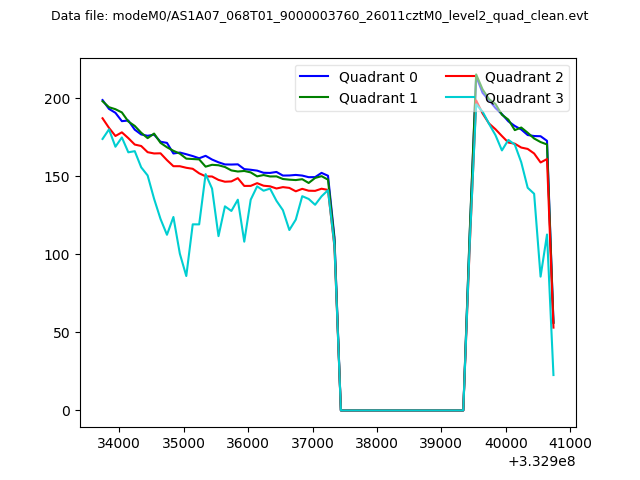 |
|
| Module-wise count rates for Quadrant A Data is divided into 100 sec bins |
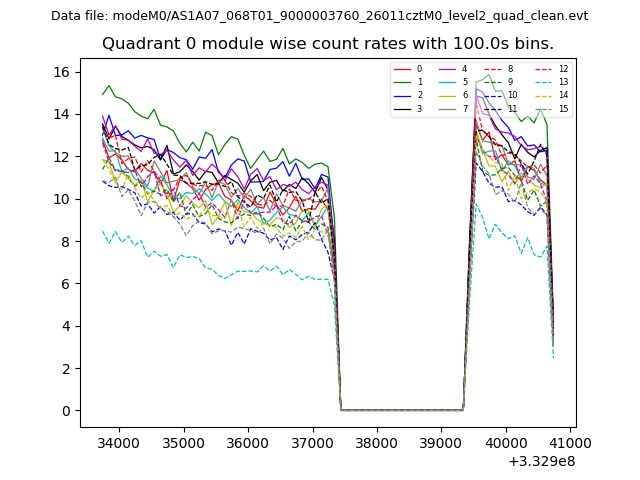 |
 |
| Module-wise count rates for Quadrant B Data is divided into 100 sec bins |
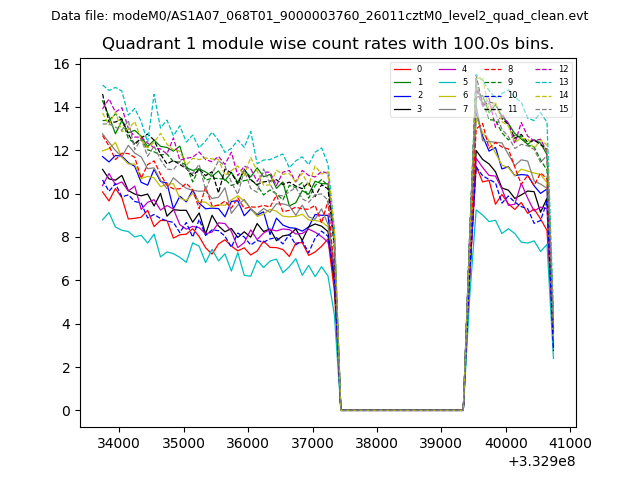 |
 |
| Module-wise count rates for Quadrant C Data is divided into 100 sec bins |
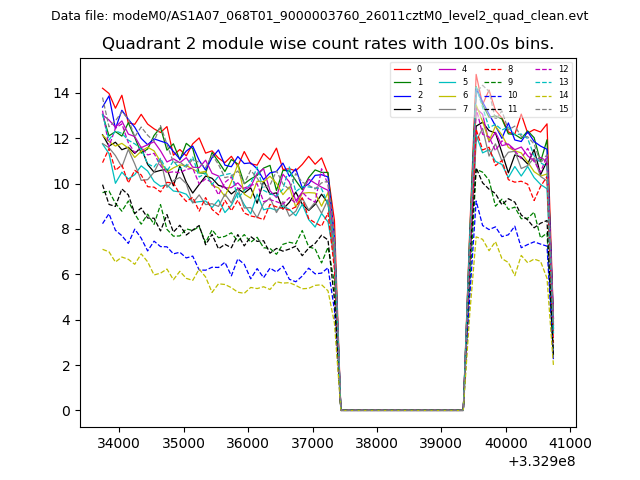 |
 |
| Module-wise count rates for Quadrant D Data is divided into 100 sec bins |
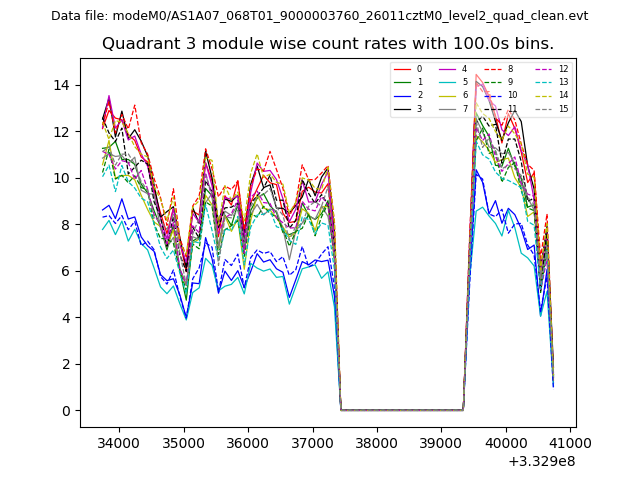 |
 |
| Parameter | Plot |
|---|---|
| CZT HV Monitor | 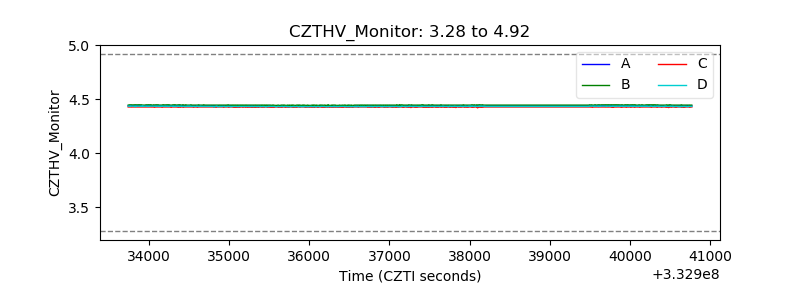 |
| D_VDD |  |
| Temperature 1 | 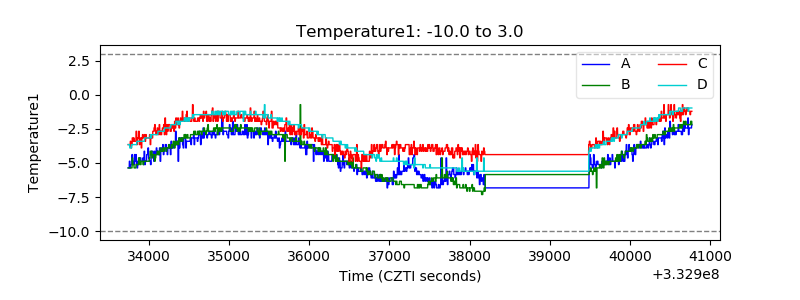 |
| Veto HV Monitor | 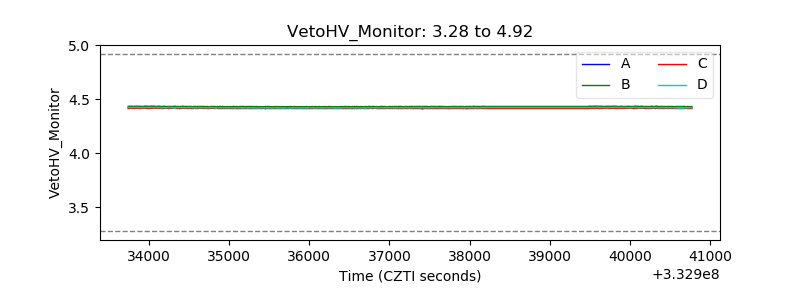 |
| Veto LLD | 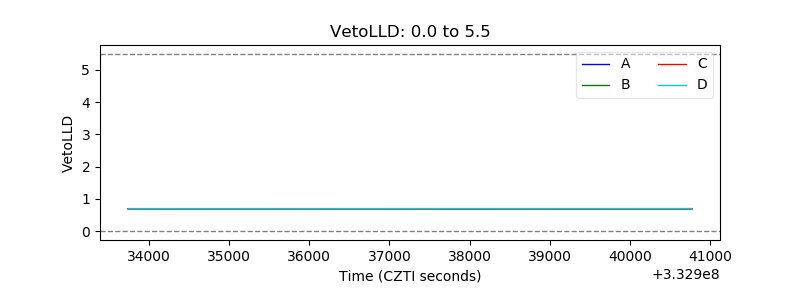 |
| Alpha Counter | 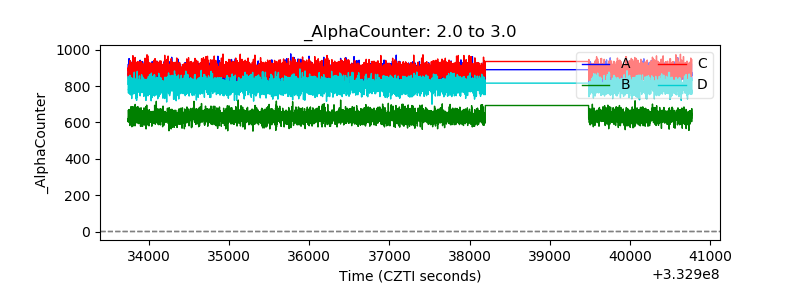 |
| _CPM_Rate | 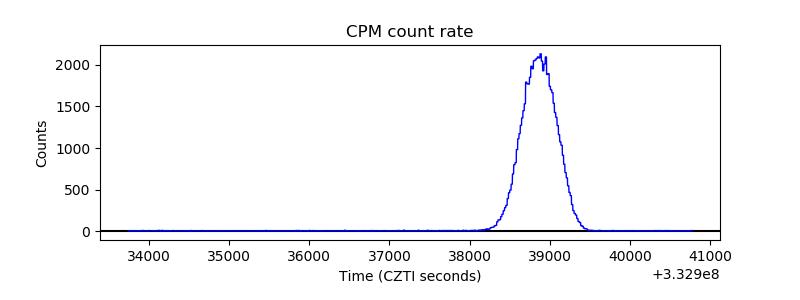 |
| CZT Counter | 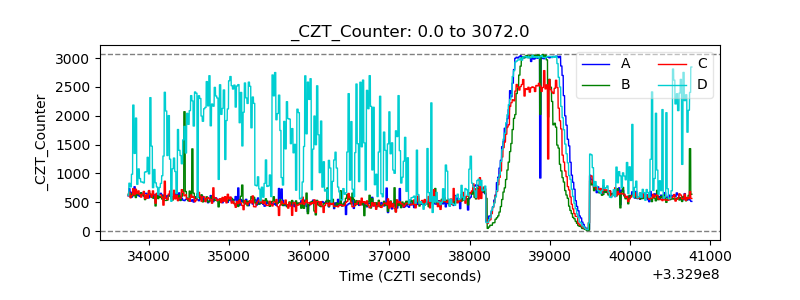 |
| +2.5 Volts monitor |  |
| +5 Volts monitor |  |
| _ROLL_ROT | 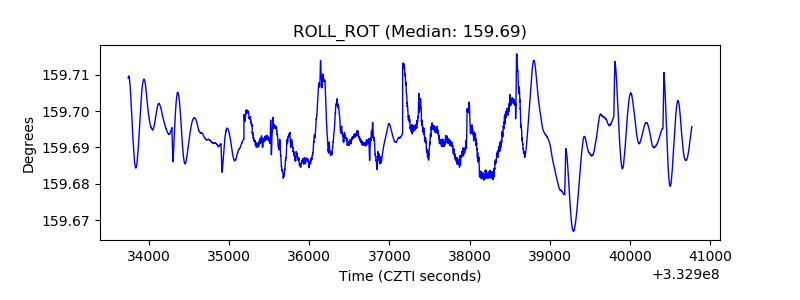 |
| _Roll_DEC | 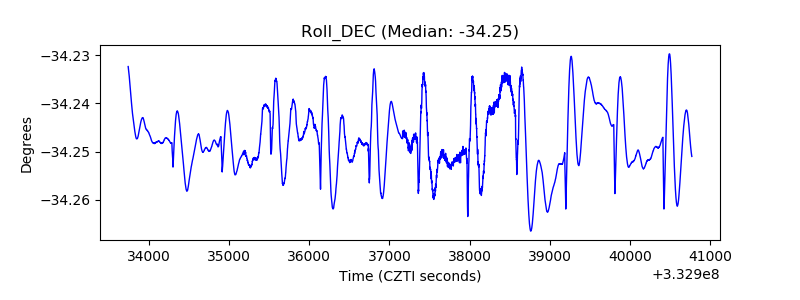 |
| _Roll_RA | 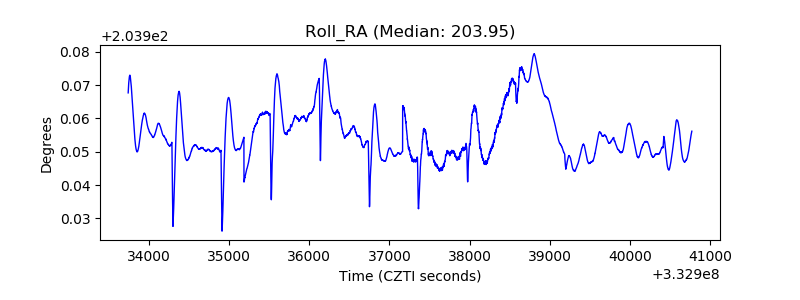 |
| Veto Counter | 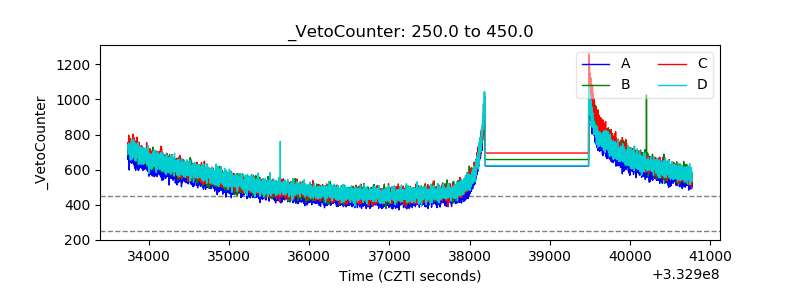 |