| Param | Original file | Final file |
|---|---|---|
| Filename | modeM0/AS1A07_068T01_9000003760_26013cztM0_level2.evt | modeM0/AS1A07_068T01_9000003760_26013cztM0_level2_quad_clean.evt |
| Size (bytes) | 504,734,400 | 97,050,240 |
| Size | 481.4 MB | 92.6 MB |
| Events in quadrant A | 3,256,483 | 657,389 |
| Events in quadrant B | 3,196,029 | 649,871 |
| Events in quadrant C | 3,119,222 | 615,142 |
| Events in quadrant D | 5,292,367 | 582,714 |
| Mode M0 | |||
|---|---|---|---|
| Quadrant | BADHDUFLAG | Total packets | Discarded packets |
| A | 0 | 13454 | 0 |
| B | 0 | 13260 | 0 |
| C | 0 | 13129 | 0 |
| D | 0 | 19908 | 0 |
| Mode M9 | |||
|---|---|---|---|
| Quadrant | BADHDUFLAG | Total packets | Discarded packets |
| A | 0 | 11 | 0 |
| B | 0 | 11 | 0 |
| C | 0 | 11 | 0 |
| D | 0 | 11 | 0 |
| Quadrant | Total seconds | Saturated seconds | Saturation percentage |
|---|---|---|---|
| A | 6217 | 109 | 1.753257% |
| B | 6217 | 93 | 1.495898% |
| C | 6217 | 121 | 1.946276% |
| D | 6217 | 623 | 10.020910% |
Noise dominated data is calculated using 1-second bins in cleaned event files. If a bin has >2000 counts, and if more than 50% of those come from <1% of pixels, then it is considered to be noise-dominated and hence unusable.
| Quadrant | # 1 sec bins | Bins with >0 counts | Bins with >2000 counts | High rate bins dominated by noise | Noise dominated (total time) | Noise dominated (detector-on time) | Marked lightcurve |
|---|---|---|---|---|---|---|---|
| A | 7297 | 6217 | 8 | 8 | 0.11% | 0.13% | 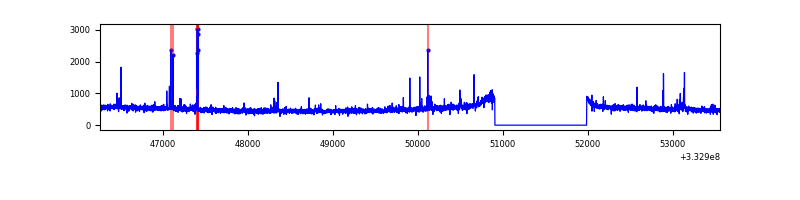 |
| B | 7297 | 6218 | 1 | 1 | 0.01% | 0.02% | 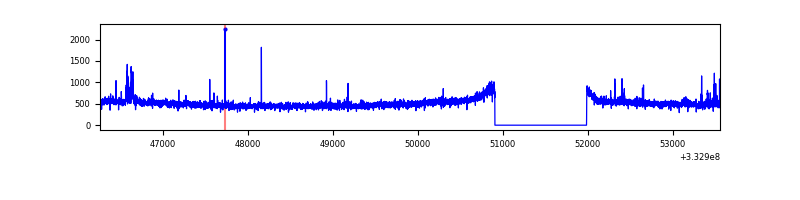 |
| C | 7297 | 6217 | 0 | 0 | 0.00% | 0.00% | 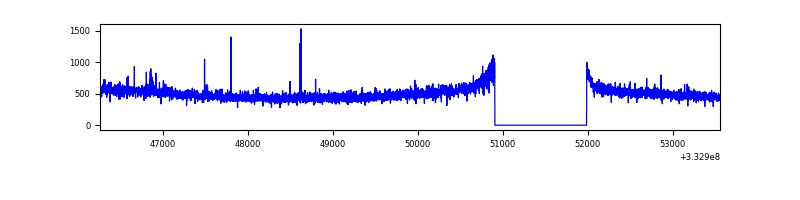 |
| D | 7297 | 6218 | 515 | 515 | 7.06% | 8.28% | 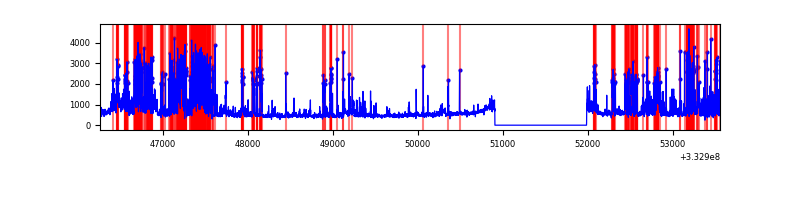 |
Top three noisy pixels from each quadrant. If the there are fewer than three noisy pixels in the level2.evt file, extra rows are filled as -1
| Pixel properties | Quadrant properties | ||||||
|---|---|---|---|---|---|---|---|
| Quadrant | DetID | PixID | Counts | Sigma | Mean | Median | Sigma |
| A | 0 | 13 | 108901 | 659.8 | 816 | 802 | 163.8 |
| A | 13 | 254 | 9865 | 55.32 | 816 | 802 | 163.8 |
| A | 3 | 137 | 7291 | 39.61 | 816 | 802 | 163.8 |
| B | 0 | 190 | 52288 | 343.09 | 792 | 774 | 150.1 |
| B | 0 | 229 | 33053 | 214.98 | 792 | 774 | 150.1 |
| B | 12 | 111 | 18062 | 115.14 | 792 | 774 | 150.1 |
| C | 14 | 238 | 123793 | 698.35 | 759 | 762 | 176.2 |
| C | 3 | 233 | 31307 | 173.38 | 759 | 762 | 176.2 |
| C | 13 | 61 | 5171 | 25.03 | 759 | 762 | 176.2 |
| D | 1 | 52 | 1430841 | 7246.23 | 758 | 741 | 197.4 |
| D | 12 | 233 | 915741 | 4636.25 | 758 | 741 | 197.4 |
| D | 8 | 195 | 36852 | 182.97 | 758 | 741 | 197.4 |
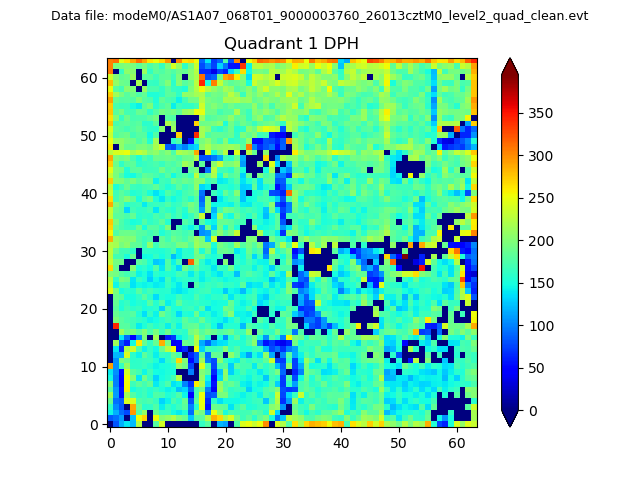
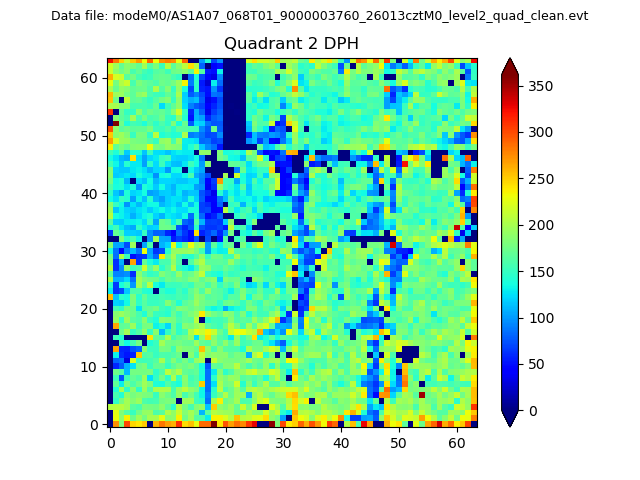
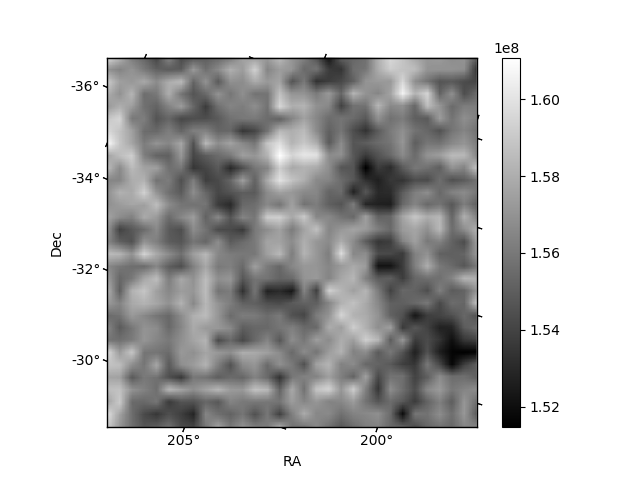
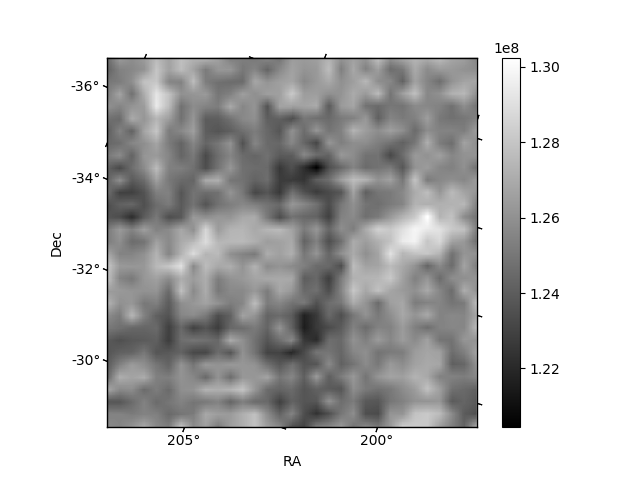
Histogram calculated using DETX and DETY for each event in the final _common_clean file
| Quadrant A |  |
 |
Quadrant B |
|---|---|---|---|
| Quadrant D |  |
 |
Quadrant C |
| Plot type | Count rate plots | Images |
|---|---|---|
| Comparison with Poisson distribution Blue bars denote a histogram of data divided into 1 sec bins. Red curve is a Poisson curve with rate = median count rate of data. |
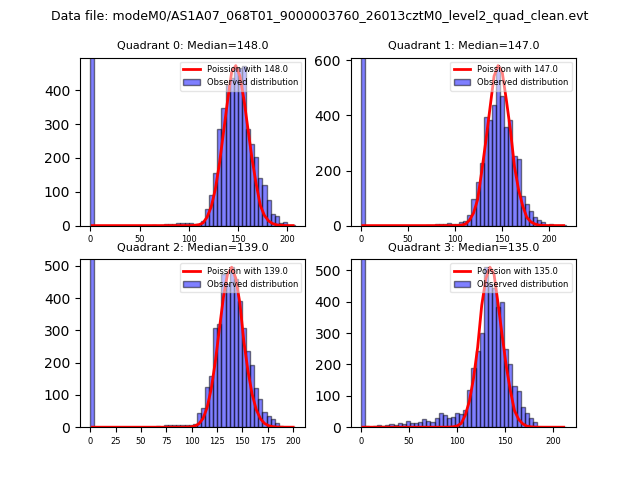 |
 |
| Quadrant-wise count rates Data is divided into 100 sec bins |
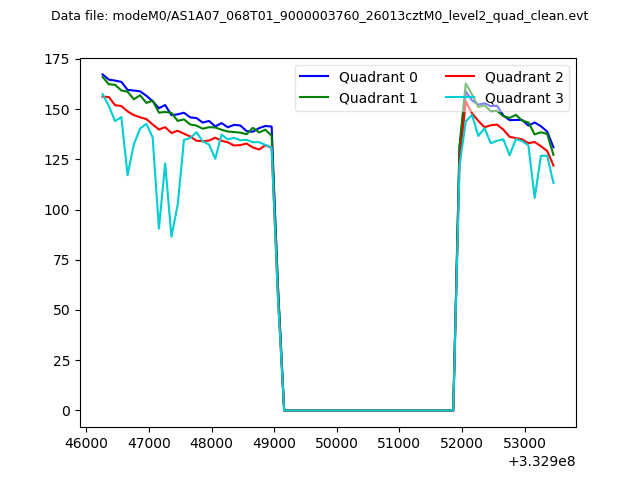 |
|
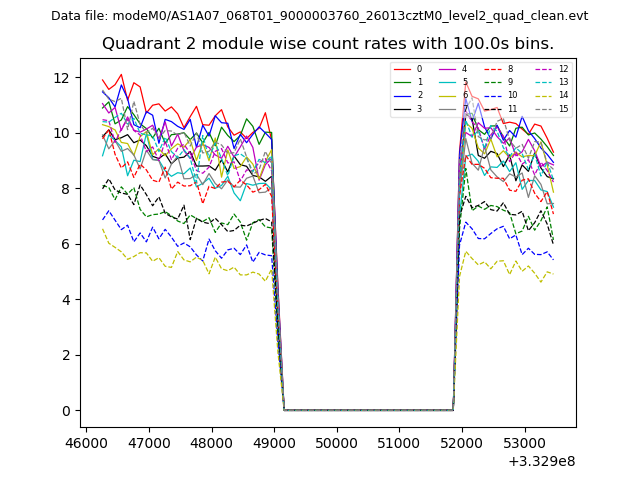
| Module-wise count rates for Quadrant A Data is divided into 100 sec bins |
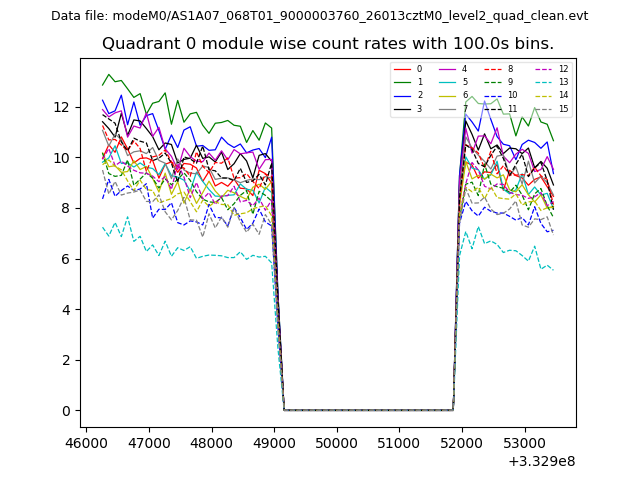 |
 |
| Module-wise count rates for Quadrant B Data is divided into 100 sec bins |
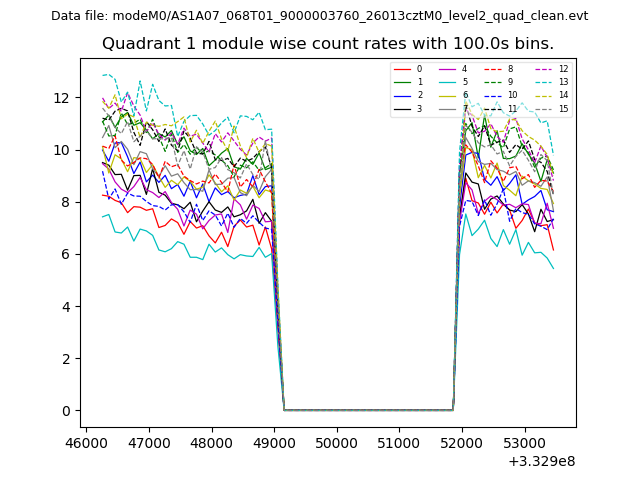 |
 |
| Module-wise count rates for Quadrant C Data is divided into 100 sec bins |
 |
 |
| Module-wise count rates for Quadrant D Data is divided into 100 sec bins |
 |
 |
| Parameter | Plot |
|---|---|
| CZT HV Monitor | 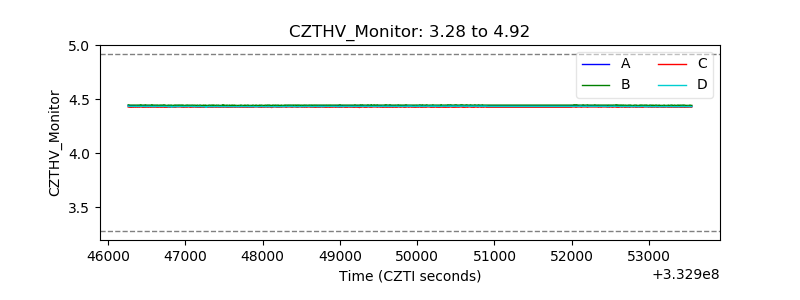 |
| D_VDD | 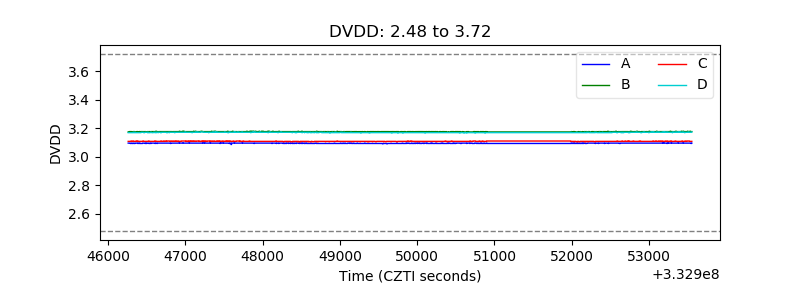 |
| Temperature 1 | 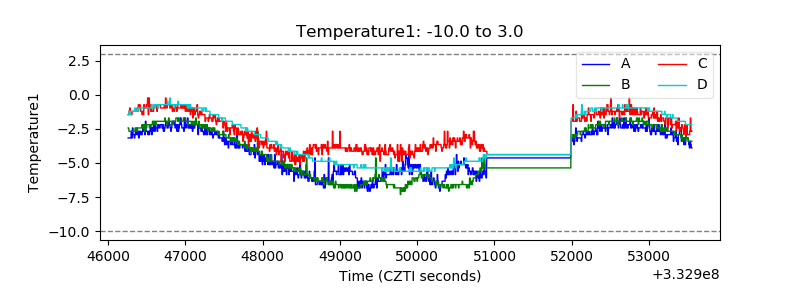 |
| Veto HV Monitor | 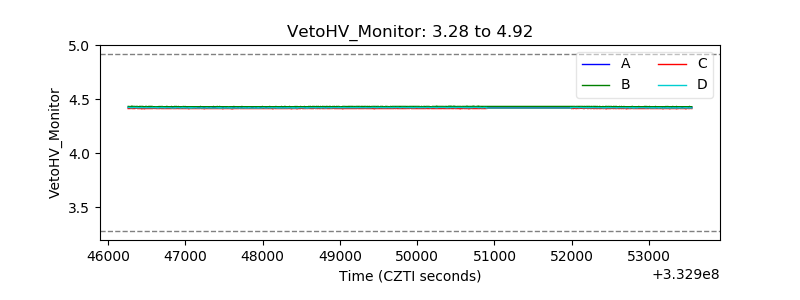 |
| Veto LLD | 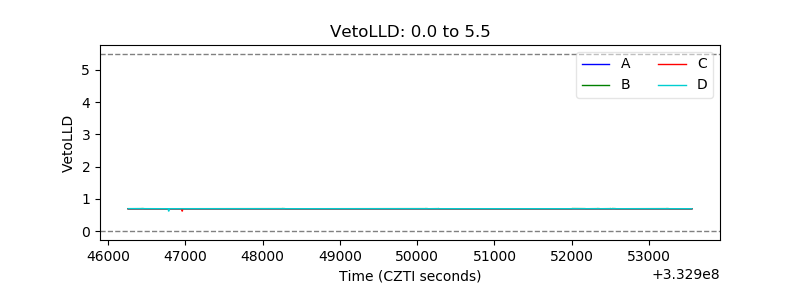 |
| Alpha Counter | 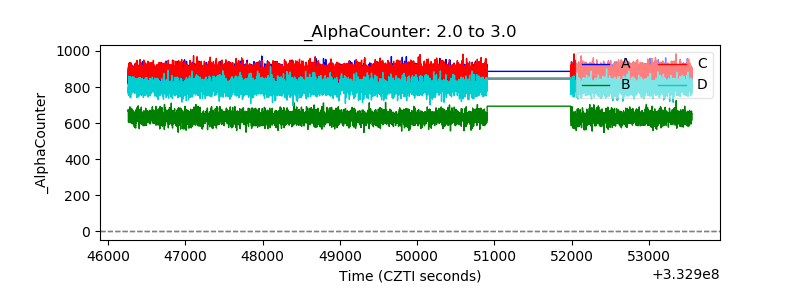 |
| _CPM_Rate | 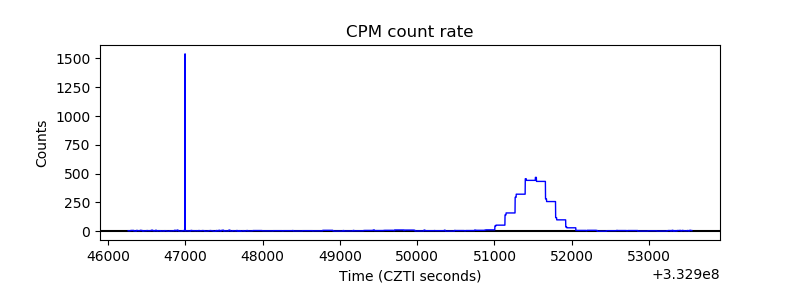 |
| CZT Counter | 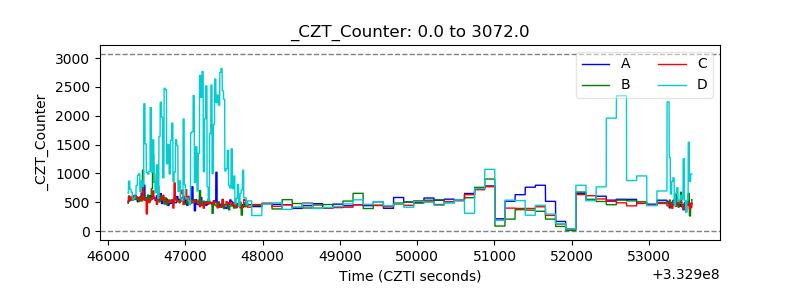 |
| +2.5 Volts monitor |  |
| +5 Volts monitor |  |
| _ROLL_ROT | 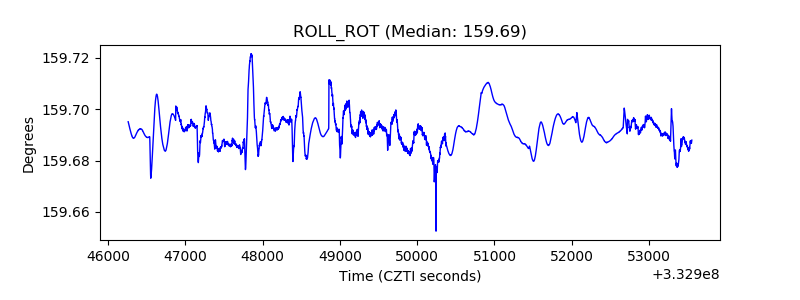 |
| _Roll_DEC | 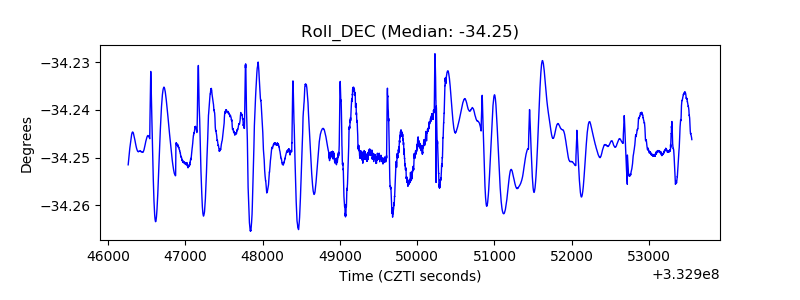 |
| _Roll_RA | 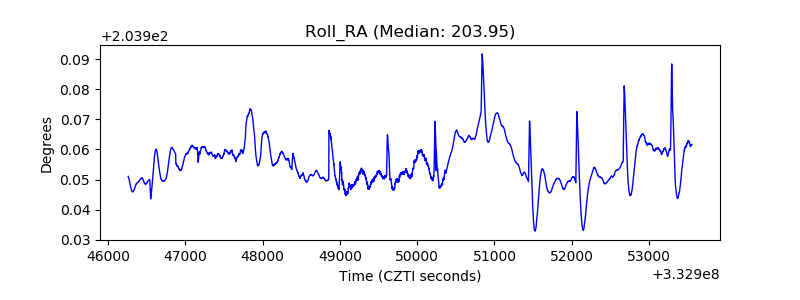 |
| Veto Counter | 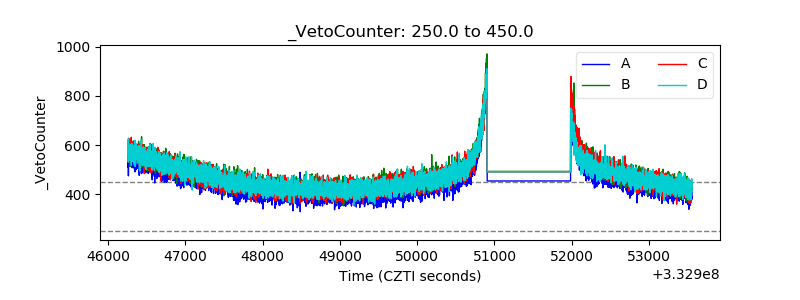 |