| Param | Original file | Final file |
|---|---|---|
| Filename | modeM0/AS1A07_068T01_9000003760_26014cztM0_level2.evt | modeM0/AS1A07_068T01_9000003760_26014cztM0_level2_quad_clean.evt |
| Size (bytes) | 500,569,920 | 88,583,040 |
| Size | 477.4 MB | 84.5 MB |
| Events in quadrant A | 3,259,893 | 585,078 |
| Events in quadrant B | 3,096,509 | 581,735 |
| Events in quadrant C | 3,018,554 | 551,112 |
| Events in quadrant D | 5,357,789 | 525,153 |
| Mode M0 | |||
|---|---|---|---|
| Quadrant | BADHDUFLAG | Total packets | Discarded packets |
| A | 0 | 13650 | 0 |
| B | 0 | 13125 | 0 |
| C | 0 | 13032 | 0 |
| D | 0 | 20253 | 0 |
| Mode M9 | |||
|---|---|---|---|
| Quadrant | BADHDUFLAG | Total packets | Discarded packets |
| A | 0 | 8 | 0 |
| B | 0 | 8 | 0 |
| C | 0 | 8 | 0 |
| D | 0 | 8 | 0 |
| Quadrant | Total seconds | Saturated seconds | Saturation percentage |
|---|---|---|---|
| A | 6293 | 74 | 1.175910% |
| B | 6294 | 55 | 0.873848% |
| C | 6294 | 62 | 0.985065% |
| D | 6294 | 455 | 7.229107% |
Noise dominated data is calculated using 1-second bins in cleaned event files. If a bin has >2000 counts, and if more than 50% of those come from <1% of pixels, then it is considered to be noise-dominated and hence unusable.
| Quadrant | # 1 sec bins | Bins with >0 counts | Bins with >2000 counts | High rate bins dominated by noise | Noise dominated (total time) | Noise dominated (detector-on time) | Marked lightcurve |
|---|---|---|---|---|---|---|---|
| A | 7058 | 6294 | 39 | 39 | 0.55% | 0.62% | 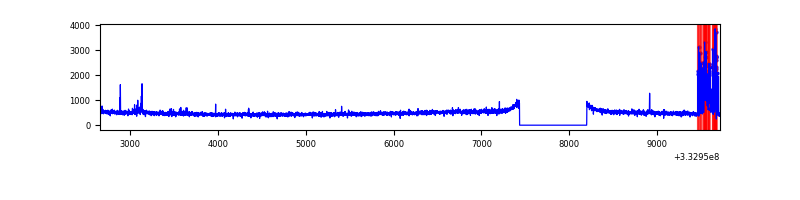 |
| B | 7059 | 6295 | 0 | 0 | 0.00% | 0.00% | 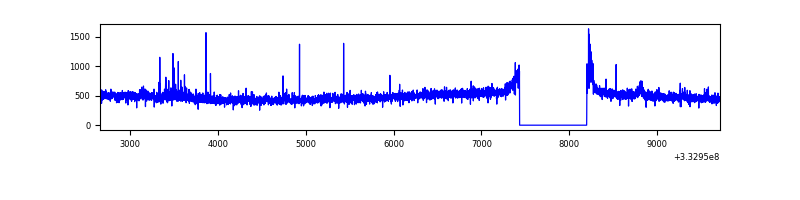 |
| C | 7059 | 6295 | 0 | 0 | 0.00% | 0.00% |  |
| D | 7059 | 6294 | 419 | 419 | 5.94% | 6.66% | 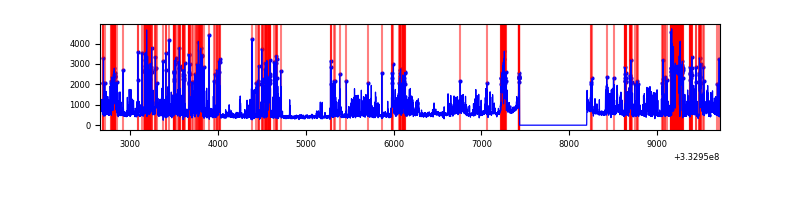 |
Top three noisy pixels from each quadrant. If the there are fewer than three noisy pixels in the level2.evt file, extra rows are filled as -1
| Pixel properties | Quadrant properties | ||||||
|---|---|---|---|---|---|---|---|
| Quadrant | DetID | PixID | Counts | Sigma | Mean | Median | Sigma |
| A | 0 | 13 | 230374 | 1454.59 | 786 | 771 | 157.8 |
| A | 13 | 254 | 8401 | 48.33 | 786 | 771 | 157.8 |
| A | 3 | 137 | 7301 | 41.37 | 786 | 771 | 157.8 |
| B | 0 | 229 | 43605 | 290.29 | 769 | 750 | 147.6 |
| B | 0 | 190 | 31305 | 206.97 | 769 | 750 | 147.6 |
| B | 12 | 111 | 17709 | 114.88 | 769 | 750 | 147.6 |
| C | 14 | 238 | 118575 | 685.78 | 735 | 737 | 171.8 |
| C | 3 | 233 | 29766 | 168.94 | 735 | 737 | 171.8 |
| C | 13 | 61 | 5087 | 25.31 | 735 | 737 | 171.8 |
| D | 1 | 52 | 2132154 | 11262.04 | 730 | 711 | 189.3 |
| D | 12 | 2 | 198146 | 1043.2 | 730 | 711 | 189.3 |
| D | 12 | 233 | 161236 | 848.18 | 730 | 711 | 189.3 |
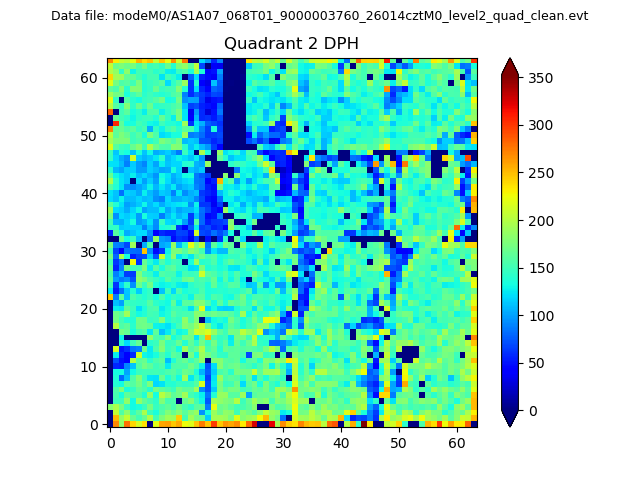
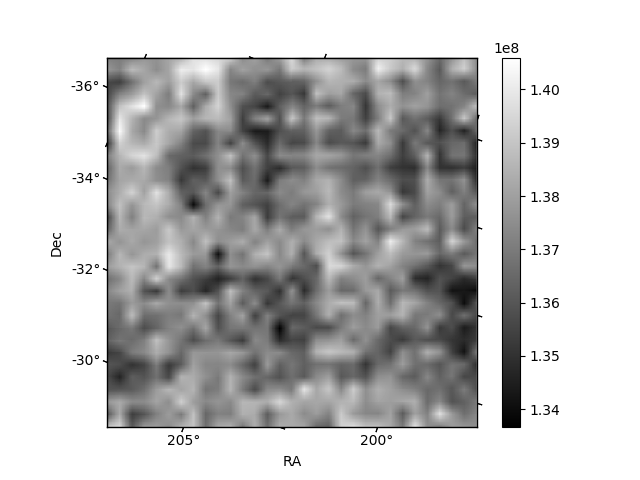
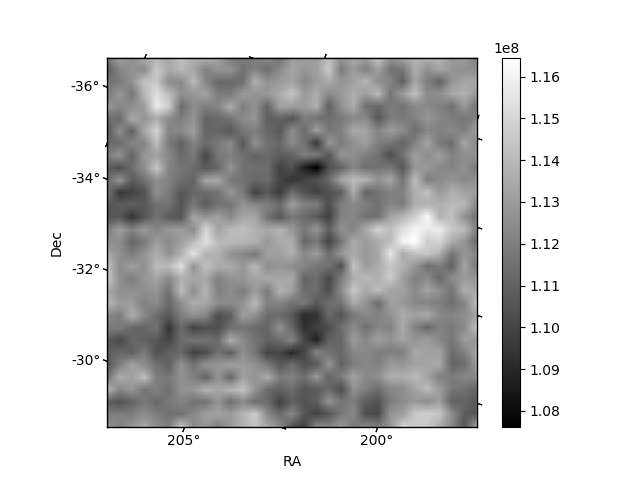
Histogram calculated using DETX and DETY for each event in the final _common_clean file
| Quadrant A | 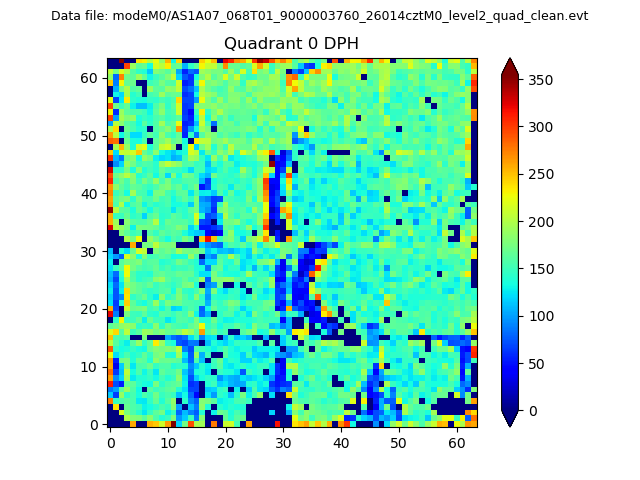 |
 |
Quadrant B |
|---|---|---|---|
| Quadrant D | 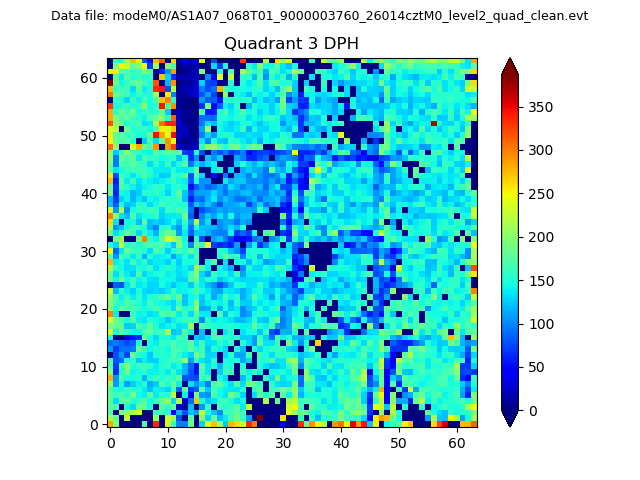 |
 |
Quadrant C |
| Plot type | Count rate plots | Images |
|---|---|---|
| Comparison with Poisson distribution Blue bars denote a histogram of data divided into 1 sec bins. Red curve is a Poisson curve with rate = median count rate of data. |
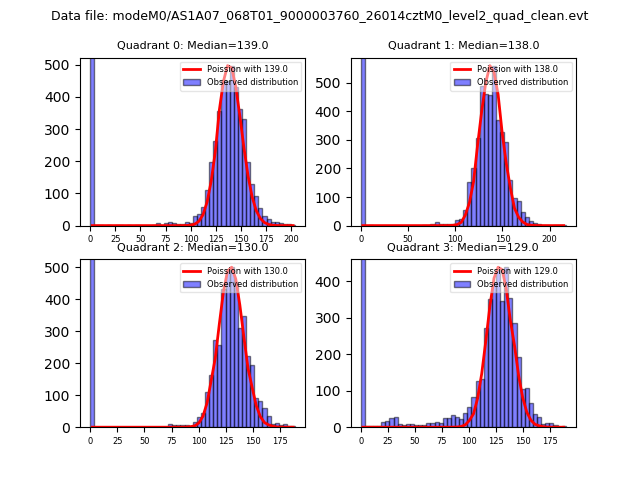 |
 |
| Quadrant-wise count rates Data is divided into 100 sec bins |
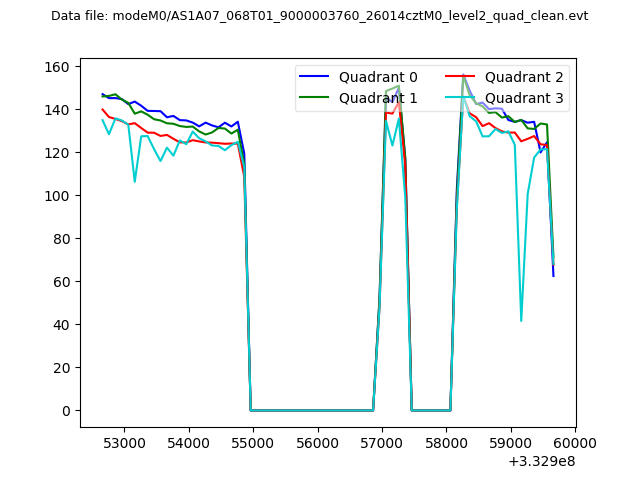 |
|
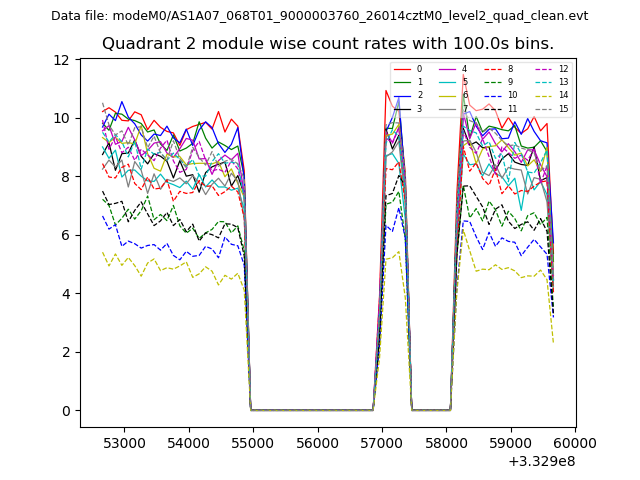
| Module-wise count rates for Quadrant A Data is divided into 100 sec bins |
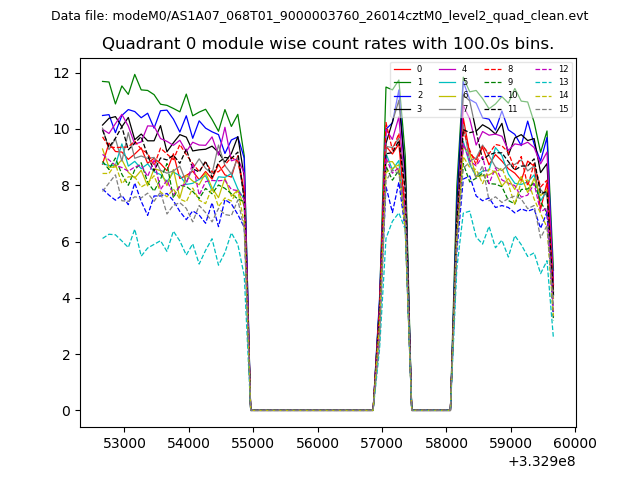 |
 |
| Module-wise count rates for Quadrant B Data is divided into 100 sec bins |
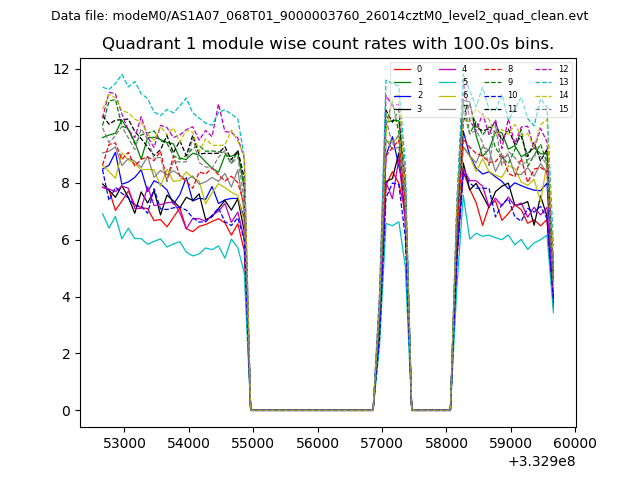 |
 |
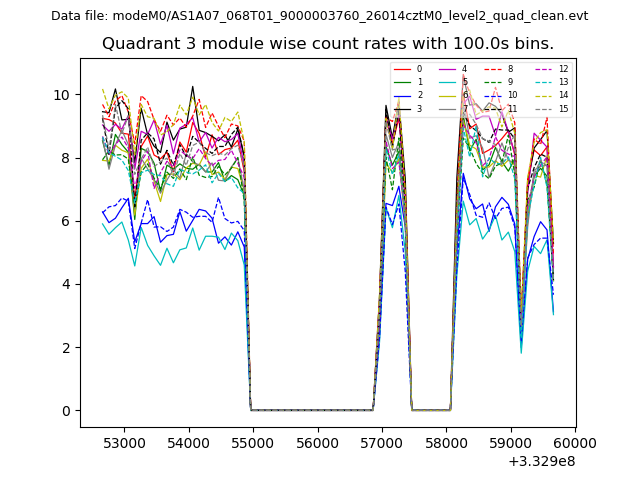
| Module-wise count rates for Quadrant C Data is divided into 100 sec bins |
 |
 |
| Module-wise count rates for Quadrant D Data is divided into 100 sec bins |
 |
 |
| Parameter | Plot |
|---|---|
| CZT HV Monitor | 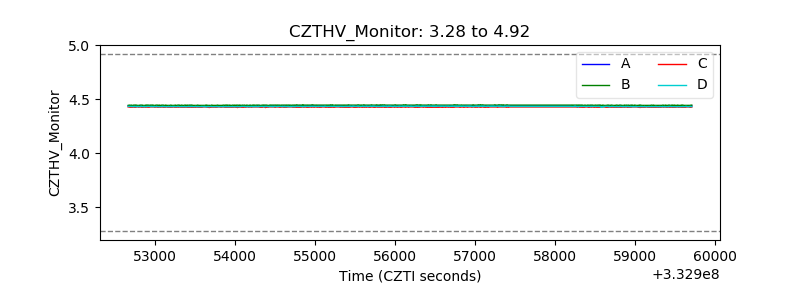 |
| D_VDD | 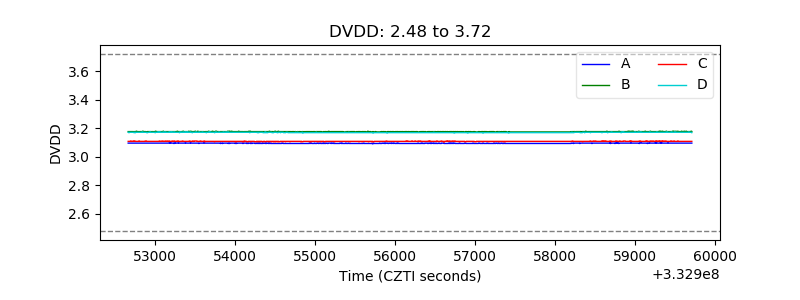 |
| Temperature 1 | 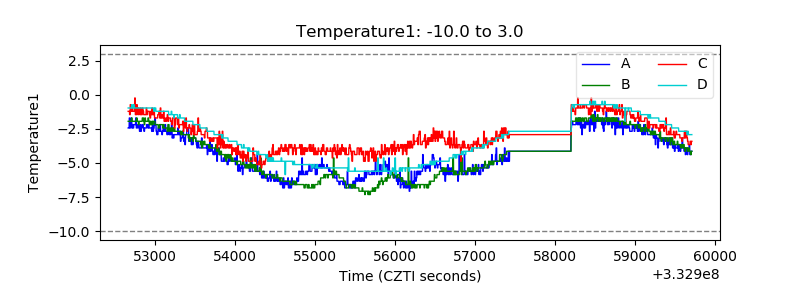 |
| Veto HV Monitor | 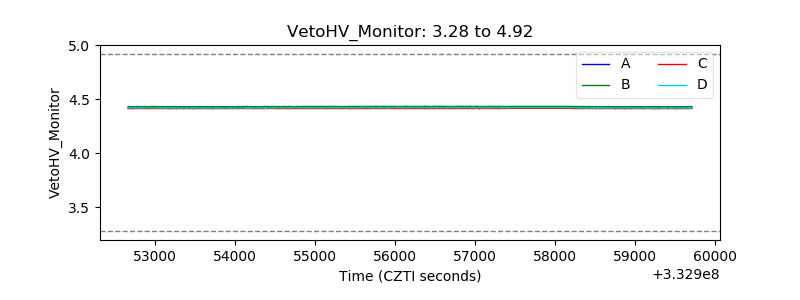 |
| Veto LLD | 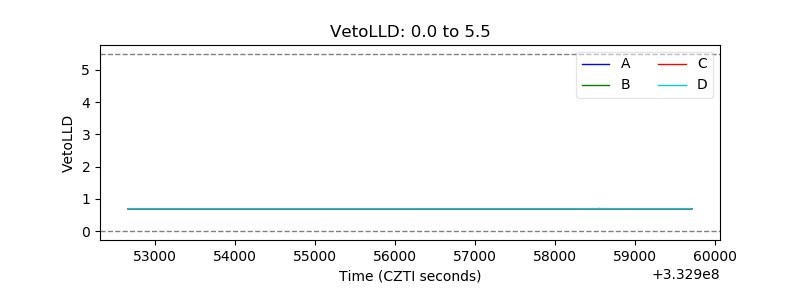 |
| Alpha Counter | 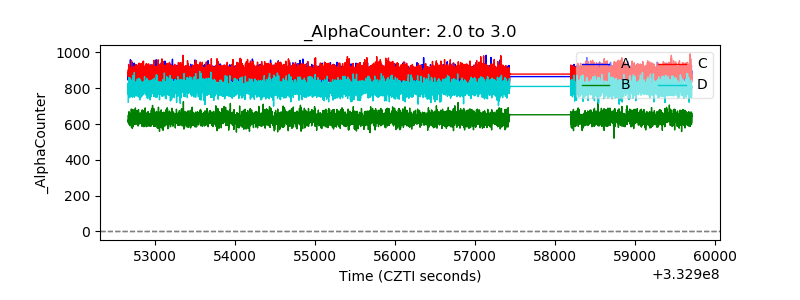 |
| _CPM_Rate | 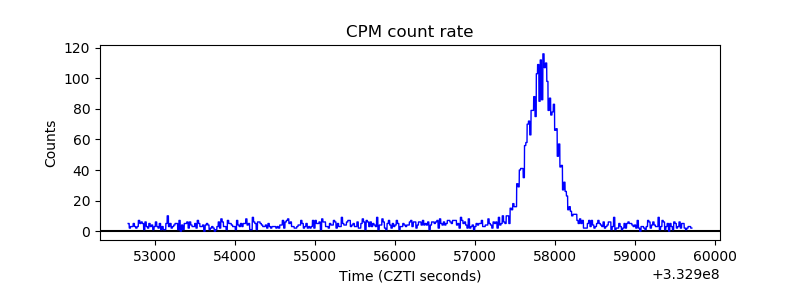 |
| CZT Counter | 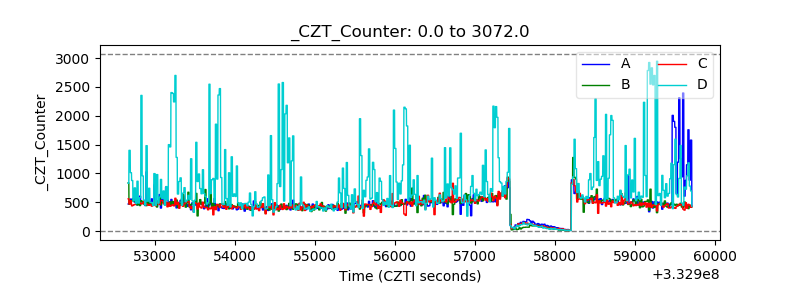 |
| +2.5 Volts monitor |  |
| +5 Volts monitor |  |
| _ROLL_ROT | 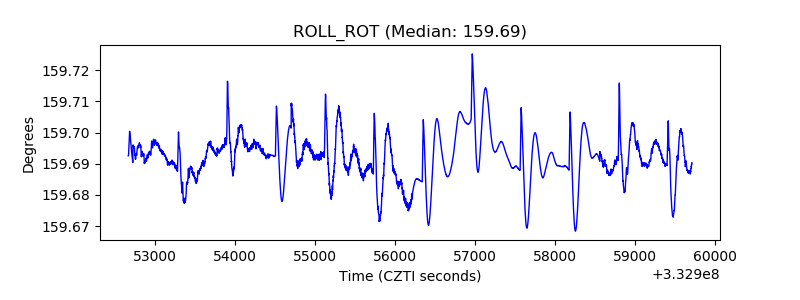 |
| _Roll_DEC | 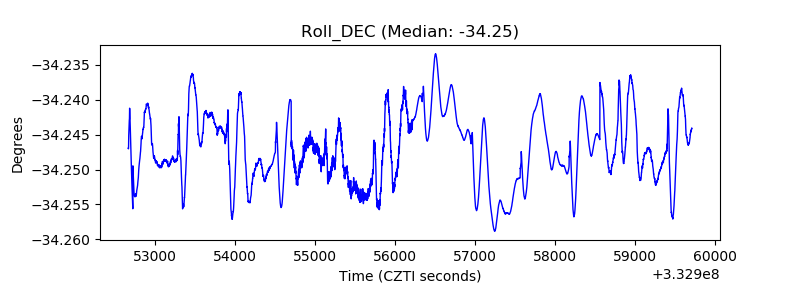 |
| _Roll_RA |  |
| Veto Counter | 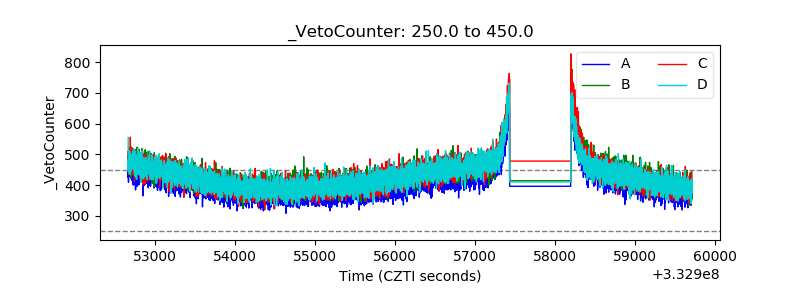 |