| Param | Original file | Final file |
|---|---|---|
| Filename | modeM0/AS1A07_068T01_9000003760_26015cztM0_level2.evt | modeM0/AS1A07_068T01_9000003760_26015cztM0_level2_quad_clean.evt |
| Size (bytes) | 575,976,960 | 106,986,240 |
| Size | 549.3 MB | 102.0 MB |
| Events in quadrant A | 3,966,027 | 705,053 |
| Events in quadrant B | 3,545,772 | 711,597 |
| Events in quadrant C | 3,485,142 | 673,468 |
| Events in quadrant D | 5,949,533 | 639,464 |
| Mode M0 | |||
|---|---|---|---|
| Quadrant | BADHDUFLAG | Total packets | Discarded packets |
| A | 0 | 16428 | 0 |
| B | 0 | 15215 | 0 |
| C | 0 | 15137 | 0 |
| D | 0 | 22683 | 0 |
| Mode M9 | |||
|---|---|---|---|
| Quadrant | BADHDUFLAG | Total packets | Discarded packets |
| A | 0 | 4 | 0 |
| B | 0 | 4 | 0 |
| C | 0 | 4 | 0 |
| D | 0 | 4 | 0 |
| Quadrant | Total seconds | Saturated seconds | Saturation percentage |
|---|---|---|---|
| A | 7326 | 98 | 1.337701% |
| B | 7327 | 47 | 0.641463% |
| C | 7327 | 75 | 1.023611% |
| D | 7327 | 585 | 7.984168% |
Noise dominated data is calculated using 1-second bins in cleaned event files. If a bin has >2000 counts, and if more than 50% of those come from <1% of pixels, then it is considered to be noise-dominated and hence unusable.
| Quadrant | # 1 sec bins | Bins with >0 counts | Bins with >2000 counts | High rate bins dominated by noise | Noise dominated (total time) | Noise dominated (detector-on time) | Marked lightcurve |
|---|---|---|---|---|---|---|---|
| A | 7711 | 7327 | 77 | 77 | 1.00% | 1.05% | 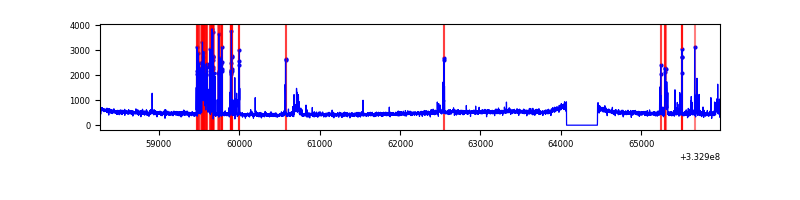 |
| B | 7712 | 7328 | 0 | 0 | 0.00% | 0.00% | 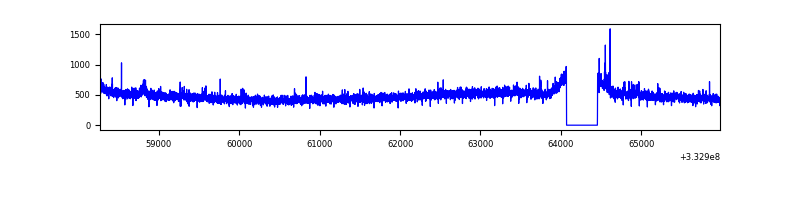 |
| C | 7712 | 7328 | 0 | 0 | 0.00% | 0.00% | 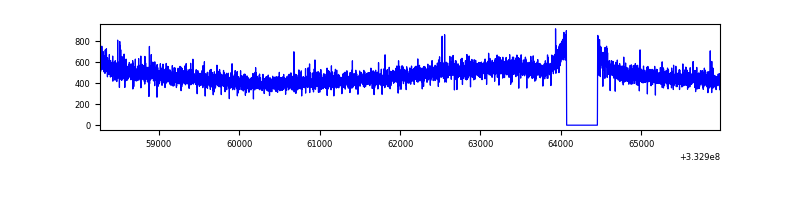 |
| D | 7712 | 7327 | 524 | 524 | 6.79% | 7.15% | 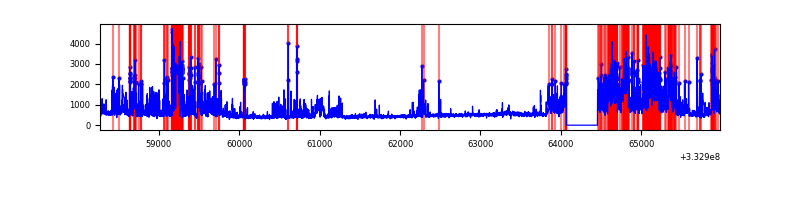 |
Top three noisy pixels from each quadrant. If the there are fewer than three noisy pixels in the level2.evt file, extra rows are filled as -1
| Pixel properties | Quadrant properties | ||||||
|---|---|---|---|---|---|---|---|
| Quadrant | DetID | PixID | Counts | Sigma | Mean | Median | Sigma |
| A | 0 | 13 | 478244 | 2631.29 | 903 | 883 | 181.4 |
| A | 13 | 254 | 10602 | 53.57 | 903 | 883 | 181.4 |
| A | 3 | 137 | 8558 | 42.31 | 903 | 883 | 181.4 |
| B | 0 | 190 | 25274 | 141.65 | 892 | 871 | 172.3 |
| B | 12 | 111 | 20906 | 116.3 | 892 | 871 | 172.3 |
| B | 11 | 111 | 18571 | 102.74 | 892 | 871 | 172.3 |
| C | 14 | 238 | 135954 | 679.31 | 851 | 855 | 198.9 |
| C | 3 | 233 | 29579 | 144.43 | 851 | 855 | 198.9 |
| C | 13 | 61 | 5876 | 25.25 | 851 | 855 | 198.9 |
| D | 1 | 52 | 1403370 | 6421.58 | 842 | 821 | 218.4 |
| D | 12 | 2 | 1152344 | 5272.26 | 842 | 821 | 218.4 |
| D | 12 | 233 | 103747 | 471.25 | 842 | 821 | 218.4 |
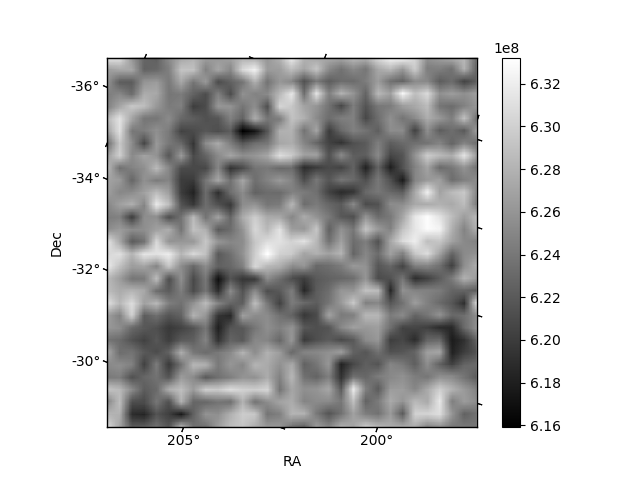
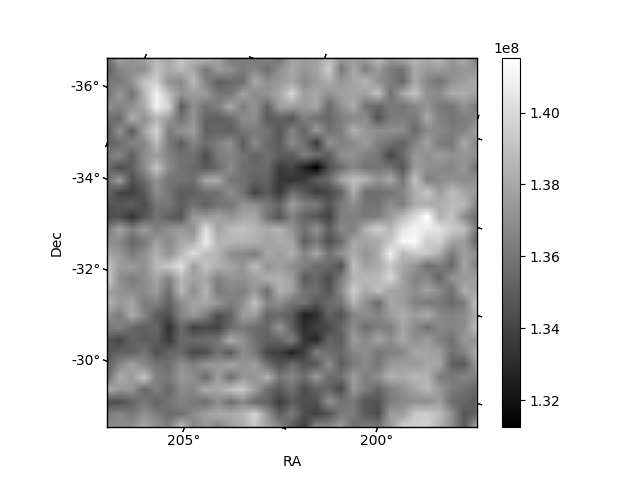
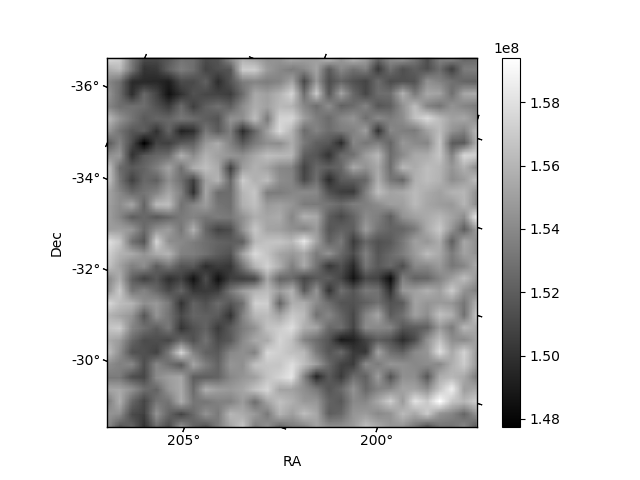
Histogram calculated using DETX and DETY for each event in the final _common_clean file
| Quadrant A | 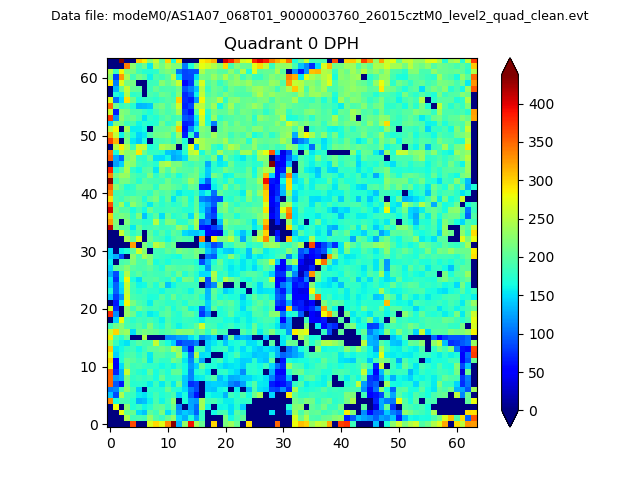 |
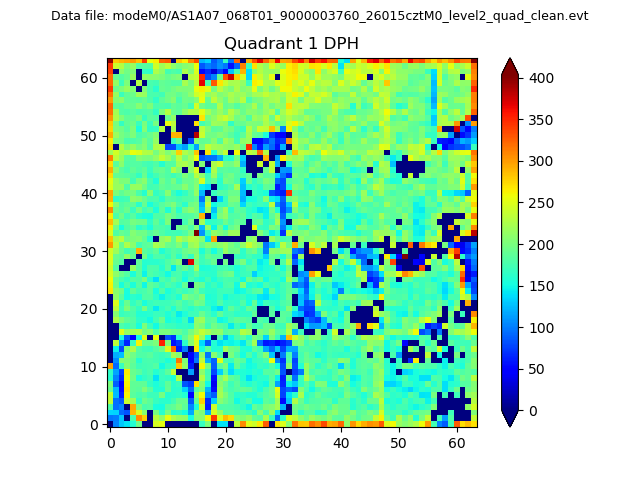 |
Quadrant B |
|---|---|---|---|
| Quadrant D | 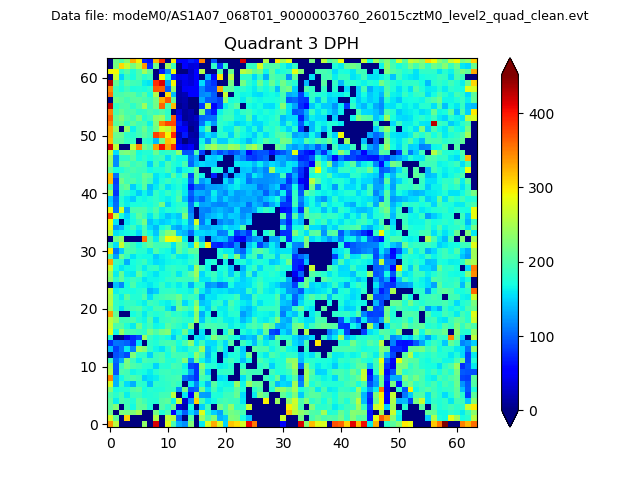 |
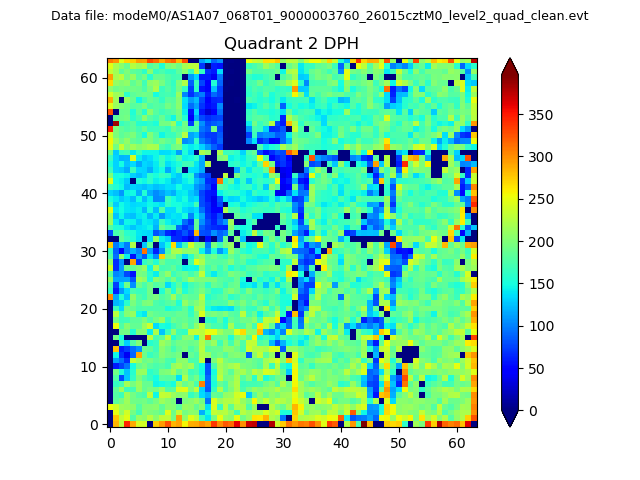 |
Quadrant C |
| Plot type | Count rate plots | Images |
|---|---|---|
| Comparison with Poisson distribution Blue bars denote a histogram of data divided into 1 sec bins. Red curve is a Poisson curve with rate = median count rate of data. |
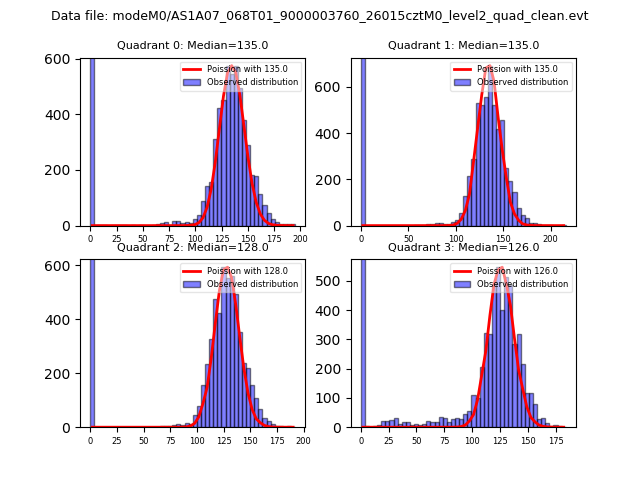 |
 |
| Quadrant-wise count rates Data is divided into 100 sec bins |
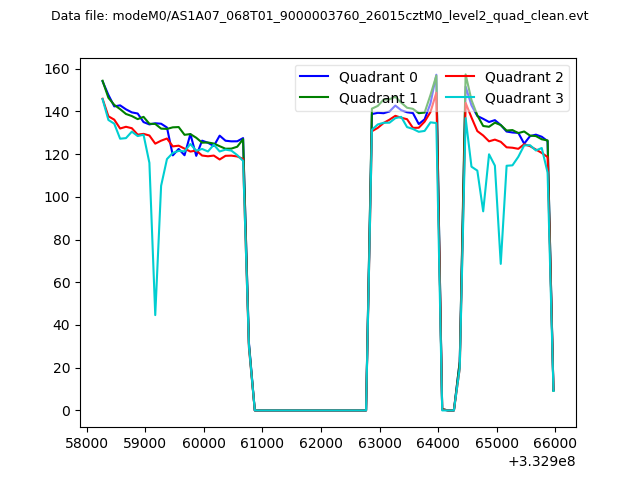 |
|
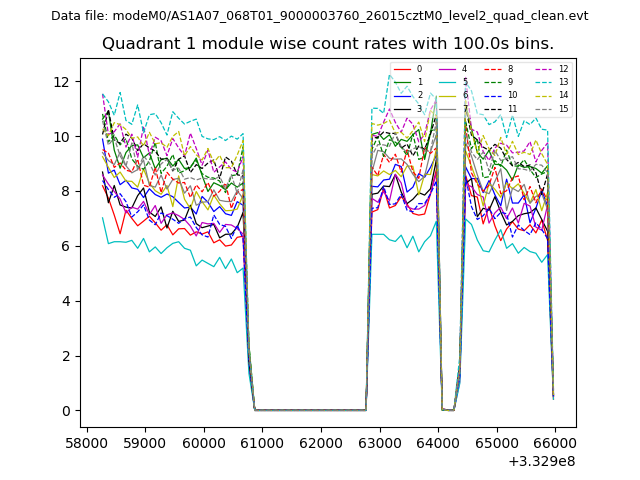
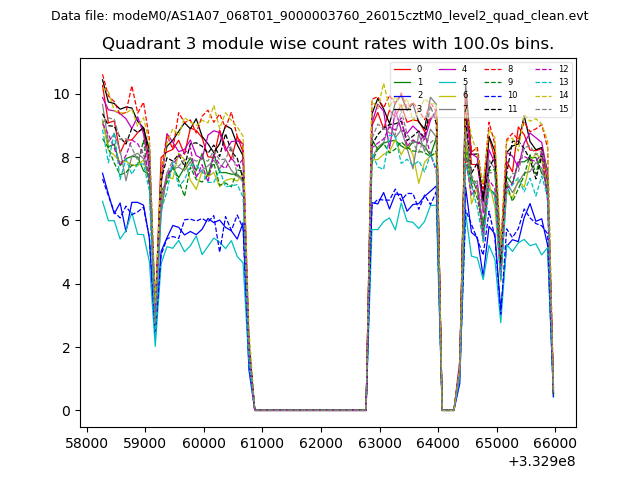
| Module-wise count rates for Quadrant A Data is divided into 100 sec bins |
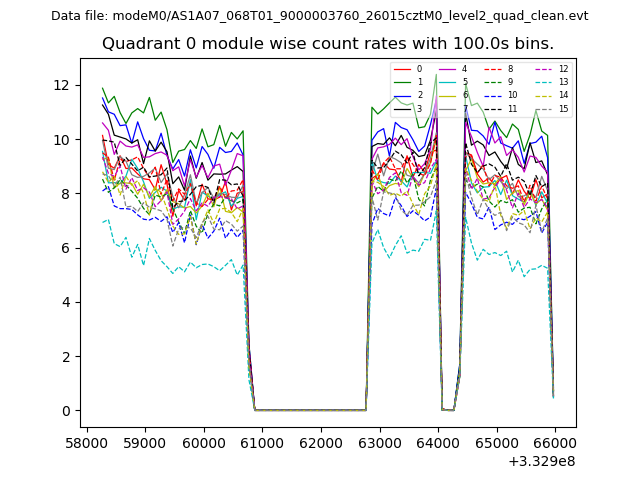 |
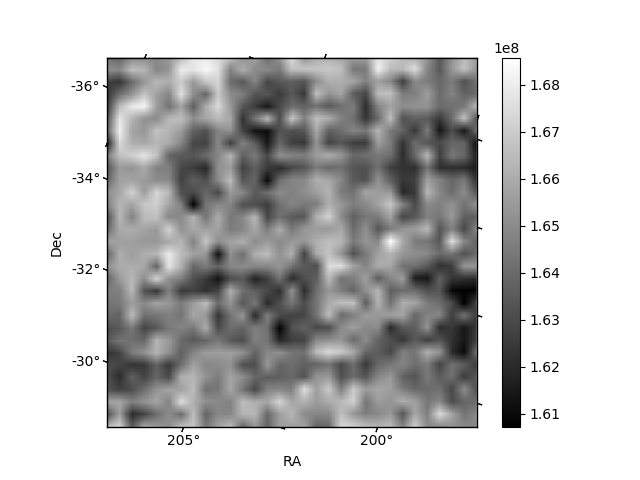 |
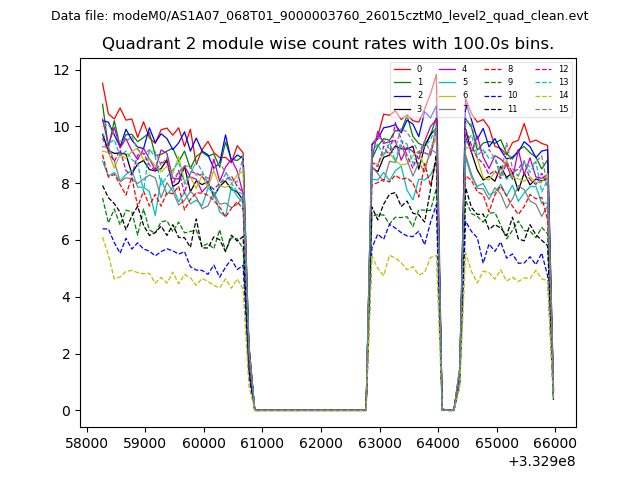
| Module-wise count rates for Quadrant B Data is divided into 100 sec bins |
 |
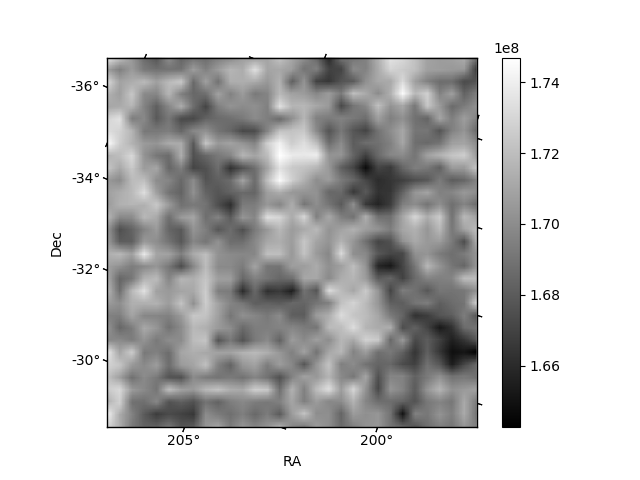 |
| Module-wise count rates for Quadrant C Data is divided into 100 sec bins |
 |
 |
| Module-wise count rates for Quadrant D Data is divided into 100 sec bins |
 |
 |
| Parameter | Plot |
|---|---|
| CZT HV Monitor | 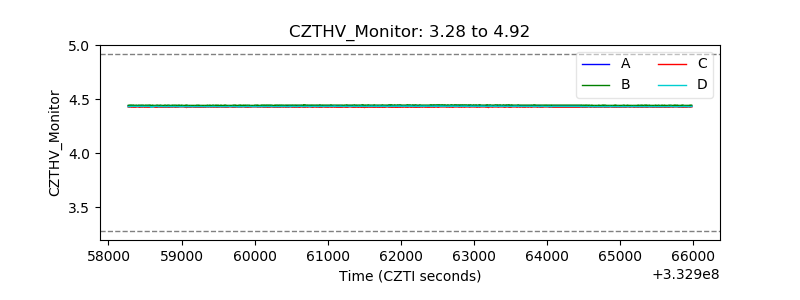 |
| D_VDD | 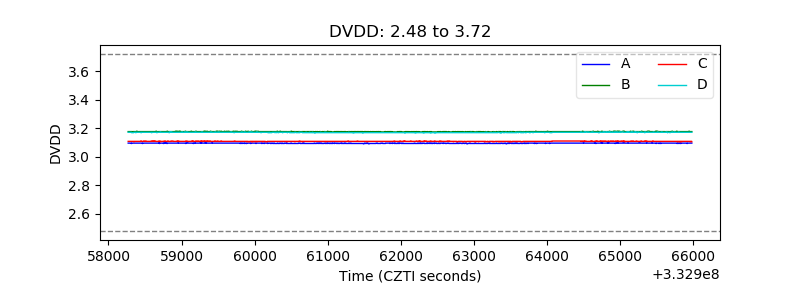 |
| Temperature 1 | 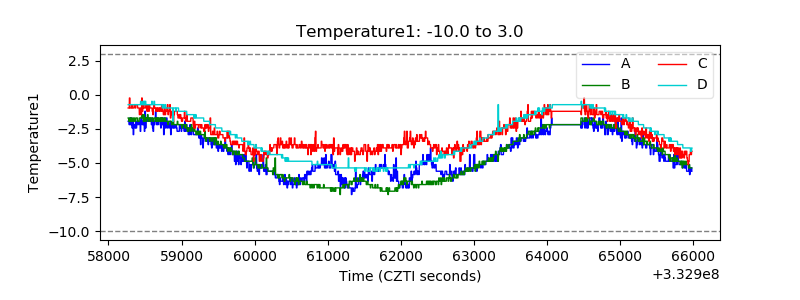 |
| Veto HV Monitor | 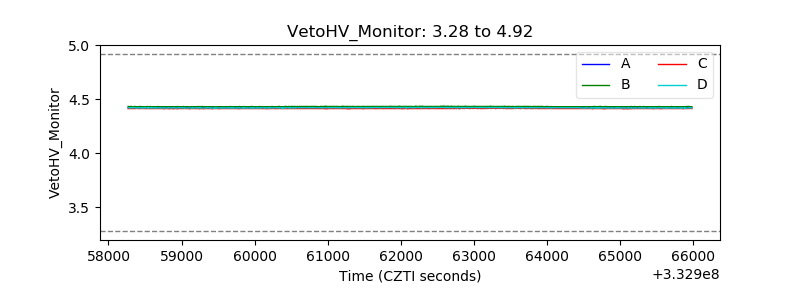 |
| Veto LLD | 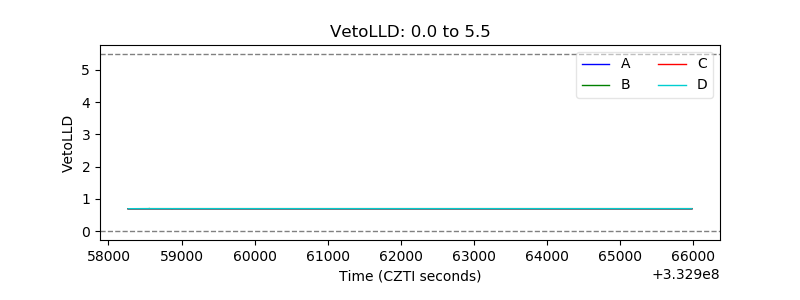 |
| Alpha Counter | 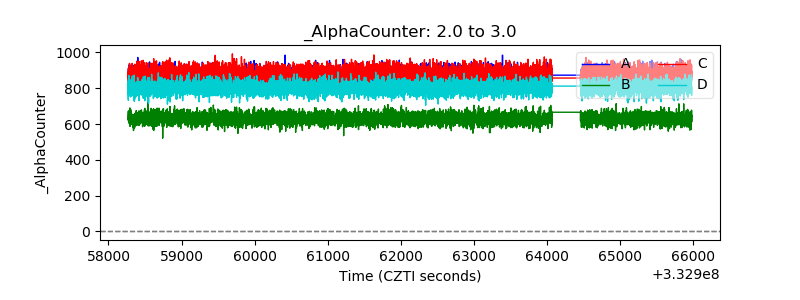 |
| _CPM_Rate | 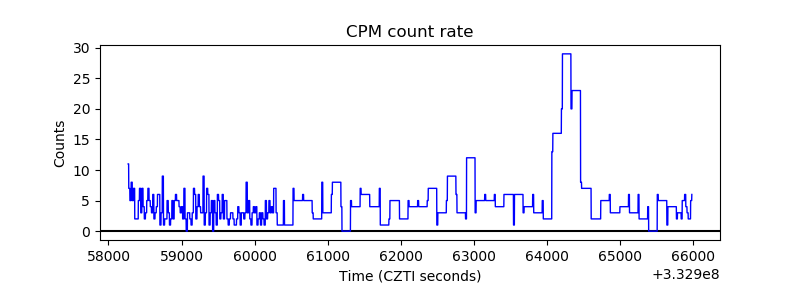 |
| CZT Counter | 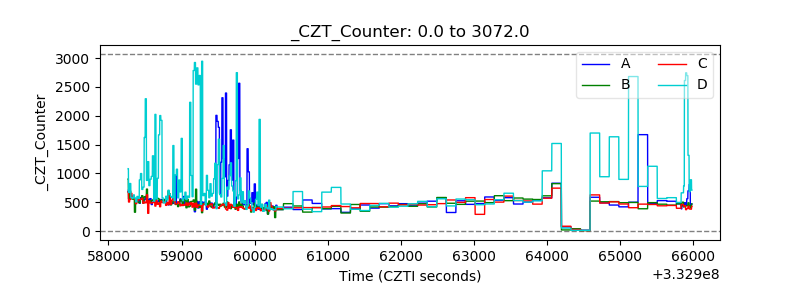 |
| +2.5 Volts monitor | 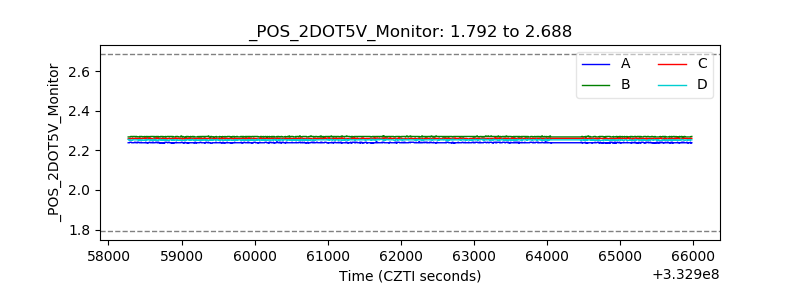 |
| +5 Volts monitor |  |
| _ROLL_ROT | 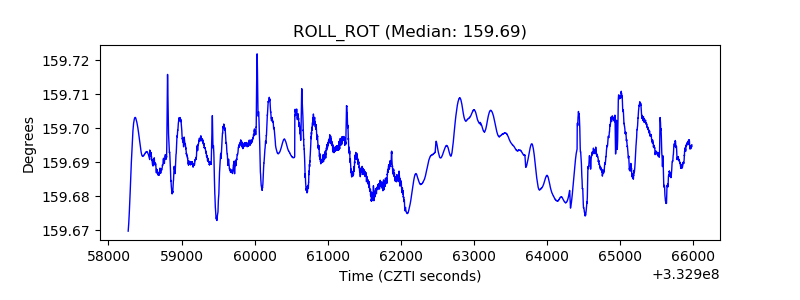 |
| _Roll_DEC | 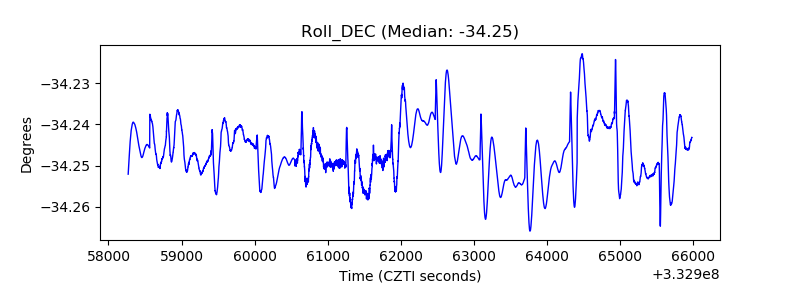 |
| _Roll_RA | 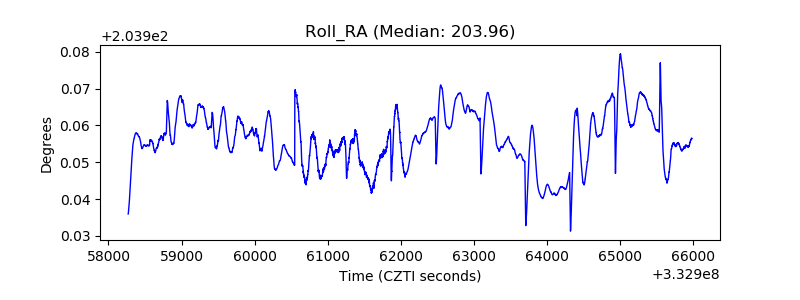 |
| Veto Counter | 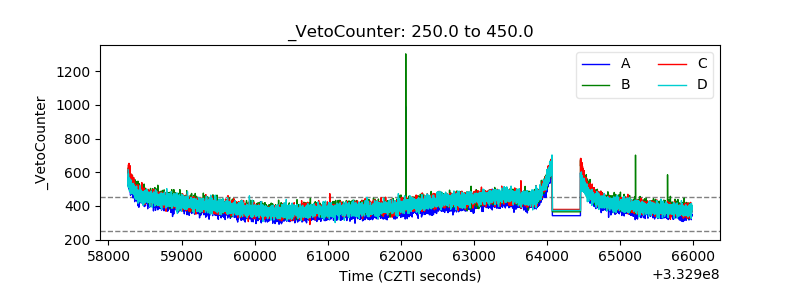 |