| Param | Original file | Final file |
|---|---|---|
| Filename | modeM0/AS1A07_068T01_9000003760_26016cztM0_level2.evt | modeM0/AS1A07_068T01_9000003760_26016cztM0_level2_quad_clean.evt |
| Size (bytes) | 729,633,600 | 108,380,160 |
| Size | 695.8 MB | 103.4 MB |
| Events in quadrant A | 5,257,107 | 728,601 |
| Events in quadrant B | 3,821,389 | 736,194 |
| Events in quadrant C | 3,579,822 | 700,127 |
| Events in quadrant D | 8,924,968 | 588,132 |
| Mode M0 | |||
|---|---|---|---|
| Quadrant | BADHDUFLAG | Total packets | Discarded packets |
| A | 0 | 20573 | 0 |
| B | 0 | 16226 | 0 |
| C | 0 | 15672 | 0 |
| D | 0 | 31792 | 0 |
| Mode M9 | |||
|---|---|---|---|
| Quadrant | BADHDUFLAG | Total packets | Discarded packets |
| A | 0 | 3 | 0 |
| B | 0 | 3 | 0 |
| C | 0 | 3 | 0 |
| D | 0 | 3 | 0 |
| Quadrant | Total seconds | Saturated seconds | Saturation percentage |
|---|---|---|---|
| A | 7595 | 312 | 4.107966% |
| B | 7596 | 53 | 0.697736% |
| C | 7596 | 86 | 1.132175% |
| D | 7596 | 1766 | 23.249078% |
Noise dominated data is calculated using 1-second bins in cleaned event files. If a bin has >2000 counts, and if more than 50% of those come from <1% of pixels, then it is considered to be noise-dominated and hence unusable.
| Quadrant | # 1 sec bins | Bins with >0 counts | Bins with >2000 counts | High rate bins dominated by noise | Noise dominated (total time) | Noise dominated (detector-on time) | Marked lightcurve |
|---|---|---|---|---|---|---|---|
| A | 7865 | 7597 | 231 | 231 | 2.94% | 3.04% | 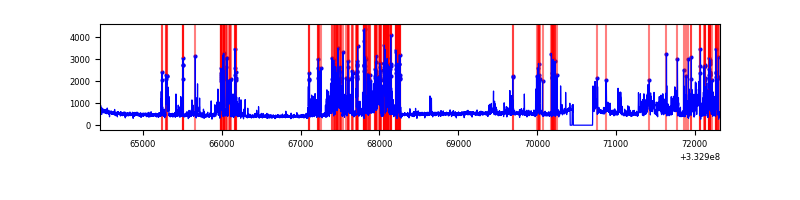 |
| B | 7866 | 7598 | 0 | 0 | 0.00% | 0.00% | 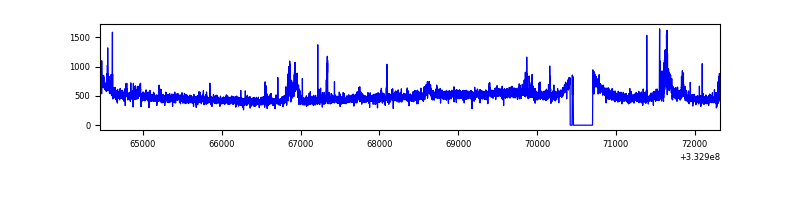 |
| C | 7866 | 7598 | 0 | 0 | 0.00% | 0.00% | 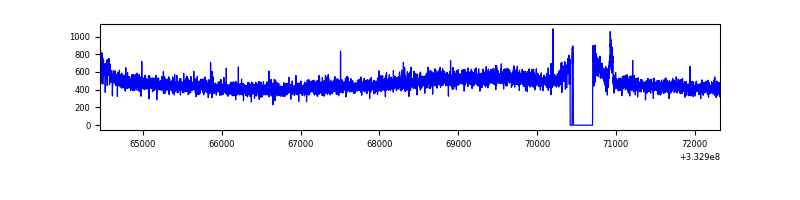 |
| D | 7866 | 7598 | 1433 | 1433 | 18.22% | 18.86% | 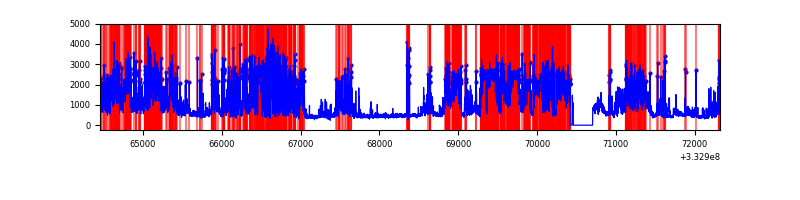 |
Top three noisy pixels from each quadrant. If the there are fewer than three noisy pixels in the level2.evt file, extra rows are filled as -1
| Pixel properties | Quadrant properties | ||||||
|---|---|---|---|---|---|---|---|
| Quadrant | DetID | PixID | Counts | Sigma | Mean | Median | Sigma |
| A | 0 | 13 | 1718669 | 9284.41 | 917 | 897 | 185.0 |
| A | 13 | 254 | 11218 | 55.78 | 917 | 897 | 185.0 |
| A | 3 | 137 | 8473 | 40.95 | 917 | 897 | 185.0 |
| B | 10 | 245 | 90244 | 504.34 | 916 | 892 | 177.2 |
| B | 15 | 222 | 58443 | 324.84 | 916 | 892 | 177.2 |
| B | 0 | 229 | 37029 | 203.97 | 916 | 892 | 177.2 |
| C | 14 | 238 | 140735 | 687.05 | 873 | 877 | 203.6 |
| C | 14 | 225 | 19105 | 89.55 | 873 | 877 | 203.6 |
| C | 3 | 233 | 14560 | 67.22 | 873 | 877 | 203.6 |
| D | 12 | 2 | 4451491 | 21621.12 | 790 | 769 | 205.9 |
| D | 1 | 52 | 1260484 | 6119.56 | 790 | 769 | 205.9 |
| D | 12 | 233 | 169354 | 818.97 | 790 | 769 | 205.9 |
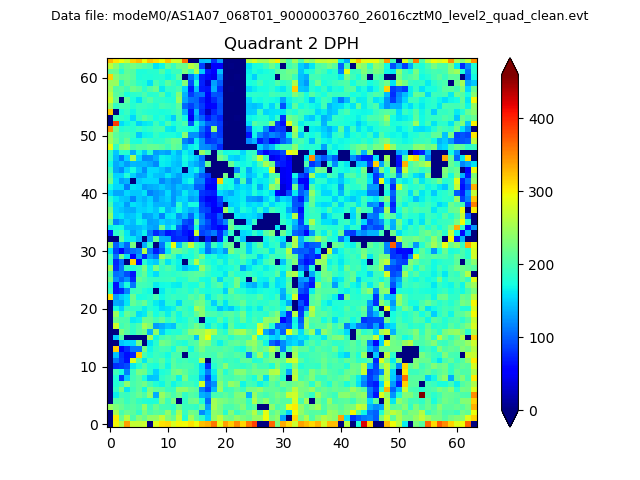
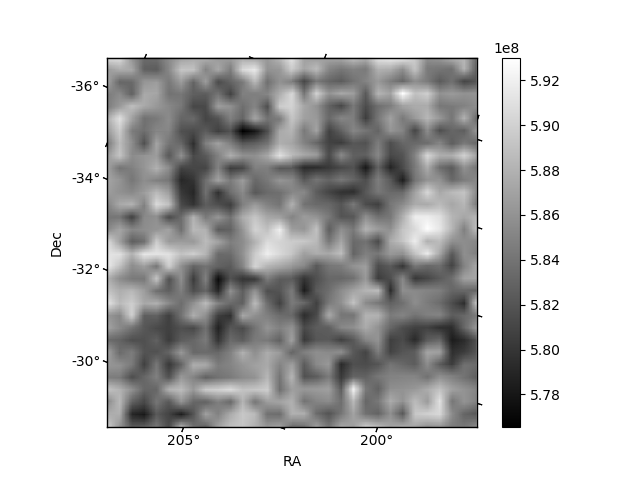
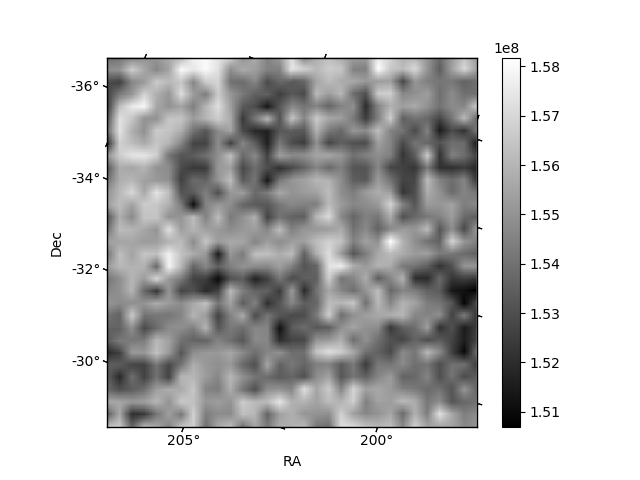
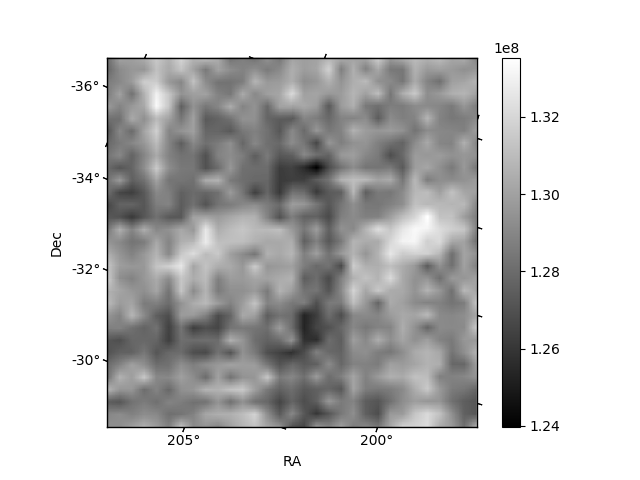
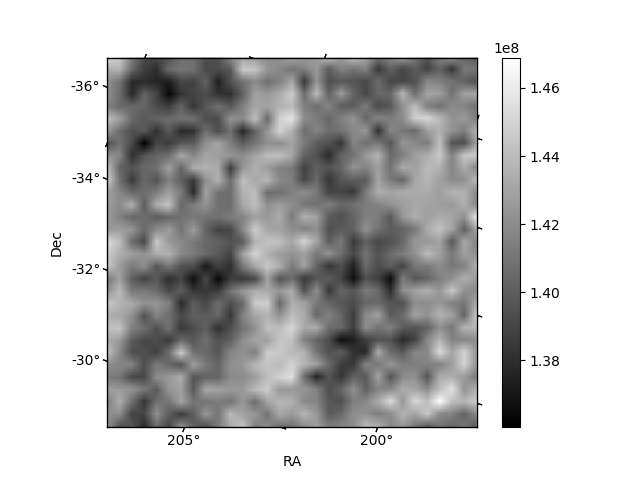
Histogram calculated using DETX and DETY for each event in the final _common_clean file
| Quadrant A | 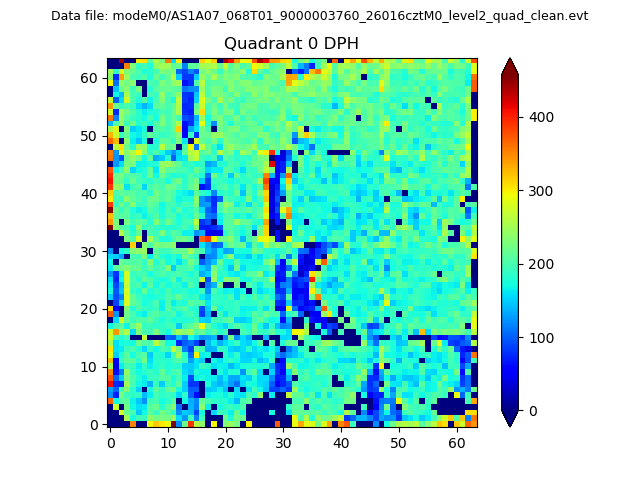 |
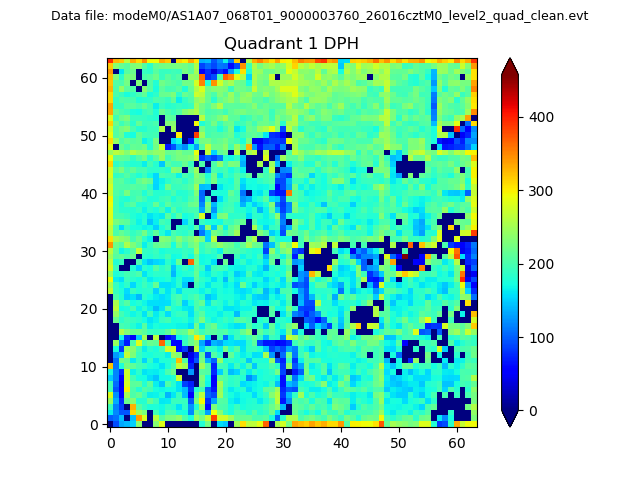 |
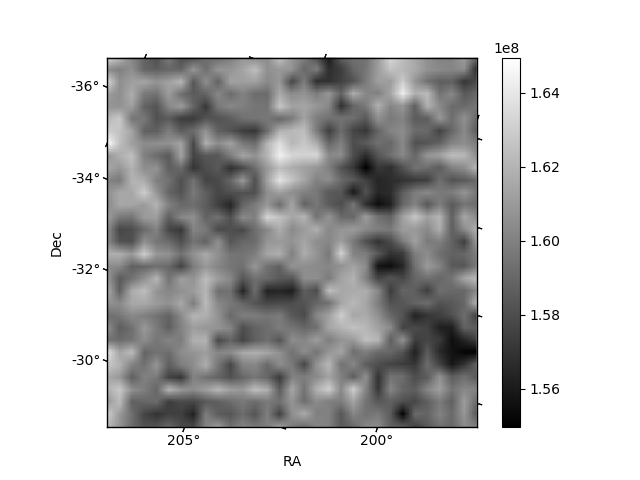
Quadrant B |
|---|---|---|---|
| Quadrant D | 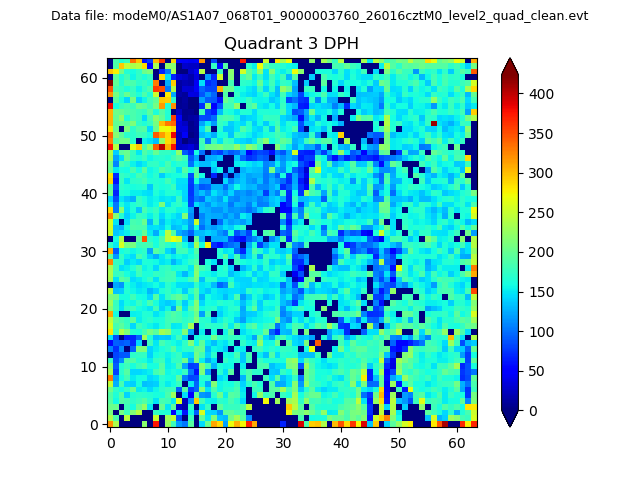 |
 |
Quadrant C |
| Plot type | Count rate plots | Images |
|---|---|---|
| Comparison with Poisson distribution Blue bars denote a histogram of data divided into 1 sec bins. Red curve is a Poisson curve with rate = median count rate of data. |
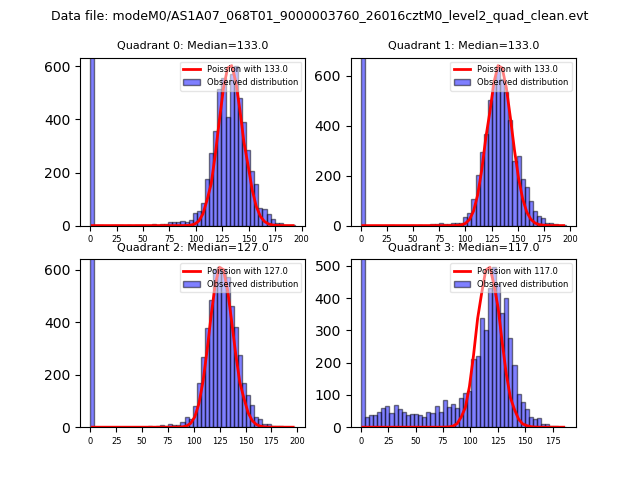 |
 |
| Quadrant-wise count rates Data is divided into 100 sec bins |
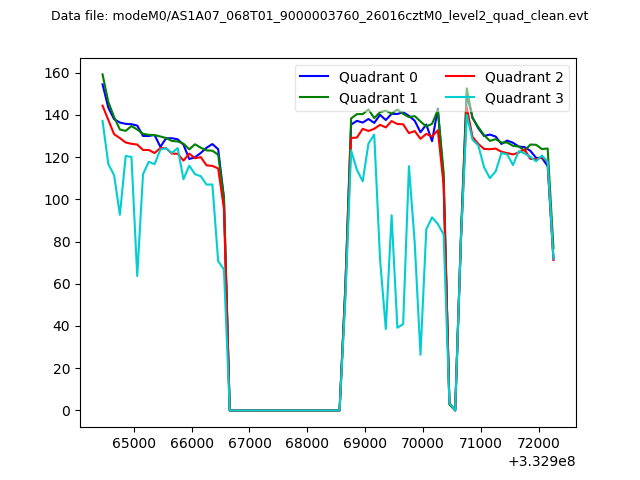 |
|
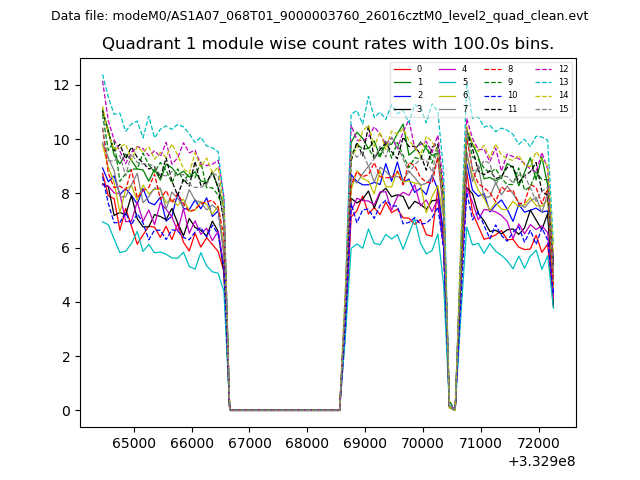
| Module-wise count rates for Quadrant A Data is divided into 100 sec bins |
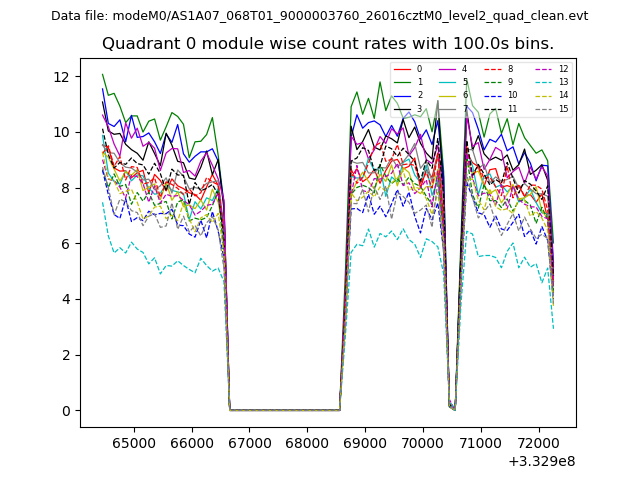 |
 |
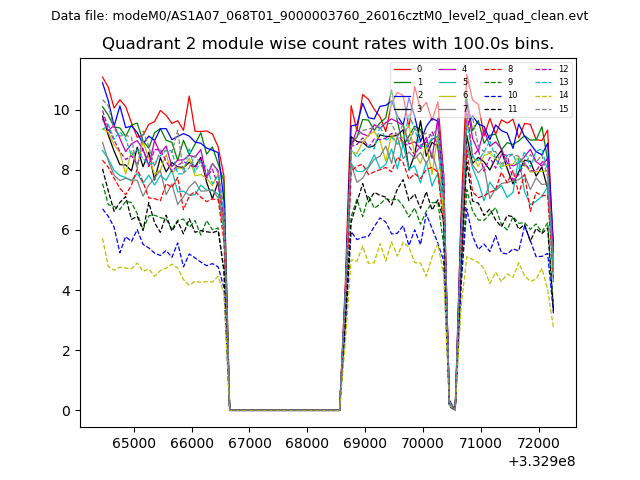
| Module-wise count rates for Quadrant B Data is divided into 100 sec bins |
 |
 |
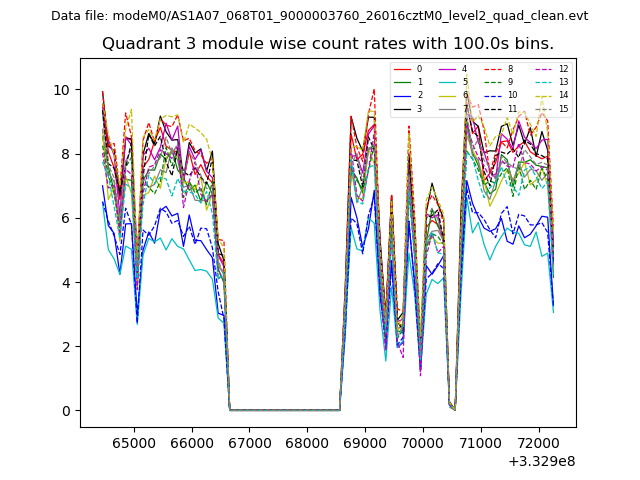
| Module-wise count rates for Quadrant C Data is divided into 100 sec bins |
 |
 |
| Module-wise count rates for Quadrant D Data is divided into 100 sec bins |
 |
 |
| Parameter | Plot |
|---|---|
| CZT HV Monitor | 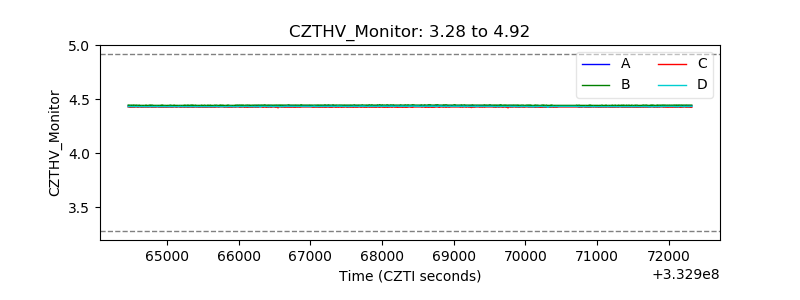 |
| D_VDD | 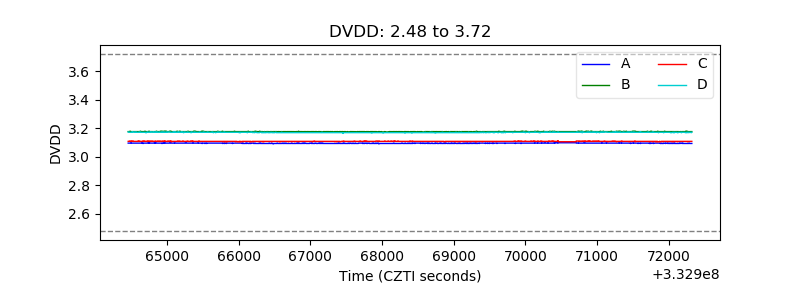 |
| Temperature 1 | 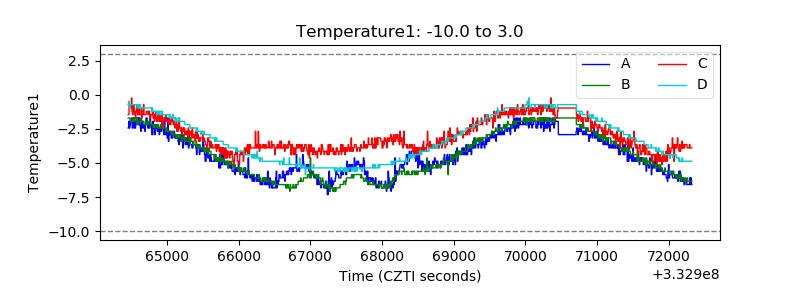 |
| Veto HV Monitor |  |
| Veto LLD | 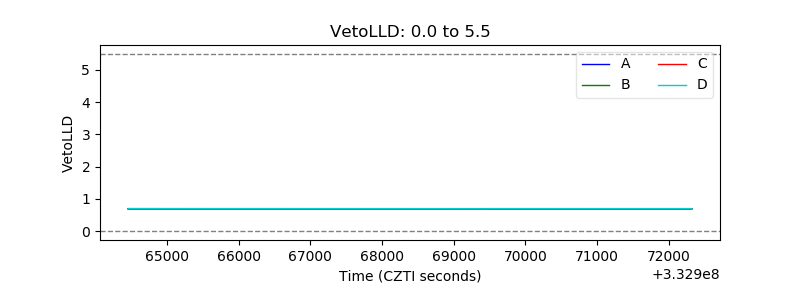 |
| Alpha Counter | 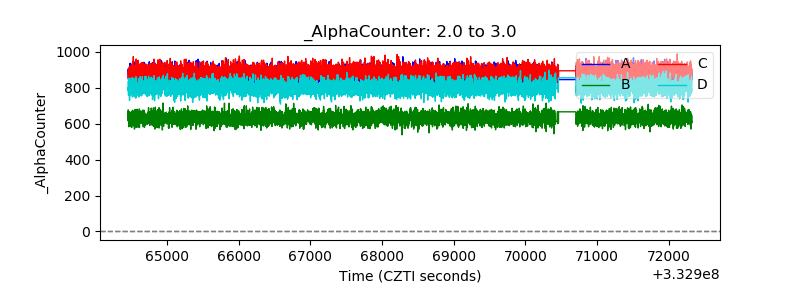 |
| _CPM_Rate | 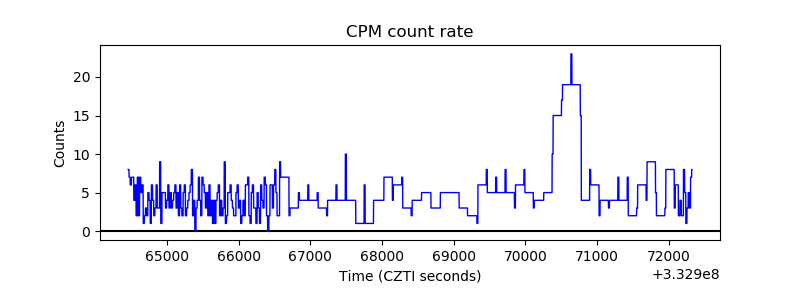 |
| CZT Counter | 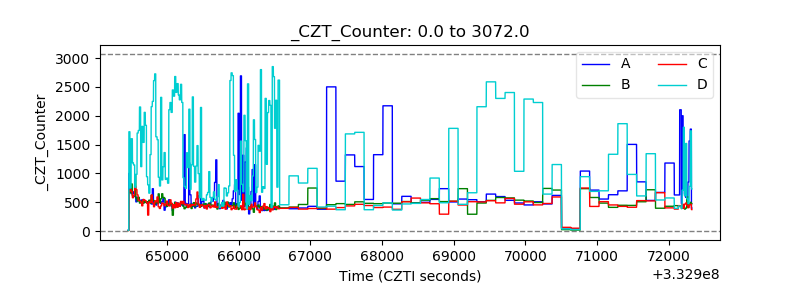 |
| +2.5 Volts monitor |  |
| +5 Volts monitor |  |
| _ROLL_ROT | 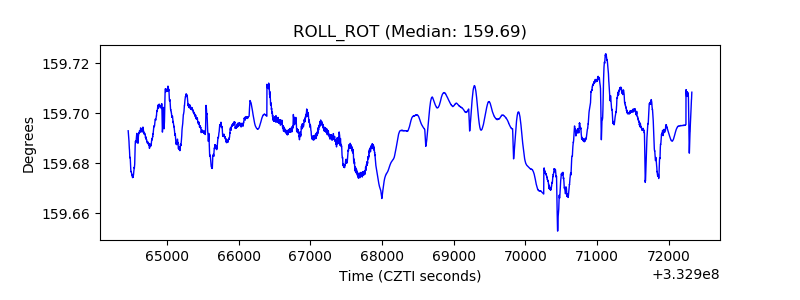 |
| _Roll_DEC | 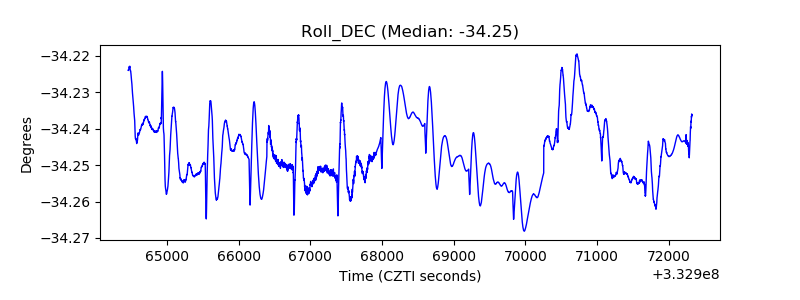 |
| _Roll_RA | 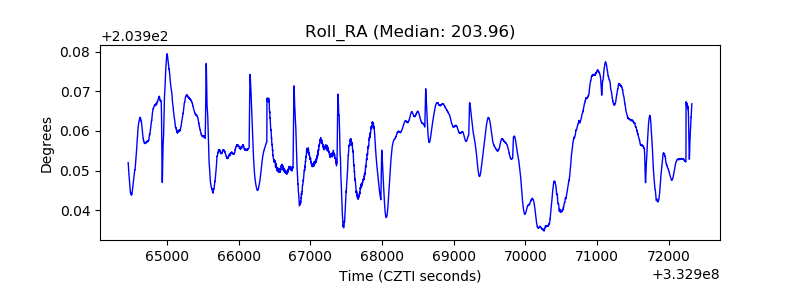 |
| Veto Counter | 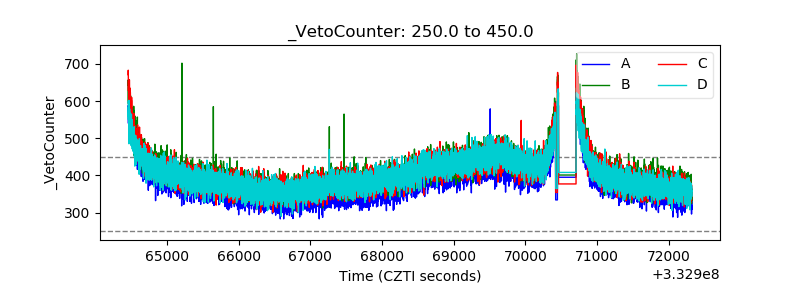 |