| Param | Original file | Final file |
|---|---|---|
| Filename | modeM0/AS1A07_068T01_9000003760_26017cztM0_level2.evt | modeM0/AS1A07_068T01_9000003760_26017cztM0_level2_quad_clean.evt |
| Size (bytes) | 616,150,080 | 96,886,080 |
| Size | 587.6 MB | 92.4 MB |
| Events in quadrant A | 3,978,520 | 642,749 |
| Events in quadrant B | 3,484,147 | 643,054 |
| Events in quadrant C | 3,343,931 | 615,154 |
| Events in quadrant D | 7,367,037 | 532,807 |
| Mode M0 | |||
|---|---|---|---|
| Quadrant | BADHDUFLAG | Total packets | Discarded packets |
| A | 0 | 16541 | 0 |
| B | 0 | 15011 | 0 |
| C | 0 | 14686 | 0 |
| D | 0 | 26795 | 0 |
| Mode M9 | |||
|---|---|---|---|
| Quadrant | BADHDUFLAG | Total packets | Discarded packets |
| A | 0 | 4 | 0 |
| B | 0 | 4 | 0 |
| C | 0 | 4 | 0 |
| D | 0 | 4 | 0 |
| Quadrant | Total seconds | Saturated seconds | Saturation percentage |
|---|---|---|---|
| A | 7178 | 66 | 0.919476% |
| B | 7178 | 29 | 0.404012% |
| C | 7178 | 51 | 0.710504% |
| D | 7178 | 1280 | 17.832265% |
Noise dominated data is calculated using 1-second bins in cleaned event files. If a bin has >2000 counts, and if more than 50% of those come from <1% of pixels, then it is considered to be noise-dominated and hence unusable.
| Quadrant | # 1 sec bins | Bins with >0 counts | Bins with >2000 counts | High rate bins dominated by noise | Noise dominated (total time) | Noise dominated (detector-on time) | Marked lightcurve |
|---|---|---|---|---|---|---|---|
| A | 7618 | 7179 | 45 | 45 | 0.59% | 0.63% | 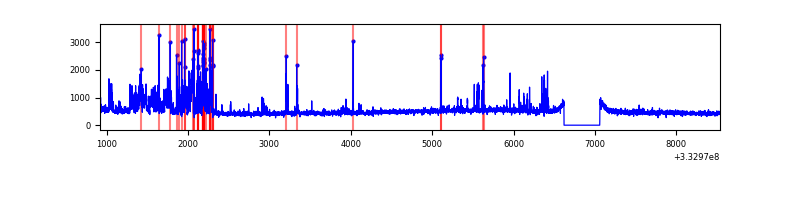 |
| B | 7618 | 7179 | 0 | 0 | 0.00% | 0.00% | 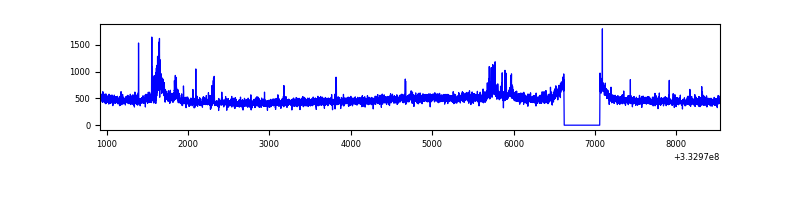 |
| C | 7618 | 7179 | 0 | 0 | 0.00% | 0.00% | 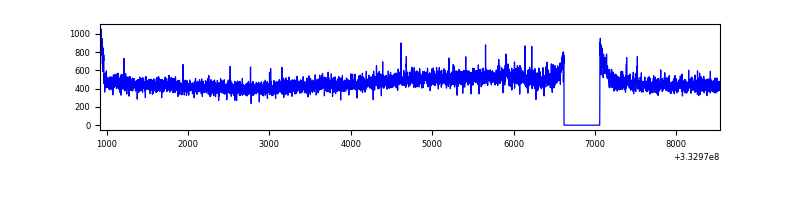 |
| D | 7618 | 7179 | 1189 | 1189 | 15.61% | 16.56% | 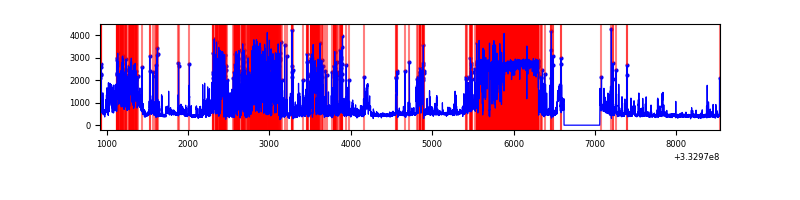 |
Top three noisy pixels from each quadrant. If the there are fewer than three noisy pixels in the level2.evt file, extra rows are filled as -1
| Pixel properties | Quadrant properties | ||||||
|---|---|---|---|---|---|---|---|
| Quadrant | DetID | PixID | Counts | Sigma | Mean | Median | Sigma |
| A | 0 | 13 | 670577 | 3867.35 | 858 | 841 | 173.2 |
| A | 13 | 254 | 11353 | 60.7 | 858 | 841 | 173.2 |
| A | 3 | 137 | 8094 | 41.88 | 858 | 841 | 173.2 |
| B | 10 | 245 | 88032 | 532.8 | 849 | 828 | 163.7 |
| B | 0 | 190 | 42065 | 251.95 | 849 | 828 | 163.7 |
| B | 12 | 111 | 20425 | 119.73 | 849 | 828 | 163.7 |
| C | 14 | 238 | 129079 | 676.15 | 812 | 817 | 189.7 |
| C | 14 | 225 | 18181 | 91.54 | 812 | 817 | 189.7 |
| C | 3 | 233 | 18175 | 91.51 | 812 | 817 | 189.7 |
| D | 1 | 52 | 2737106 | 14538.47 | 737 | 715 | 188.2 |
| D | 12 | 2 | 1745535 | 9270.25 | 737 | 715 | 188.2 |
| D | 12 | 233 | 49841 | 261.01 | 737 | 715 | 188.2 |
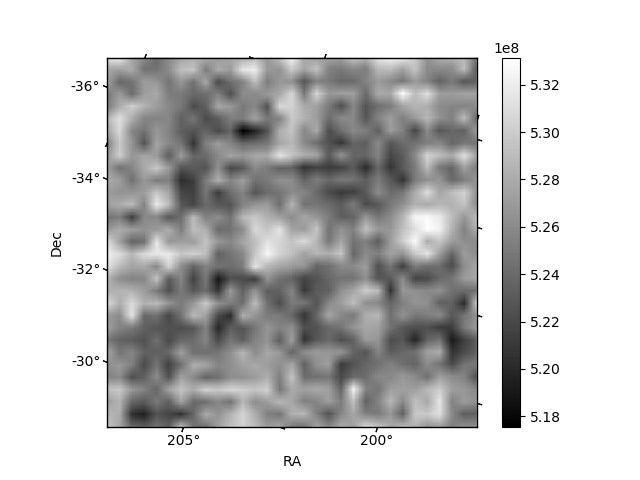
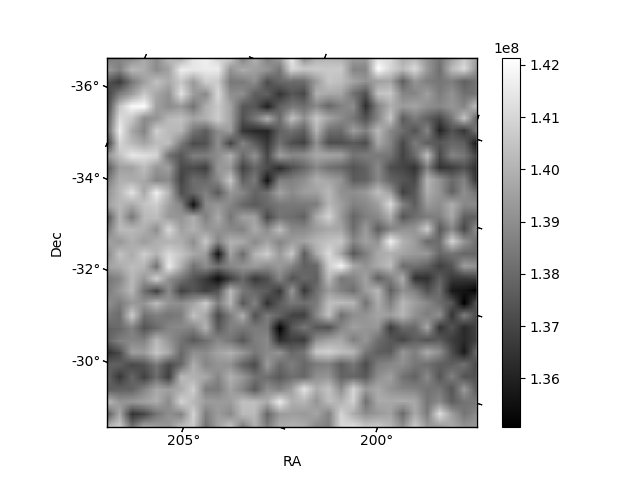
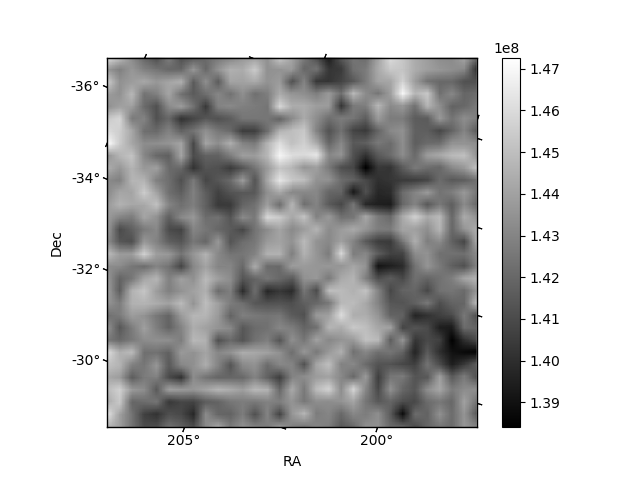
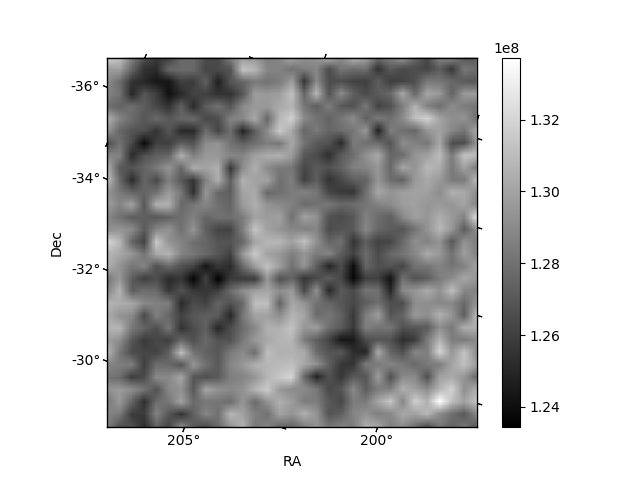
Histogram calculated using DETX and DETY for each event in the final _common_clean file
| Quadrant A | 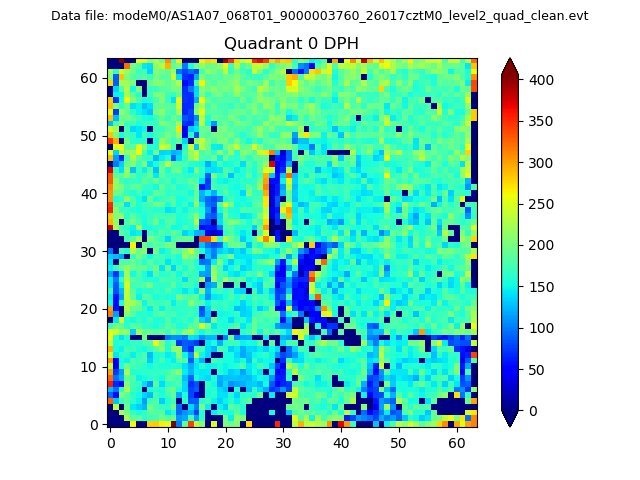 |
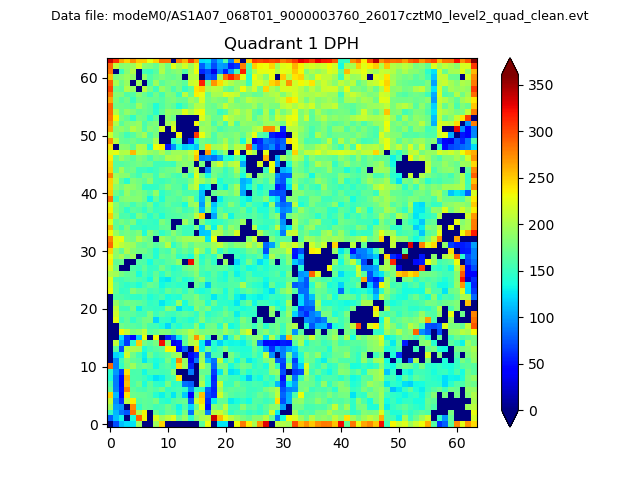 |
Quadrant B |
|---|---|---|---|
| Quadrant D | 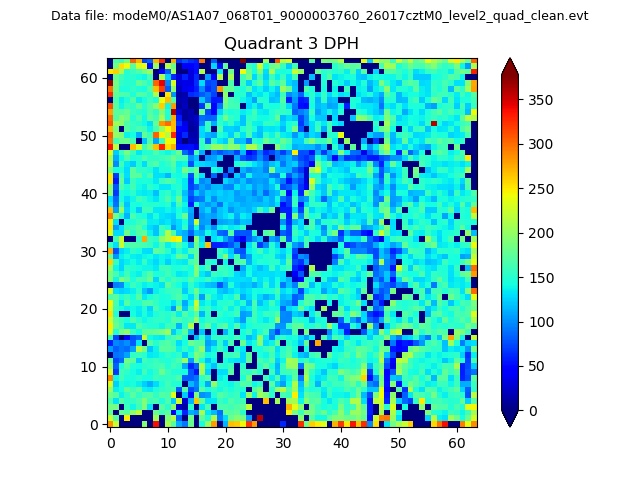 |
 |
Quadrant C |
| Plot type | Count rate plots | Images |
|---|---|---|
| Comparison with Poisson distribution Blue bars denote a histogram of data divided into 1 sec bins. Red curve is a Poisson curve with rate = median count rate of data. |
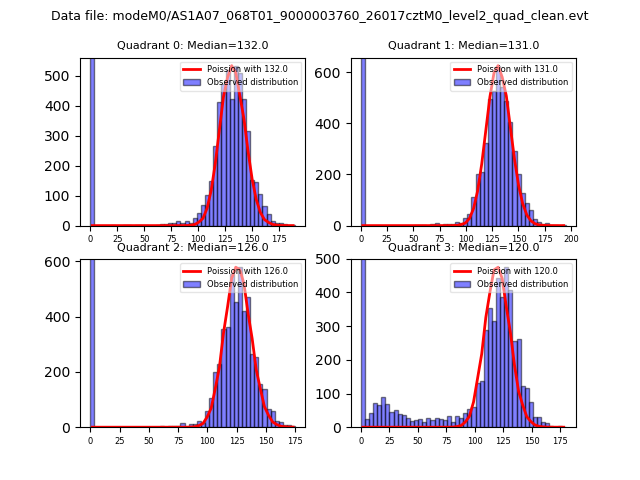 |
 |
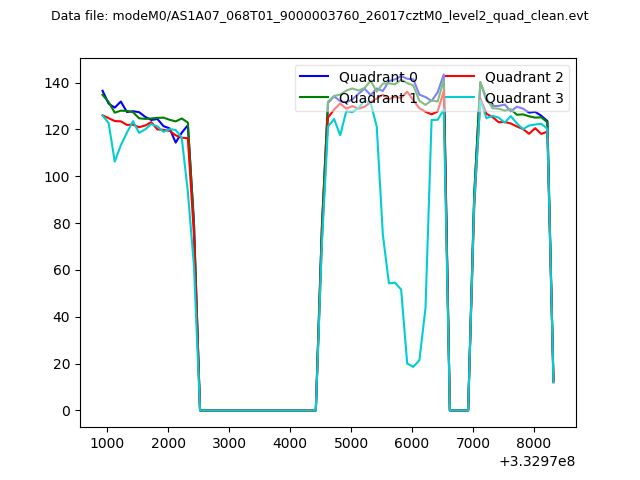
| Quadrant-wise count rates Data is divided into 100 sec bins |
 |
|
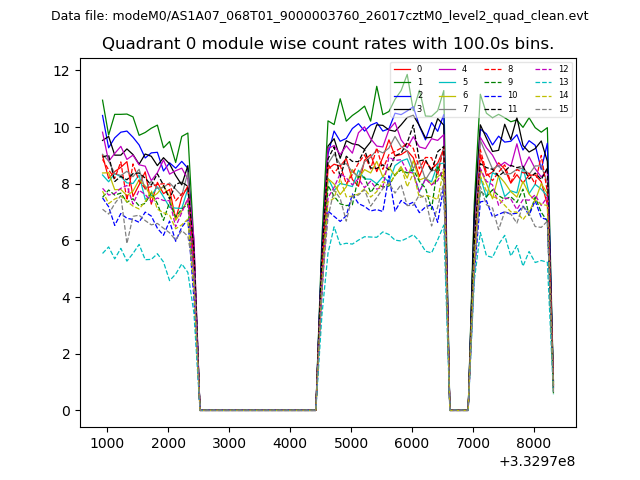
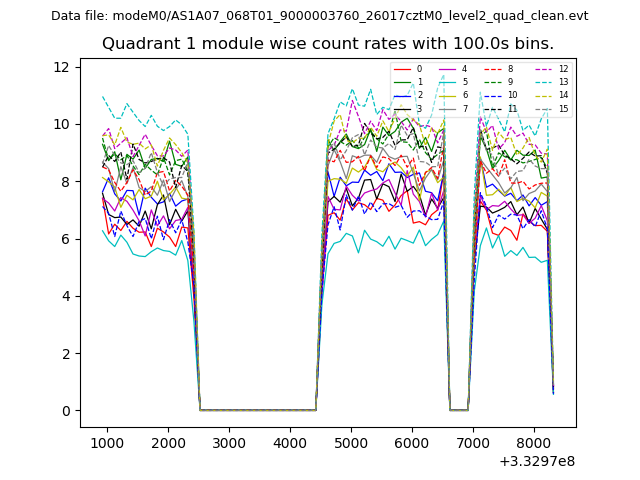
| Module-wise count rates for Quadrant A Data is divided into 100 sec bins |
 |
 |
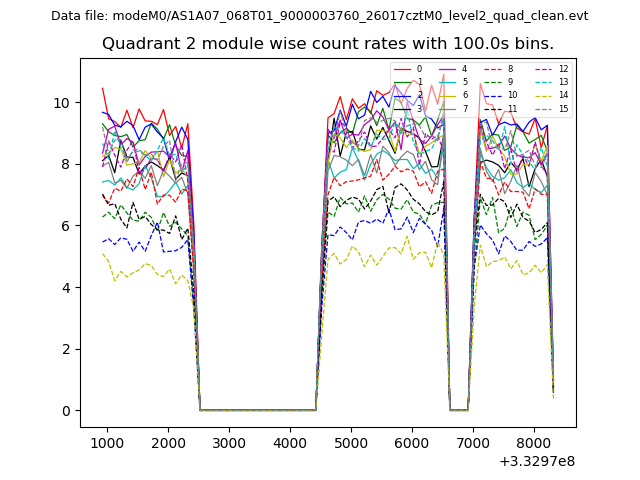
| Module-wise count rates for Quadrant B Data is divided into 100 sec bins |
 |
 |
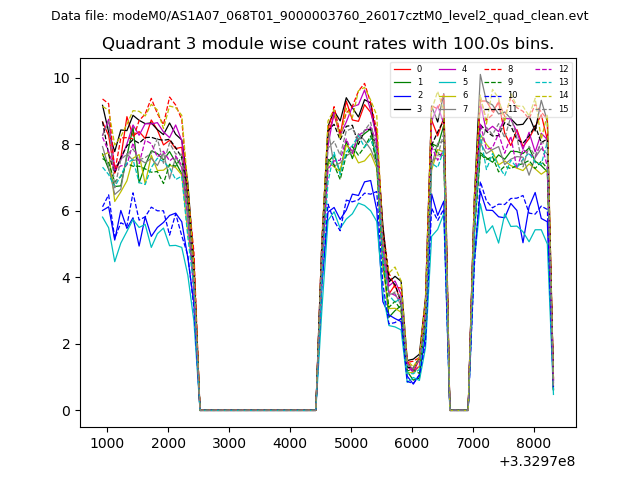
| Module-wise count rates for Quadrant C Data is divided into 100 sec bins |
 |
 |
| Module-wise count rates for Quadrant D Data is divided into 100 sec bins |
 |
 |
| Parameter | Plot |
|---|---|
| CZT HV Monitor |  |
| D_VDD | 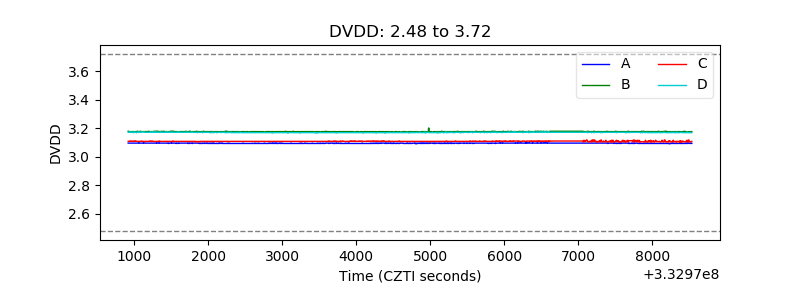 |
| Temperature 1 | 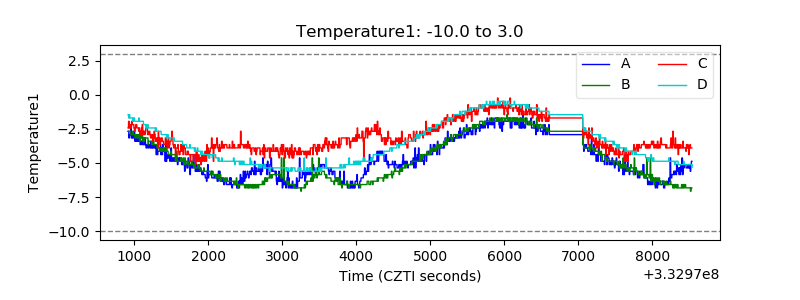 |
| Veto HV Monitor | 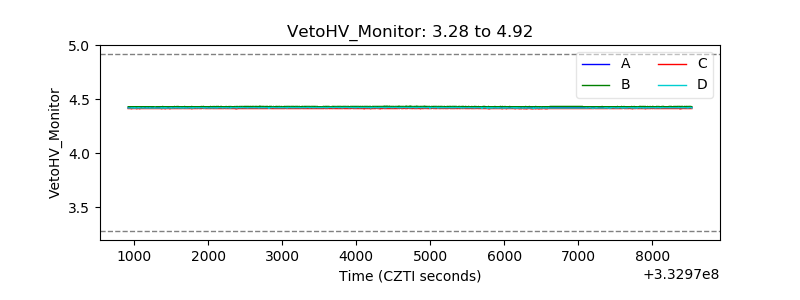 |
| Veto LLD |  |
| Alpha Counter | 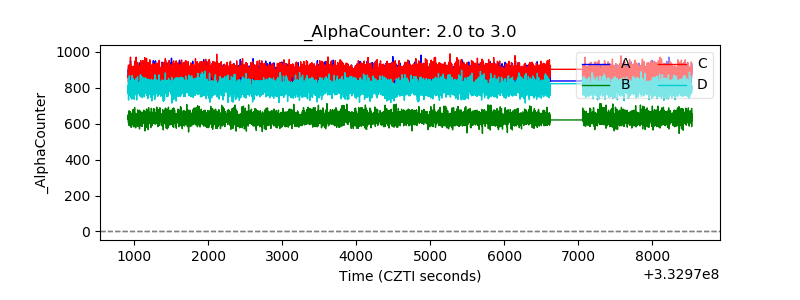 |
| _CPM_Rate | 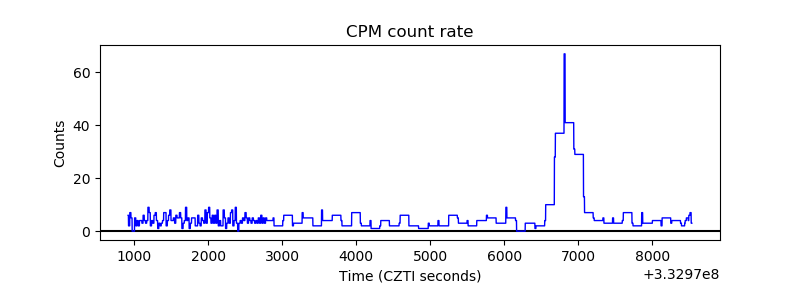 |
| CZT Counter |  |
| +2.5 Volts monitor |  |
| +5 Volts monitor | 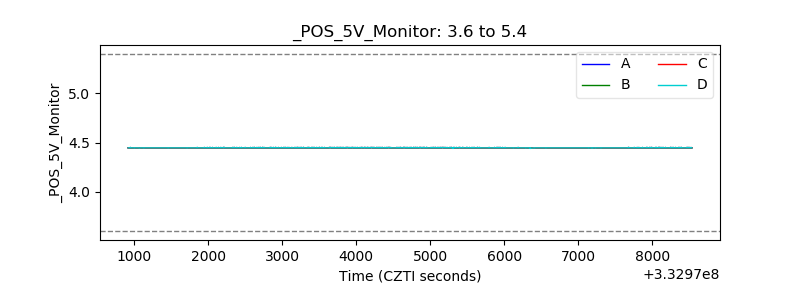 |
| _ROLL_ROT | 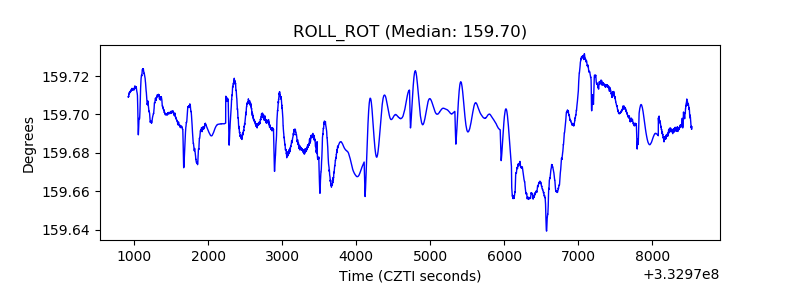 |
| _Roll_DEC | 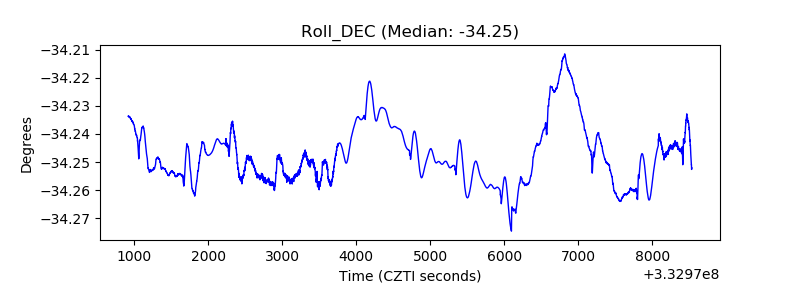 |
| _Roll_RA | 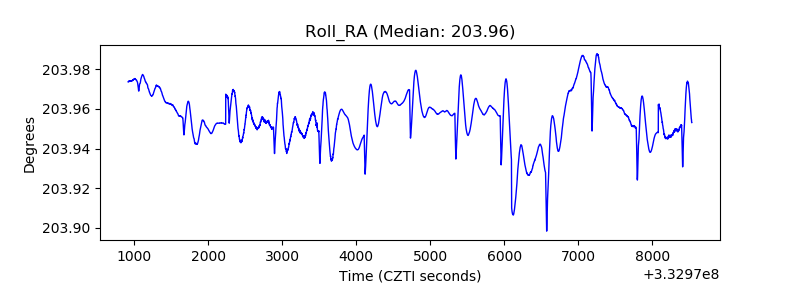 |
| Veto Counter | 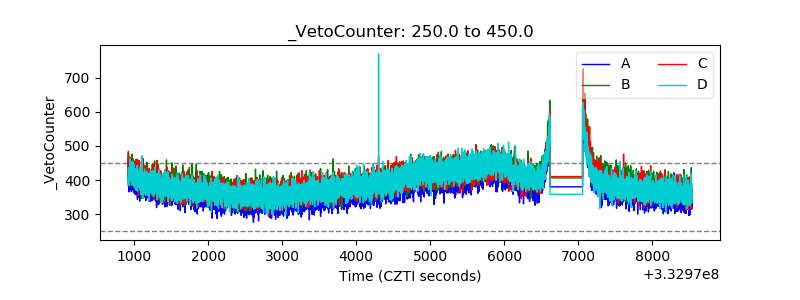 |