| Param | Original file | Final file |
|---|---|---|
| Filename | modeM0/AS1A07_068T01_9000003760_26019cztM0_level2.evt | modeM0/AS1A07_068T01_9000003760_26019cztM0_level2_quad_clean.evt |
| Size (bytes) | 927,123,840 | 154,321,920 |
| Size | 884.2 MB | 147.2 MB |
| Events in quadrant A | 6,122,050 | 986,005 |
| Events in quadrant B | 6,145,099 | 982,704 |
| Events in quadrant C | 5,968,924 | 941,629 |
| Events in quadrant D | 8,978,196 | 881,023 |
| Mode M0 | |||
|---|---|---|---|
| Quadrant | BADHDUFLAG | Total packets | Discarded packets |
| A | 0 | 26448 | 0 |
| B | 0 | 26468 | 0 |
| C | 0 | 25927 | 0 |
| D | 0 | 35331 | 0 |
| Mode M9 | |||
|---|---|---|---|
| Quadrant | BADHDUFLAG | Total packets | Discarded packets |
| A | 0 | 15 | 0 |
| B | 0 | 16 | 0 |
| C | 0 | 16 | 0 |
| D | 0 | 16 | 0 |
| Quadrant | Total seconds | Saturated seconds | Saturation percentage |
|---|---|---|---|
| A | 12766 | 69 | 0.540498% |
| B | 12766 | 81 | 0.634498% |
| C | 12766 | 97 | 0.759831% |
| D | 12766 | 896 | 7.018643% |
Noise dominated data is calculated using 1-second bins in cleaned event files. If a bin has >2000 counts, and if more than 50% of those come from <1% of pixels, then it is considered to be noise-dominated and hence unusable.
| Quadrant | # 1 sec bins | Bins with >0 counts | Bins with >2000 counts | High rate bins dominated by noise | Noise dominated (total time) | Noise dominated (detector-on time) | Marked lightcurve |
|---|---|---|---|---|---|---|---|
| A | 14151 | 12768 | 11 | 11 | 0.08% | 0.09% | 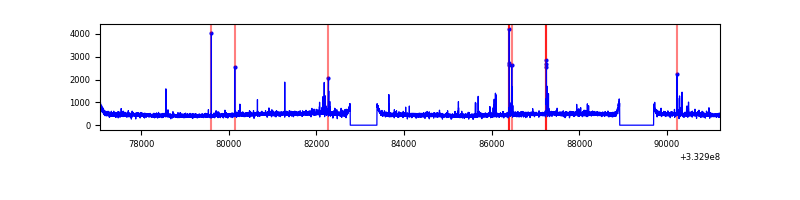 |
| B | 14151 | 12768 | 6 | 6 | 0.04% | 0.05% | 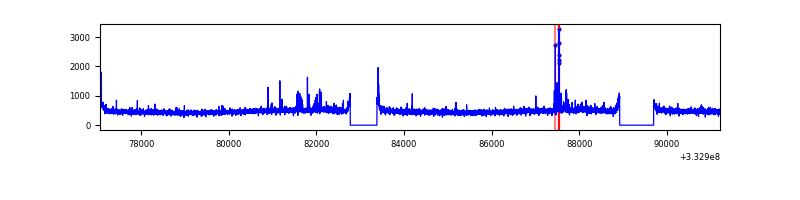 |
| C | 14151 | 12768 | 0 | 0 | 0.00% | 0.00% | 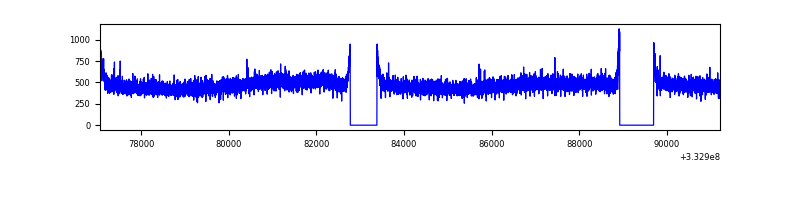 |
| D | 14151 | 12766 | 668 | 668 | 4.72% | 5.23% | 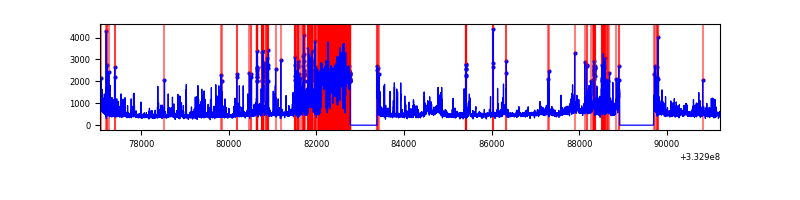 |
Top three noisy pixels from each quadrant. If the there are fewer than three noisy pixels in the level2.evt file, extra rows are filled as -1
| Pixel properties | Quadrant properties | ||||||
|---|---|---|---|---|---|---|---|
| Quadrant | DetID | PixID | Counts | Sigma | Mean | Median | Sigma |
| A | 0 | 13 | 180854 | 581.56 | 1541 | 1510 | 308.4 |
| A | 13 | 254 | 19291 | 57.66 | 1541 | 1510 | 308.4 |
| A | 3 | 137 | 14763 | 42.98 | 1541 | 1510 | 308.4 |
| B | 0 | 190 | 60617 | 202.68 | 1522 | 1483 | 291.8 |
| B | 10 | 245 | 47897 | 159.08 | 1522 | 1483 | 291.8 |
| B | 0 | 229 | 37268 | 122.65 | 1522 | 1483 | 291.8 |
| C | 14 | 238 | 233706 | 679.58 | 1459 | 1467 | 341.7 |
| C | 3 | 233 | 31159 | 86.88 | 1459 | 1467 | 341.7 |
| C | 8 | 128 | 13901 | 36.38 | 1459 | 1467 | 341.7 |
| D | 1 | 52 | 1639872 | 4739.28 | 1423 | 1385 | 345.7 |
| D | 12 | 2 | 1425864 | 4120.27 | 1423 | 1385 | 345.7 |
| D | 7 | 223 | 358280 | 1032.31 | 1423 | 1385 | 345.7 |
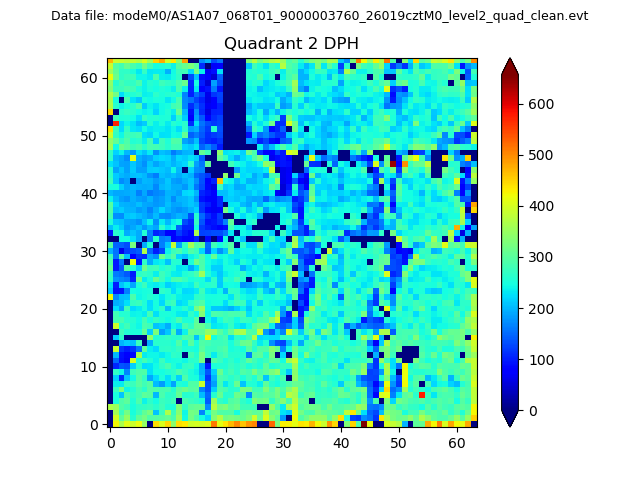
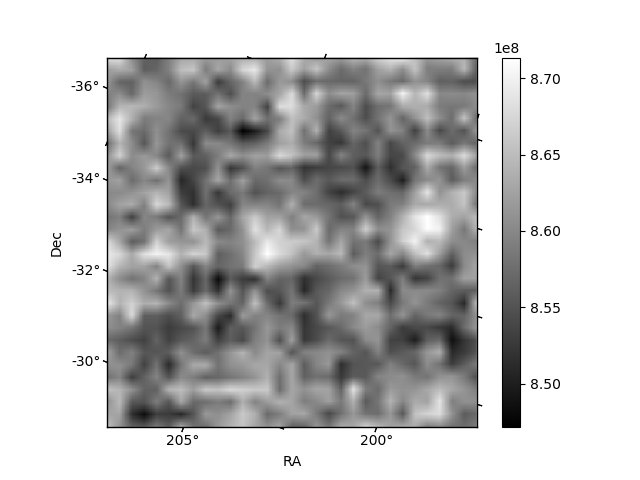
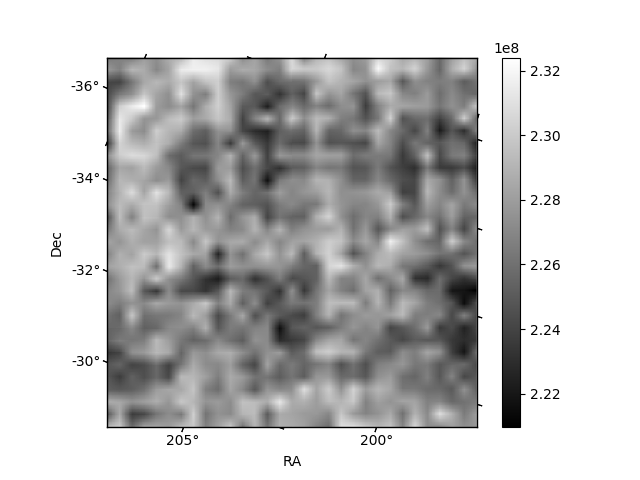
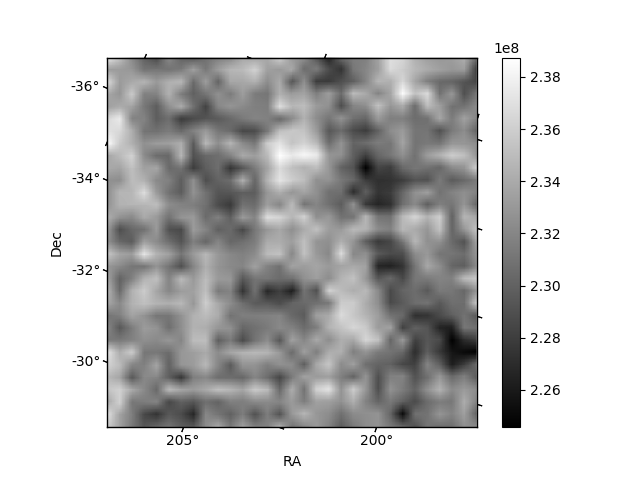
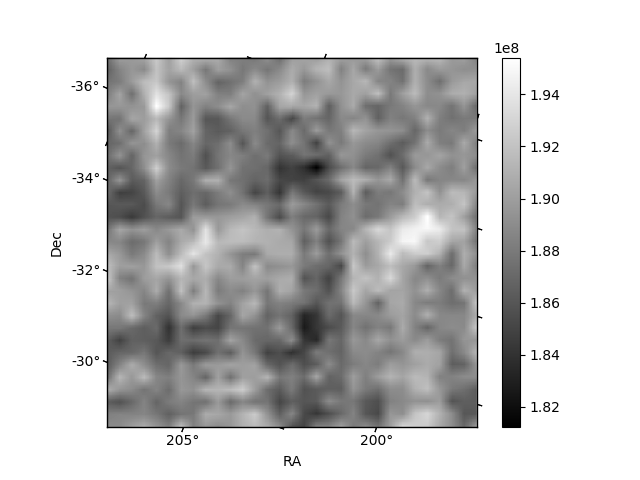
Histogram calculated using DETX and DETY for each event in the final _common_clean file
| Quadrant A | 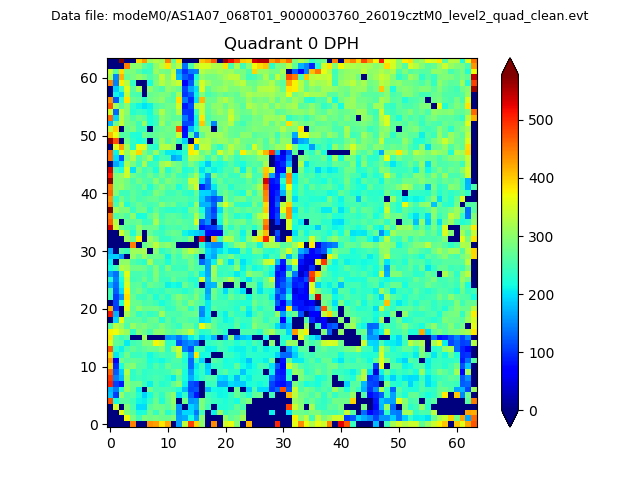 |
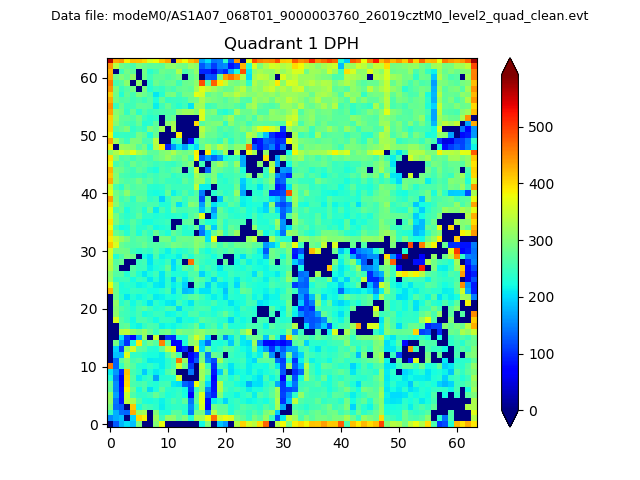 |
Quadrant B |
|---|---|---|---|
| Quadrant D | 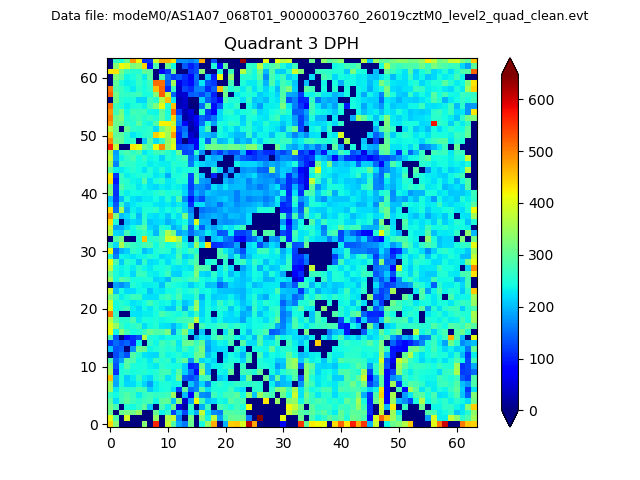 |
 |
Quadrant C |
| Plot type | Count rate plots | Images |
|---|---|---|
| Comparison with Poisson distribution Blue bars denote a histogram of data divided into 1 sec bins. Red curve is a Poisson curve with rate = median count rate of data. |
 |
 |
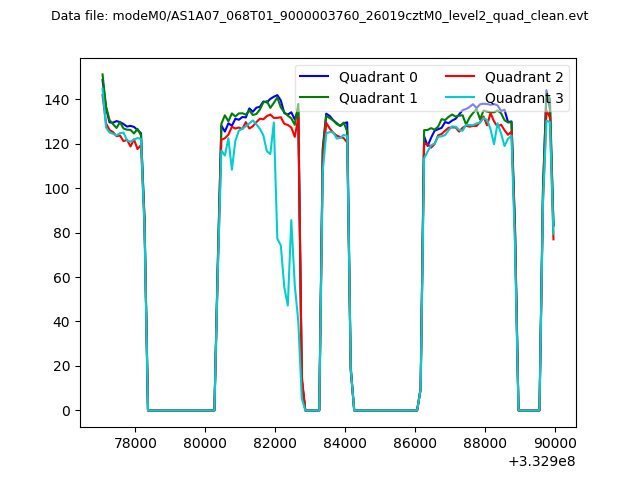
| Quadrant-wise count rates Data is divided into 100 sec bins |
 |
|
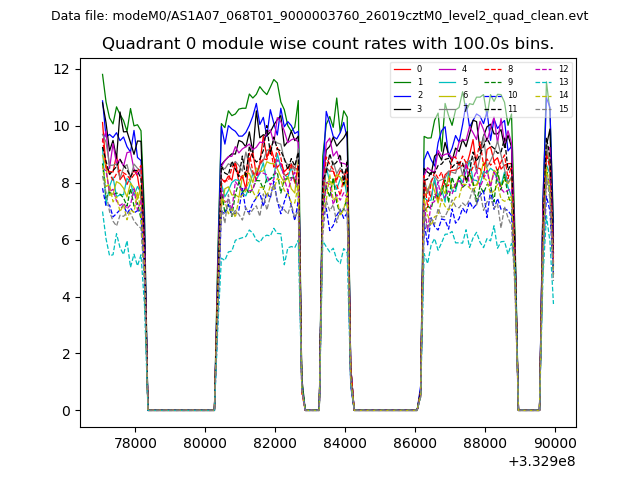
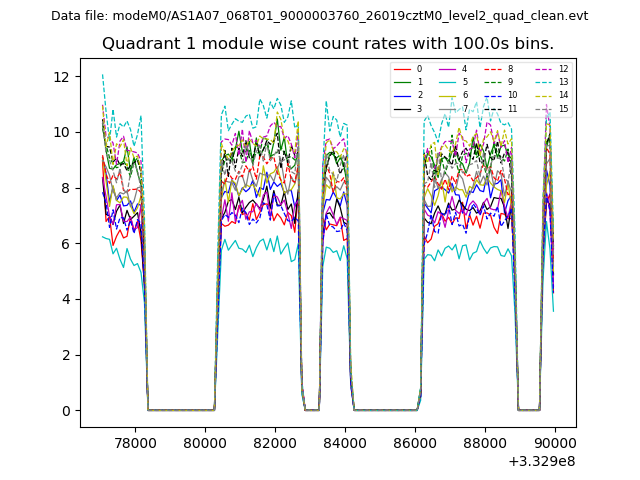
| Module-wise count rates for Quadrant A Data is divided into 100 sec bins |
 |
 |
| Module-wise count rates for Quadrant B Data is divided into 100 sec bins |
 |
 |
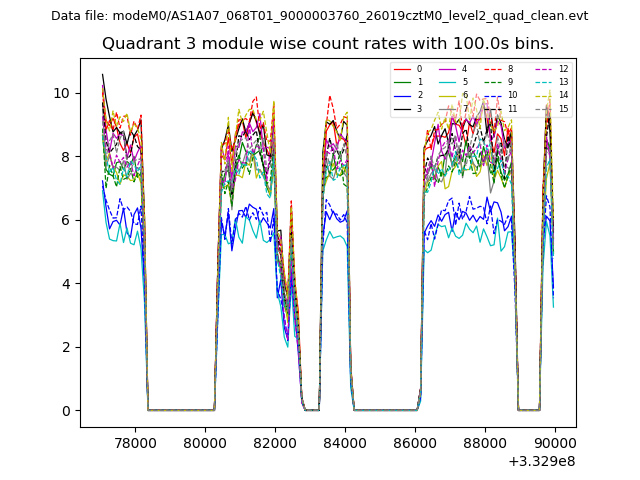
| Module-wise count rates for Quadrant C Data is divided into 100 sec bins |
 |
 |
| Module-wise count rates for Quadrant D Data is divided into 100 sec bins |
 |
 |
| Parameter | Plot |
|---|---|
| CZT HV Monitor | 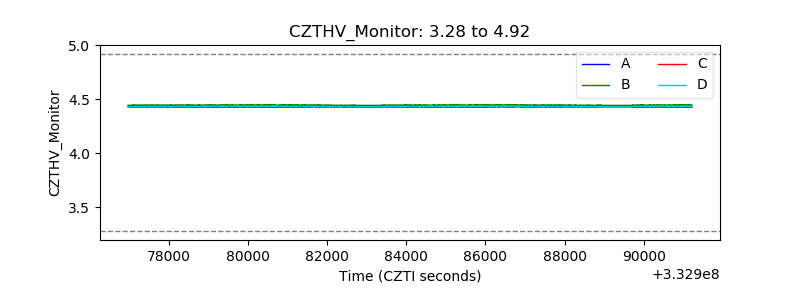 |
| D_VDD | 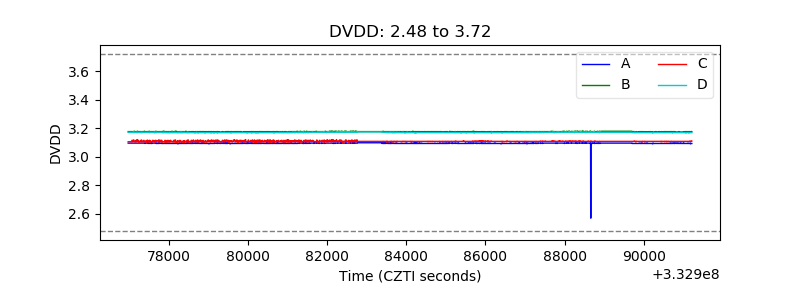 |
| Temperature 1 | 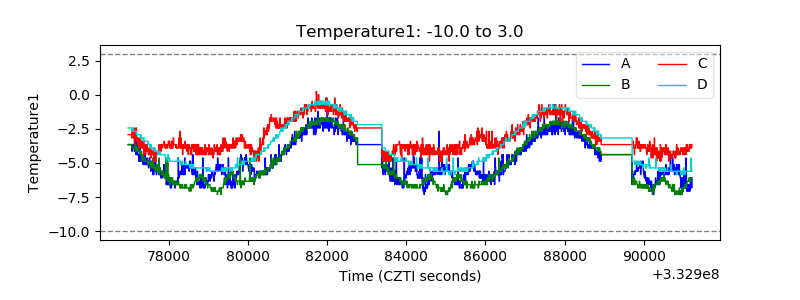 |
| Veto HV Monitor |  |
| Veto LLD | 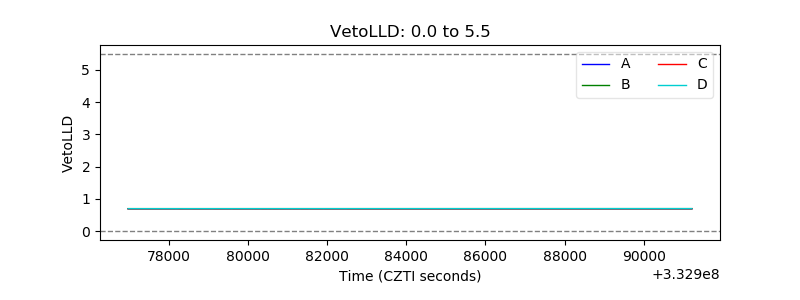 |
| Alpha Counter | 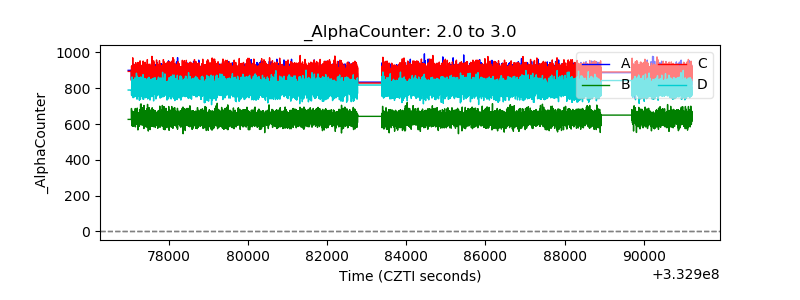 |
| _CPM_Rate |  |
| CZT Counter | 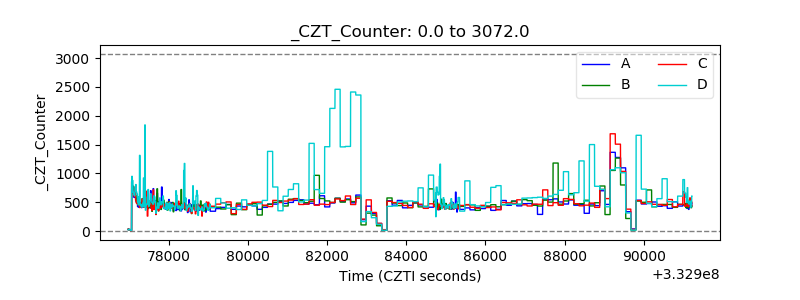 |
| +2.5 Volts monitor |  |
| +5 Volts monitor |  |
| _ROLL_ROT | 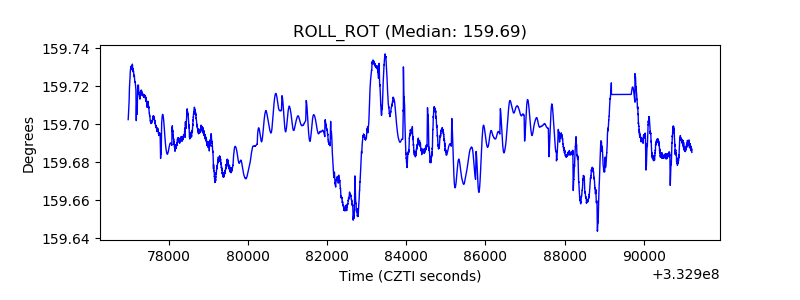 |
| _Roll_DEC | 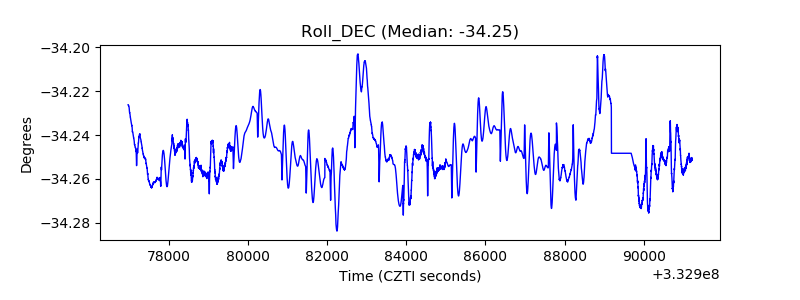 |
| _Roll_RA | 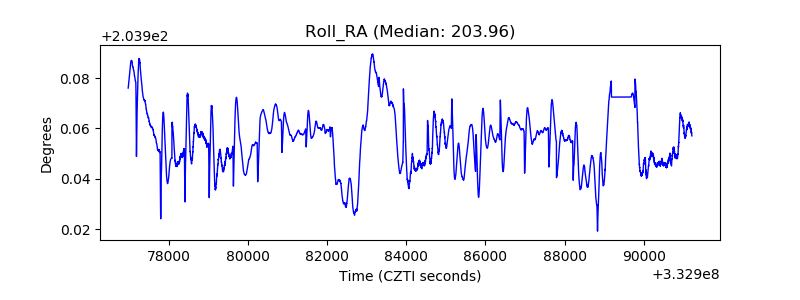 |
| Veto Counter | 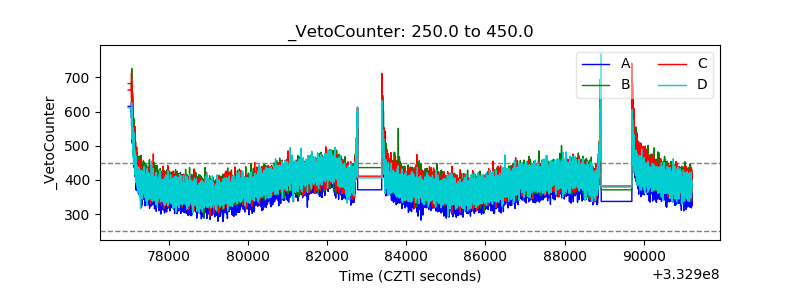 |