| Param | Original file | Final file |
|---|---|---|
| Filename | modeM0/AS1A07_068T01_9000003760_26020cztM0_level2.evt | modeM0/AS1A07_068T01_9000003760_26020cztM0_level2_quad_clean.evt |
| Size (bytes) | 510,923,520 | 65,525,760 |
| Size | 487.3 MB | 62.5 MB |
| Events in quadrant A | 3,205,677 | 395,281 |
| Events in quadrant B | 3,184,508 | 396,241 |
| Events in quadrant C | 3,062,171 | 379,798 |
| Events in quadrant D | 5,582,815 | 362,031 |
| Mode M0 | |||
|---|---|---|---|
| Quadrant | BADHDUFLAG | Total packets | Discarded packets |
| A | 0 | 13527 | 0 |
| B | 0 | 13443 | 0 |
| C | 0 | 13143 | 0 |
| D | 0 | 20781 | 0 |
| Mode M9 | |||
|---|---|---|---|
| Quadrant | BADHDUFLAG | Total packets | Discarded packets |
| A | 0 | 9 | 0 |
| B | 0 | 9 | 0 |
| C | 0 | 9 | 0 |
| D | 0 | 9 | 0 |
| Quadrant | Total seconds | Saturated seconds | Saturation percentage |
|---|---|---|---|
| A | 6453 | 61 | 0.945297% |
| B | 6453 | 60 | 0.929800% |
| C | 6453 | 81 | 1.255230% |
| D | 6454 | 637 | 9.869848% |
Noise dominated data is calculated using 1-second bins in cleaned event files. If a bin has >2000 counts, and if more than 50% of those come from <1% of pixels, then it is considered to be noise-dominated and hence unusable.
| Quadrant | # 1 sec bins | Bins with >0 counts | Bins with >2000 counts | High rate bins dominated by noise | Noise dominated (total time) | Noise dominated (detector-on time) | Marked lightcurve |
|---|---|---|---|---|---|---|---|
| A | 7368 | 6453 | 15 | 15 | 0.20% | 0.23% | 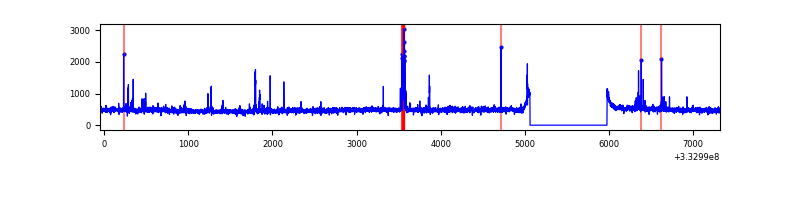 |
| B | 7368 | 6453 | 1 | 1 | 0.01% | 0.02% | 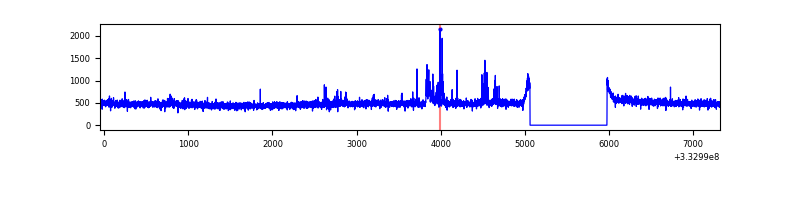 |
| C | 7368 | 6453 | 0 | 0 | 0.00% | 0.00% | 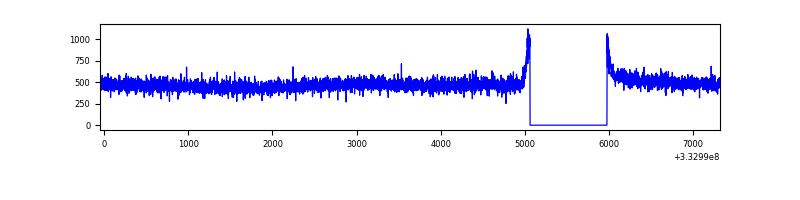 |
| D | 7369 | 6454 | 556 | 556 | 7.55% | 8.61% | 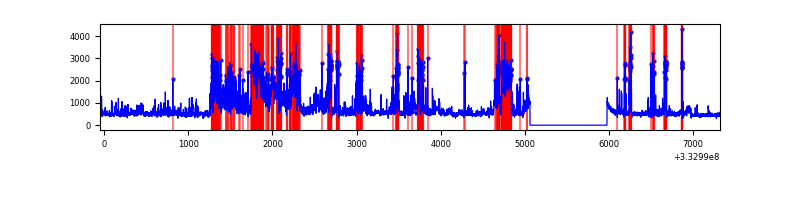 |
Top three noisy pixels from each quadrant. If the there are fewer than three noisy pixels in the level2.evt file, extra rows are filled as -1
| Pixel properties | Quadrant properties | ||||||
|---|---|---|---|---|---|---|---|
| Quadrant | DetID | PixID | Counts | Sigma | Mean | Median | Sigma |
| A | 0 | 13 | 146101 | 909.95 | 791 | 773 | 159.7 |
| A | 13 | 254 | 9741 | 56.15 | 791 | 773 | 159.7 |
| A | 6 | 16 | 8615 | 49.1 | 791 | 773 | 159.7 |
| B | 15 | 222 | 77495 | 508.39 | 784 | 765 | 150.9 |
| B | 12 | 111 | 18622 | 118.31 | 784 | 765 | 150.9 |
| B | 11 | 111 | 16702 | 105.59 | 784 | 765 | 150.9 |
| C | 14 | 238 | 123033 | 694.48 | 753 | 757 | 176.1 |
| C | 3 | 233 | 6824 | 34.46 | 753 | 757 | 176.1 |
| C | 13 | 61 | 5134 | 24.86 | 753 | 757 | 176.1 |
| D | 1 | 52 | 1110959 | 6286.08 | 735 | 719 | 176.6 |
| D | 12 | 2 | 852198 | 4821.0 | 735 | 719 | 176.6 |
| D | 7 | 223 | 685023 | 3874.47 | 735 | 719 | 176.6 |
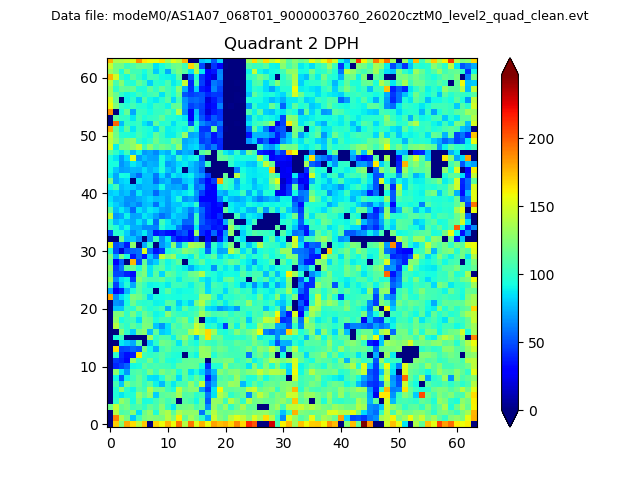
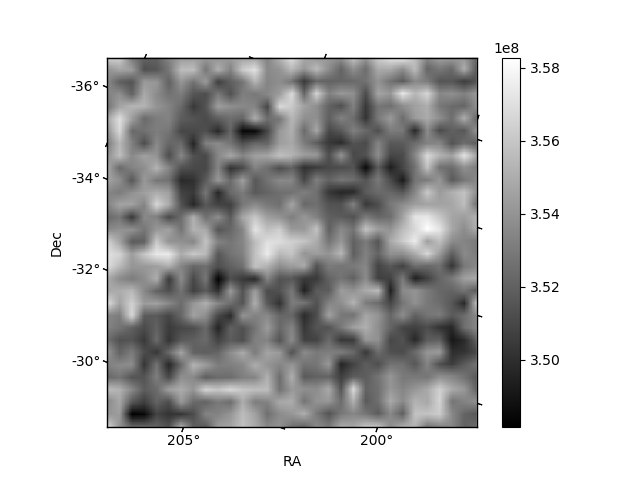
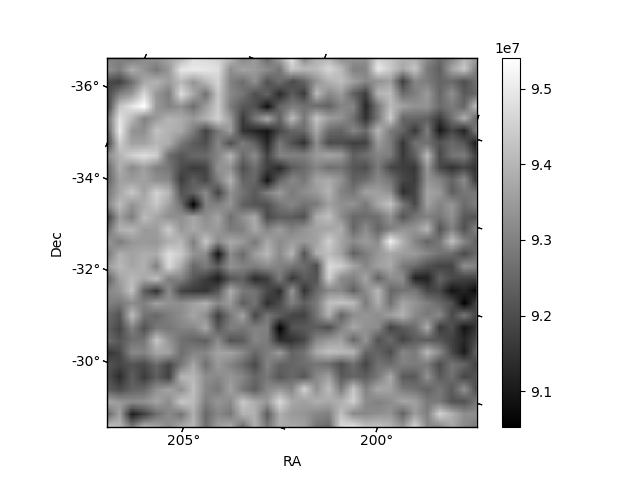
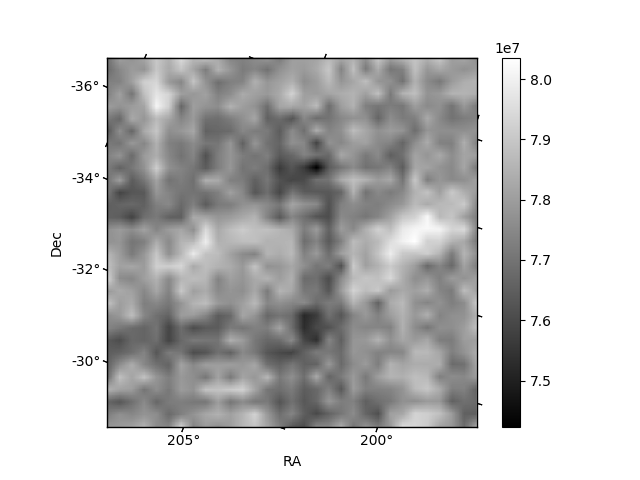
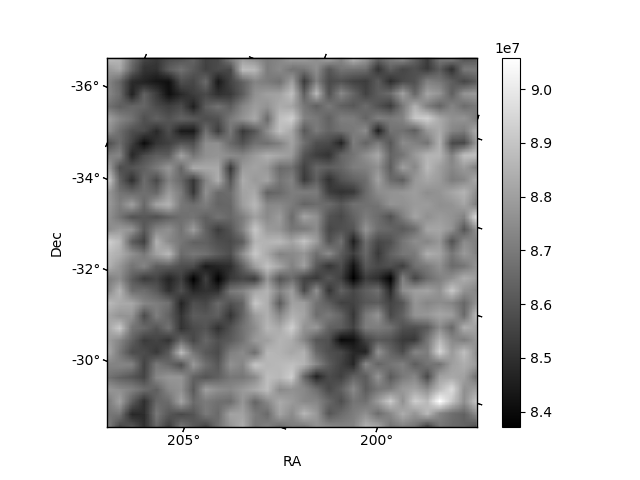
Histogram calculated using DETX and DETY for each event in the final _common_clean file
| Quadrant A | 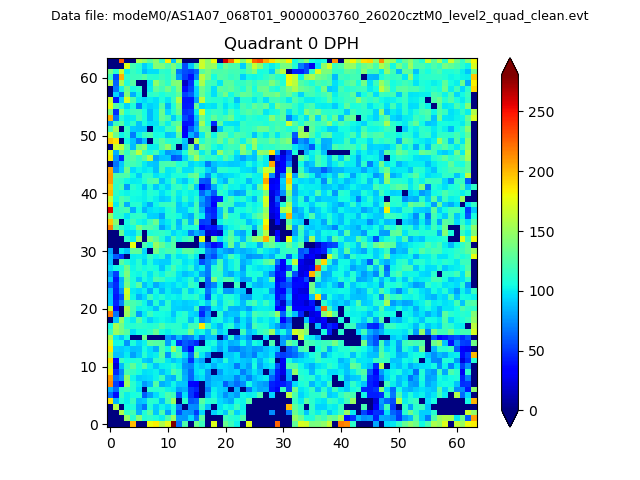 |
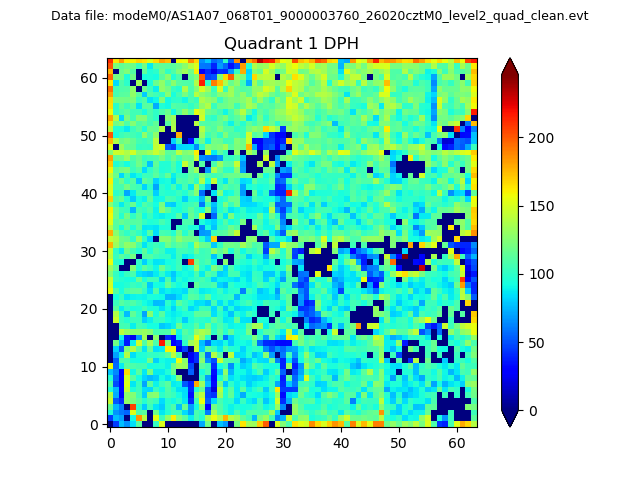 |
Quadrant B |
|---|---|---|---|
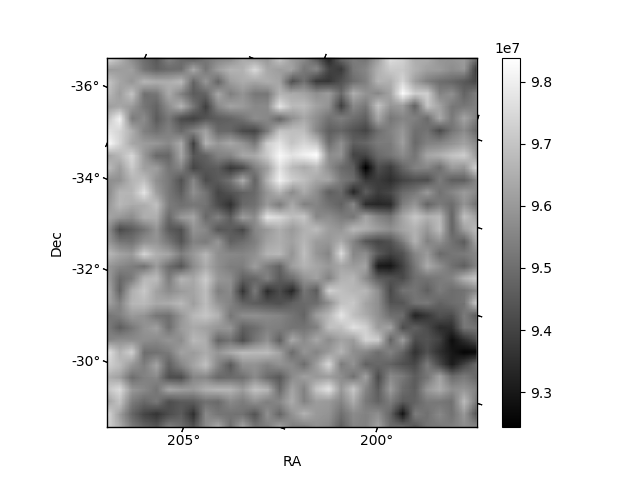
| Quadrant D | 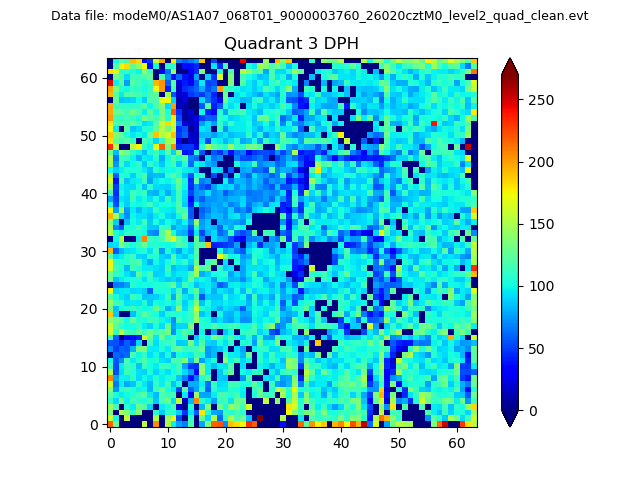 |
 |
Quadrant C |
| Plot type | Count rate plots | Images |
|---|---|---|
| Comparison with Poisson distribution Blue bars denote a histogram of data divided into 1 sec bins. Red curve is a Poisson curve with rate = median count rate of data. |
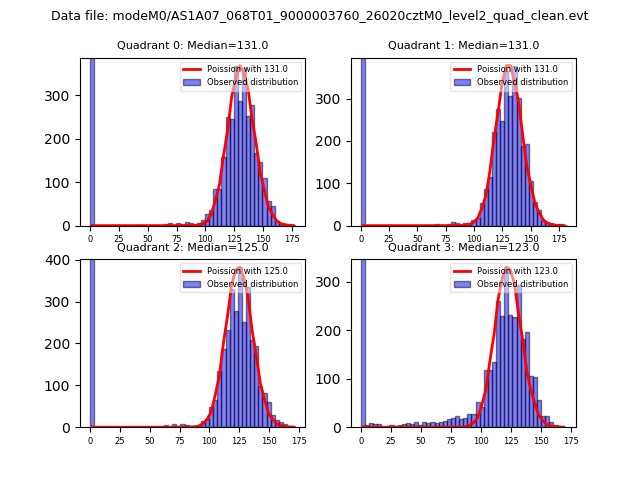 |
 |
| Quadrant-wise count rates Data is divided into 100 sec bins |
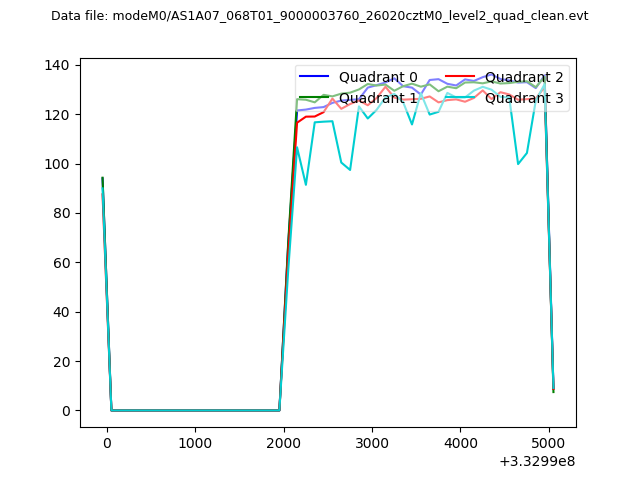 |
|
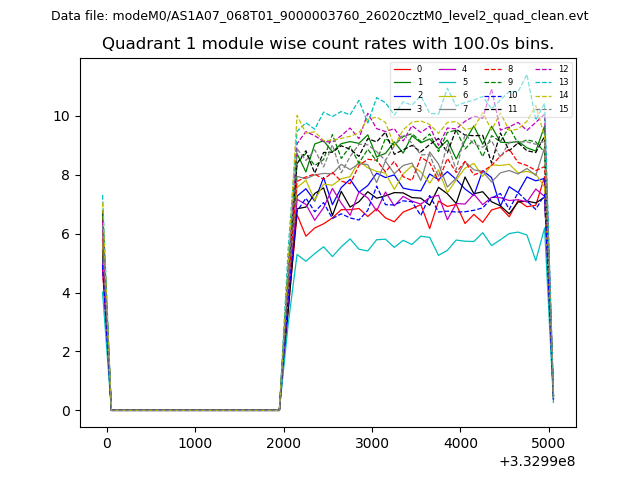
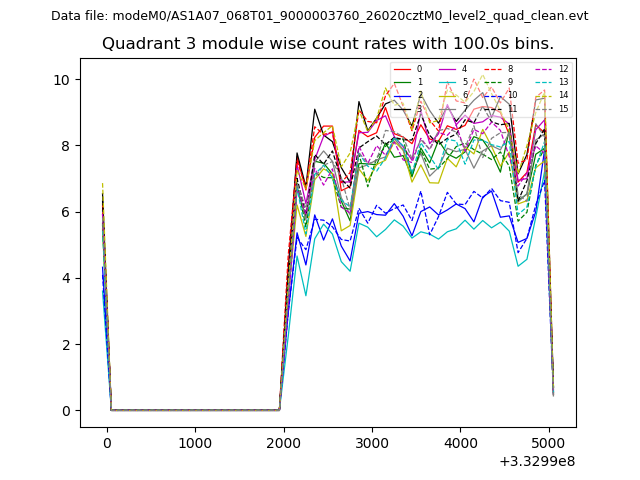
| Module-wise count rates for Quadrant A Data is divided into 100 sec bins |
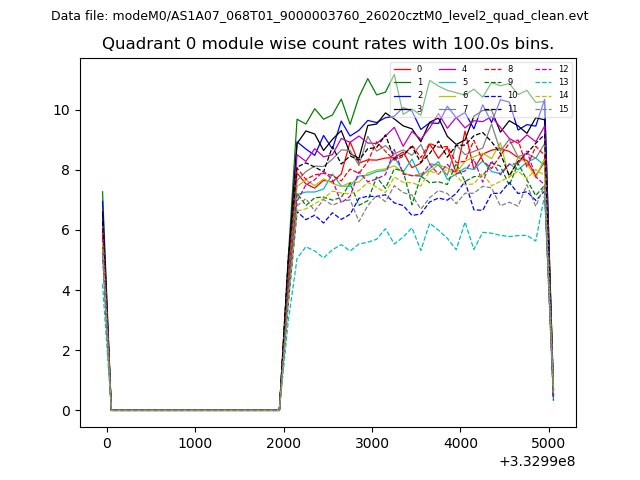 |
 |
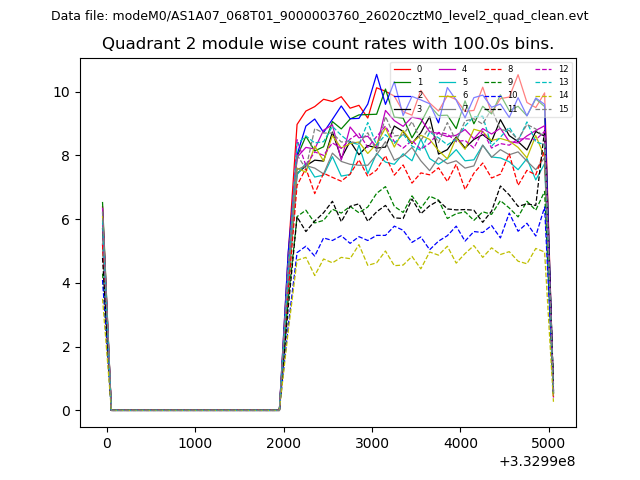
| Module-wise count rates for Quadrant B Data is divided into 100 sec bins |
 |
 |
| Module-wise count rates for Quadrant C Data is divided into 100 sec bins |
 |
 |
| Module-wise count rates for Quadrant D Data is divided into 100 sec bins |
 |
 |
| Parameter | Plot |
|---|---|
| CZT HV Monitor | 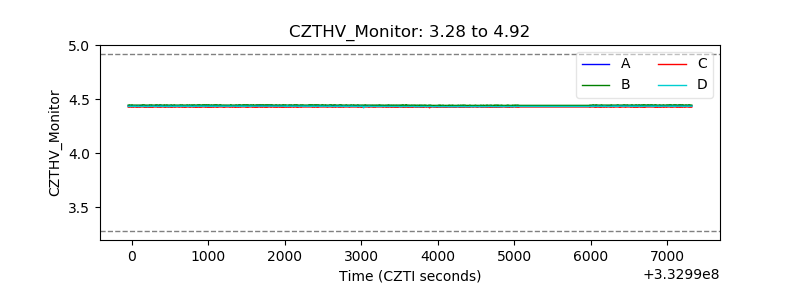 |
| D_VDD | 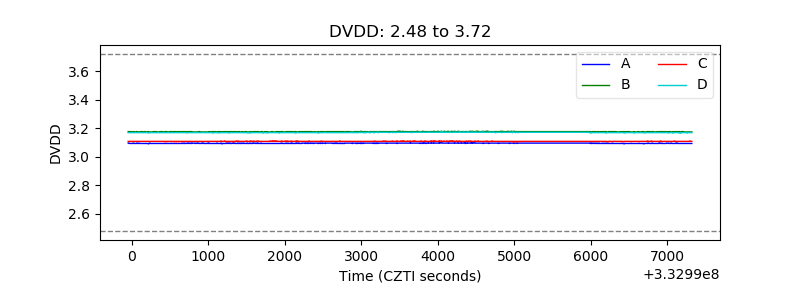 |
| Temperature 1 | 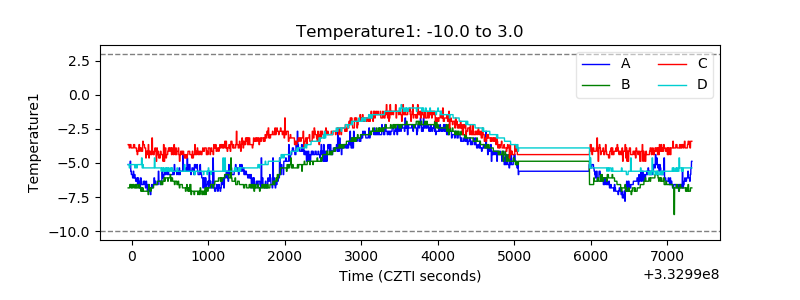 |
| Veto HV Monitor | 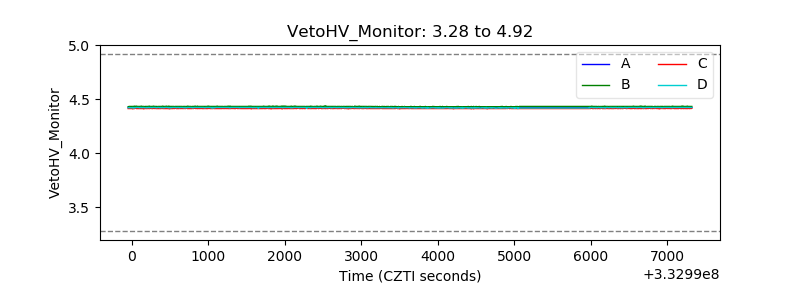 |
| Veto LLD | 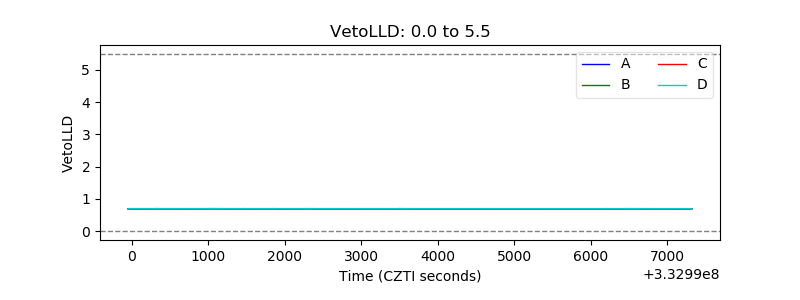 |
| Alpha Counter | 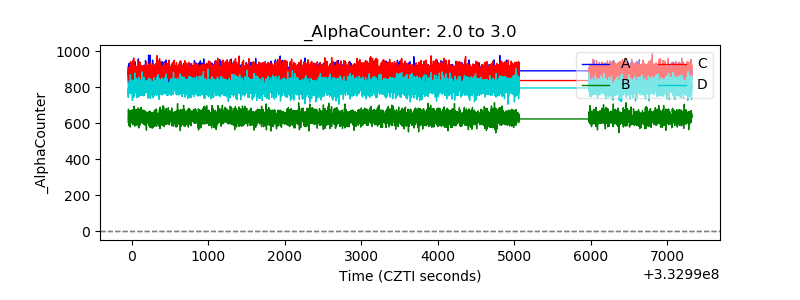 |
| _CPM_Rate | 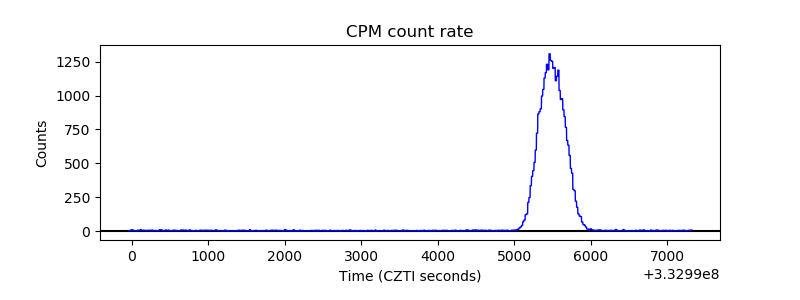 |
| CZT Counter | 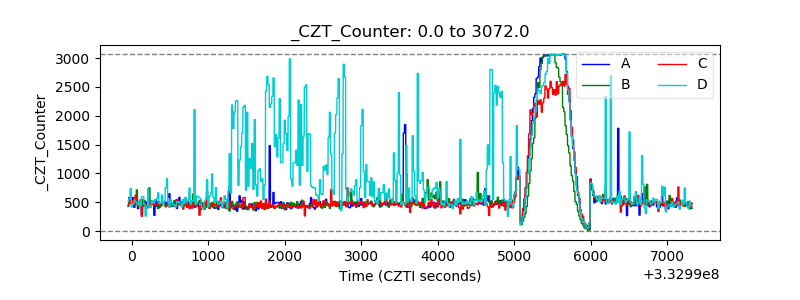 |
| +2.5 Volts monitor |  |
| +5 Volts monitor |  |
| _ROLL_ROT | 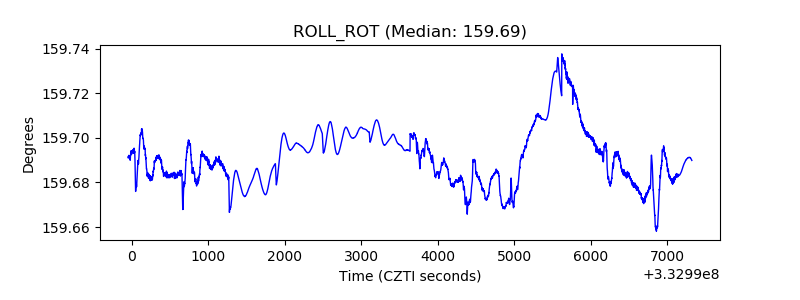 |
| _Roll_DEC | 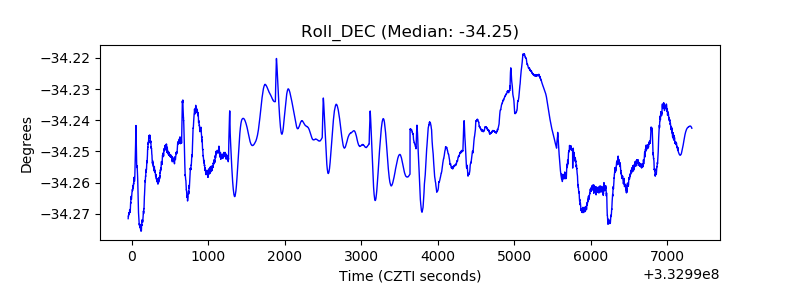 |
| _Roll_RA | 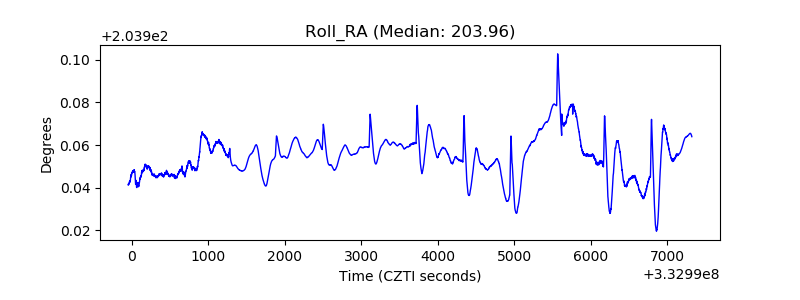 |
| Veto Counter | 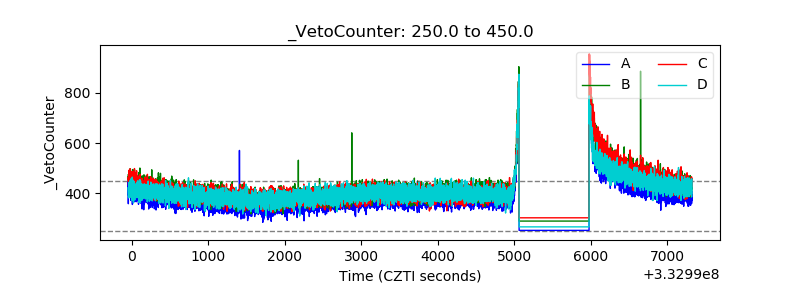 |