| Param | Original file | Final file |
|---|---|---|
| Filename | modeM0/AS1A07_068T01_9000003760_26021cztM0_level2.evt | modeM0/AS1A07_068T01_9000003760_26021cztM0_level2_quad_clean.evt |
| Size (bytes) | 496,944,000 | 70,873,920 |
| Size | 473.9 MB | 67.6 MB |
| Events in quadrant A | 3,553,617 | 428,518 |
| Events in quadrant B | 3,374,903 | 432,124 |
| Events in quadrant C | 3,274,656 | 412,918 |
| Events in quadrant D | 4,398,501 | 411,655 |
| Mode M0 | |||
|---|---|---|---|
| Quadrant | BADHDUFLAG | Total packets | Discarded packets |
| A | 0 | 14563 | 0 |
| B | 0 | 14052 | 0 |
| C | 0 | 13738 | 0 |
| D | 0 | 17463 | 0 |
| Mode M9 | |||
|---|---|---|---|
| Quadrant | BADHDUFLAG | Total packets | Discarded packets |
| A | 0 | 11 | 0 |
| B | 0 | 11 | 0 |
| C | 0 | 11 | 0 |
| D | 0 | 11 | 0 |
| Quadrant | Total seconds | Saturated seconds | Saturation percentage |
|---|---|---|---|
| A | 6606 | 71 | 1.074781% |
| B | 6607 | 59 | 0.892992% |
| C | 6607 | 92 | 1.392463% |
| D | 6607 | 146 | 2.209778% |
Noise dominated data is calculated using 1-second bins in cleaned event files. If a bin has >2000 counts, and if more than 50% of those come from <1% of pixels, then it is considered to be noise-dominated and hence unusable.
| Quadrant | # 1 sec bins | Bins with >0 counts | Bins with >2000 counts | High rate bins dominated by noise | Noise dominated (total time) | Noise dominated (detector-on time) | Marked lightcurve |
|---|---|---|---|---|---|---|---|
| A | 7696 | 6606 | 39 | 39 | 0.51% | 0.59% | 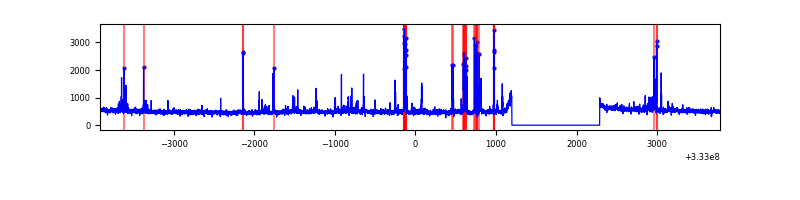 |
| B | 7697 | 6607 | 5 | 5 | 0.06% | 0.08% | 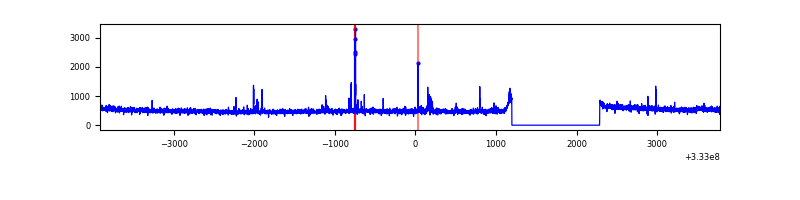 |
| C | 7697 | 6607 | 0 | 0 | 0.00% | 0.00% | 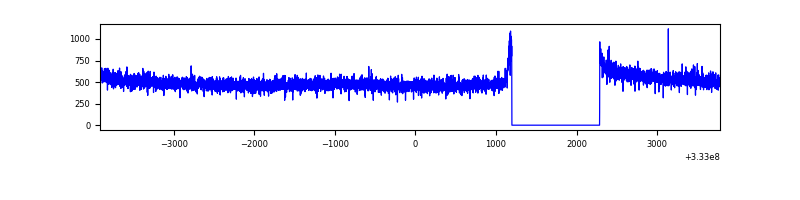 |
| D | 7697 | 6607 | 89 | 89 | 1.16% | 1.35% | 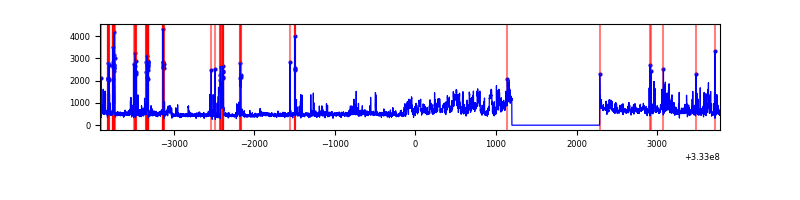 |
Top three noisy pixels from each quadrant. If the there are fewer than three noisy pixels in the level2.evt file, extra rows are filled as -1
| Pixel properties | Quadrant properties | ||||||
|---|---|---|---|---|---|---|---|
| Quadrant | DetID | PixID | Counts | Sigma | Mean | Median | Sigma |
| A | 0 | 13 | 313771 | 1870.82 | 840 | 823 | 167.3 |
| A | 13 | 254 | 10092 | 55.41 | 840 | 823 | 167.3 |
| A | 3 | 137 | 7565 | 40.3 | 840 | 823 | 167.3 |
| B | 15 | 222 | 46838 | 290.19 | 836 | 814 | 158.6 |
| B | 0 | 190 | 28762 | 176.22 | 836 | 814 | 158.6 |
| B | 12 | 111 | 19352 | 116.89 | 836 | 814 | 158.6 |
| C | 14 | 238 | 132016 | 702.09 | 806 | 814 | 186.9 |
| C | 13 | 61 | 5527 | 25.22 | 806 | 814 | 186.9 |
| C | 3 | 233 | 2863 | 10.96 | 806 | 814 | 186.9 |
| D | 7 | 223 | 698540 | 3621.69 | 806 | 787 | 192.7 |
| D | 1 | 52 | 611396 | 3169.37 | 806 | 787 | 192.7 |
| D | 2 | 234 | 24908 | 125.2 | 806 | 787 | 192.7 |
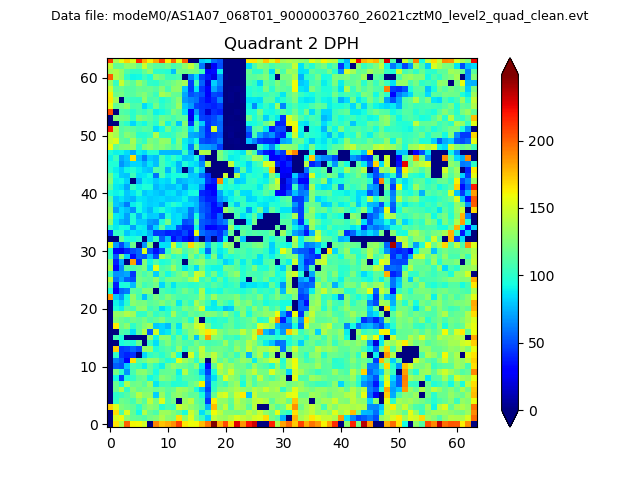
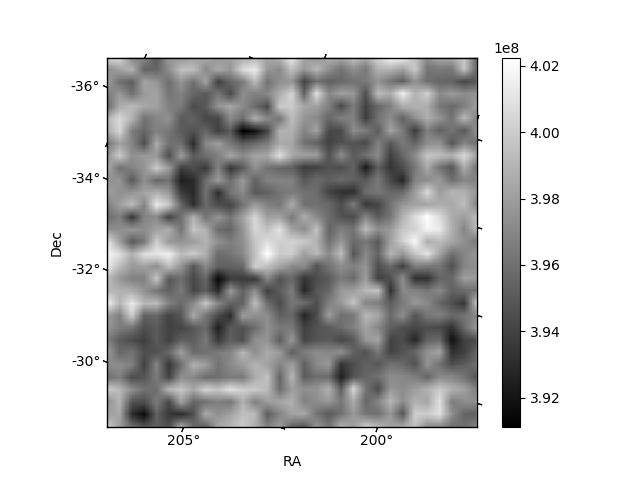
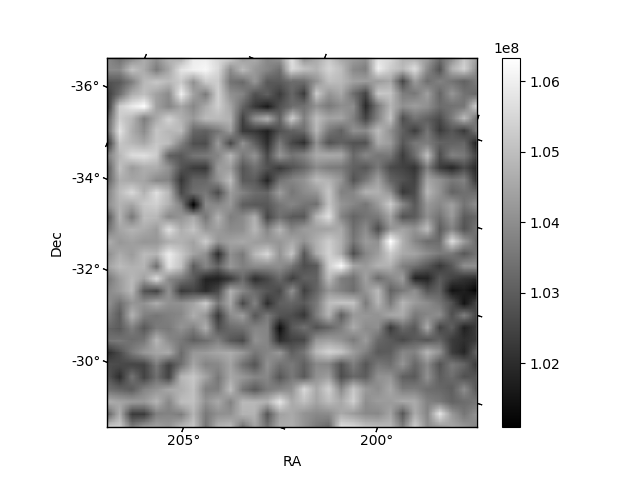
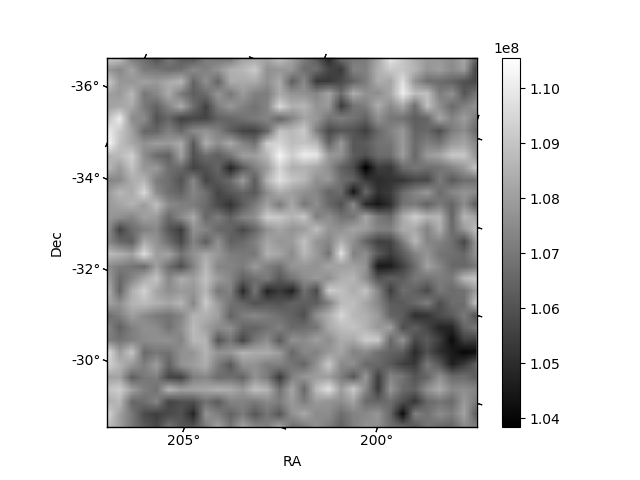
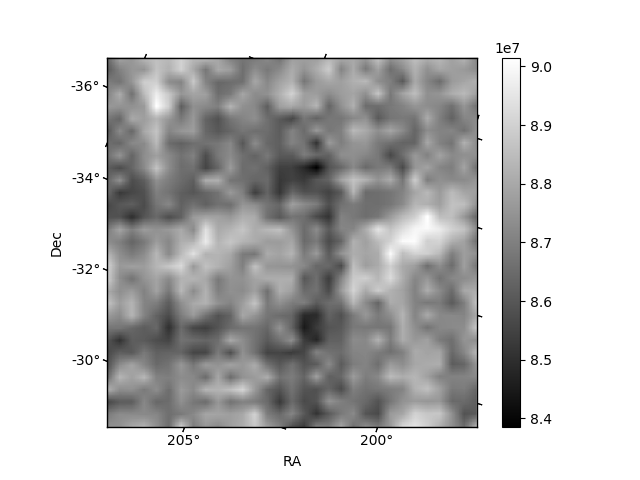
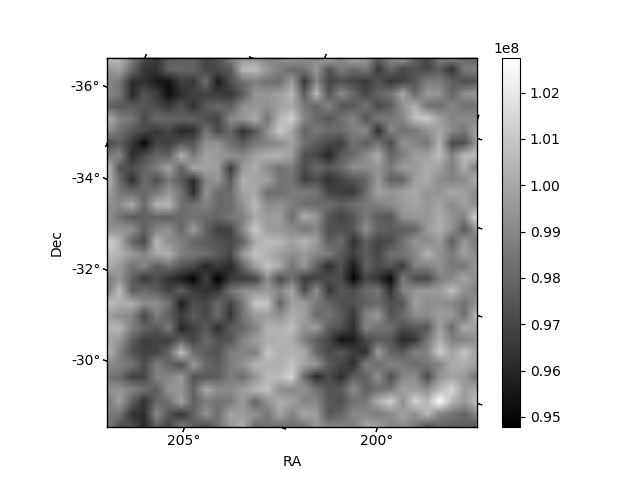
Histogram calculated using DETX and DETY for each event in the final _common_clean file
| Quadrant A | 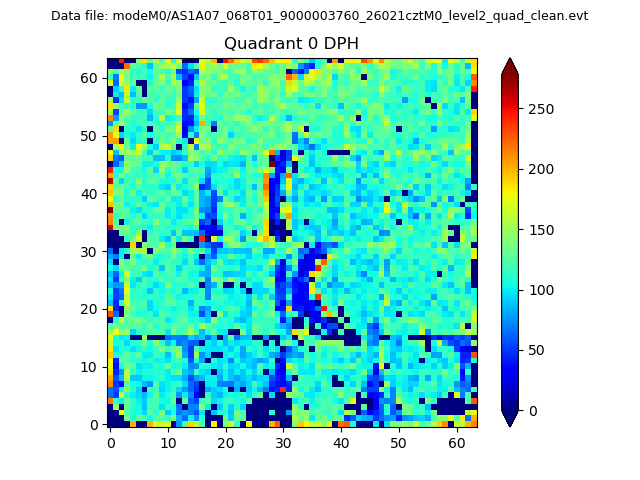 |
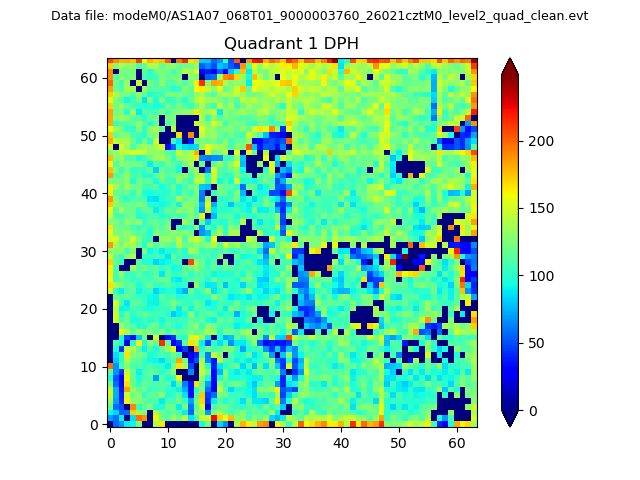 |
Quadrant B |
|---|---|---|---|
| Quadrant D | 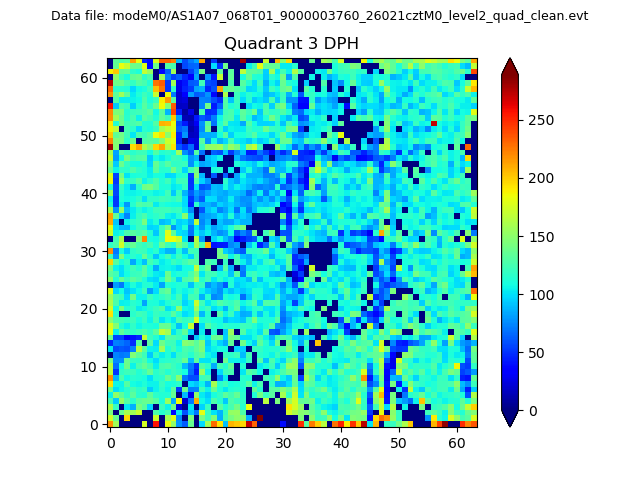 |
 |
Quadrant C |
| Plot type | Count rate plots | Images |
|---|---|---|
| Comparison with Poisson distribution Blue bars denote a histogram of data divided into 1 sec bins. Red curve is a Poisson curve with rate = median count rate of data. |
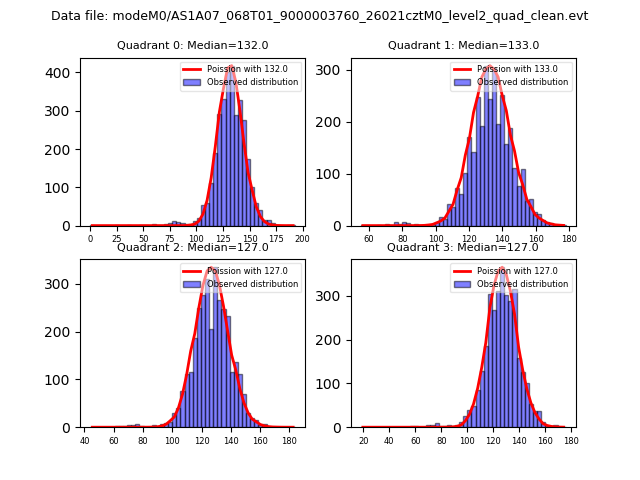 |
 |
| Quadrant-wise count rates Data is divided into 100 sec bins |
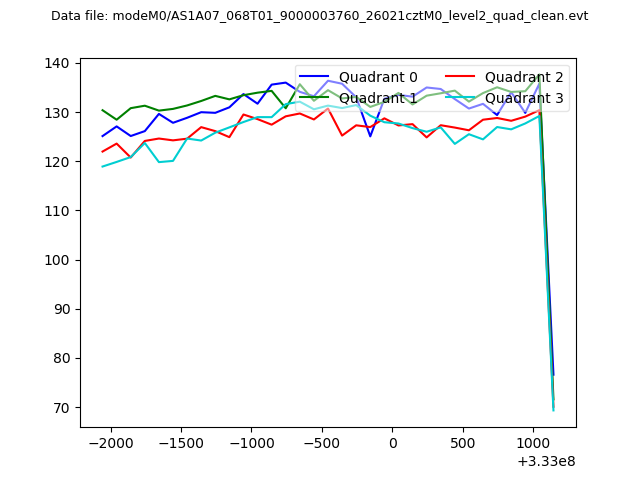 |
|
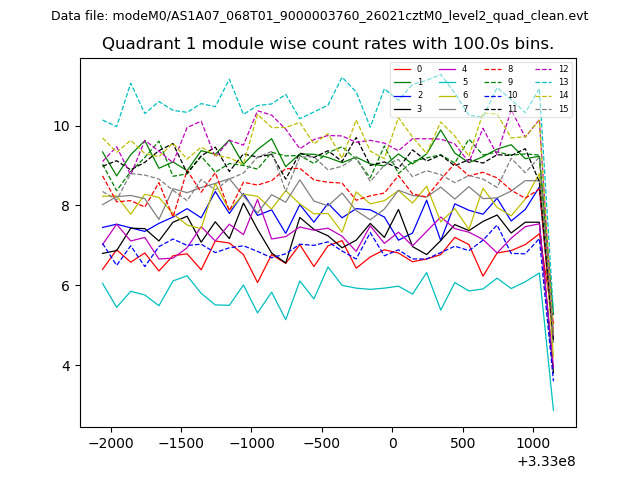
| Module-wise count rates for Quadrant A Data is divided into 100 sec bins |
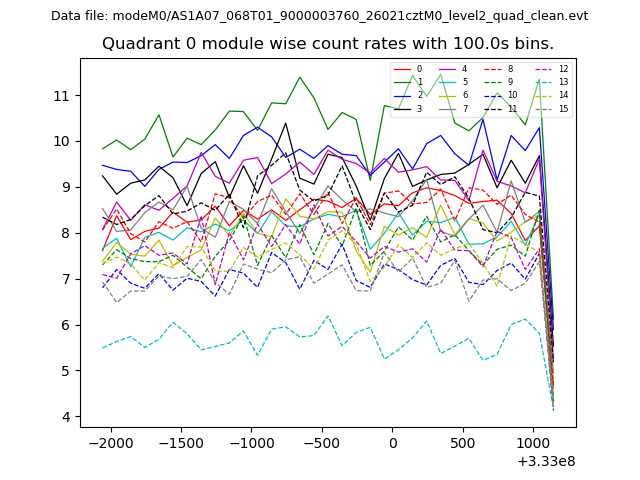 |
 |
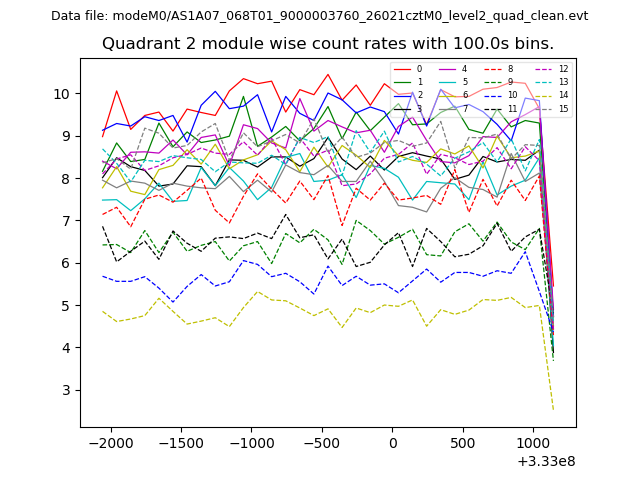
| Module-wise count rates for Quadrant B Data is divided into 100 sec bins |
 |
 |
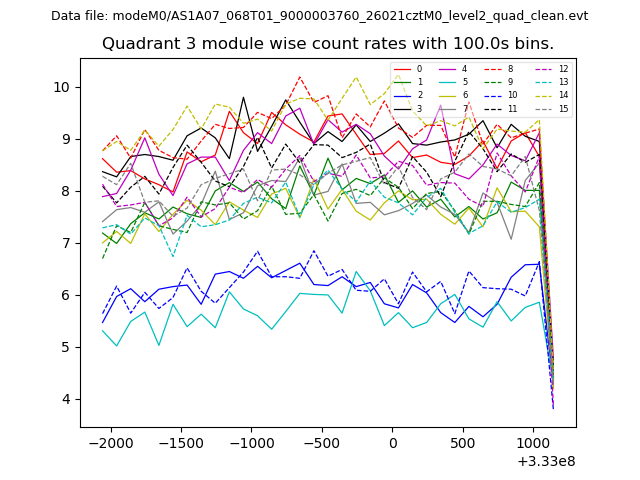
| Module-wise count rates for Quadrant C Data is divided into 100 sec bins |
 |
 |
| Module-wise count rates for Quadrant D Data is divided into 100 sec bins |
 |
 |
| Parameter | Plot |
|---|---|
| CZT HV Monitor | 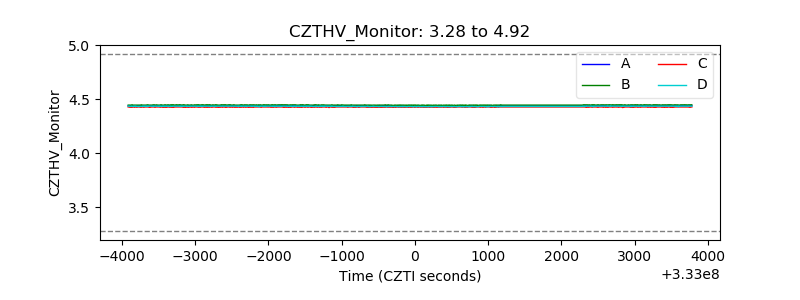 |
| D_VDD | 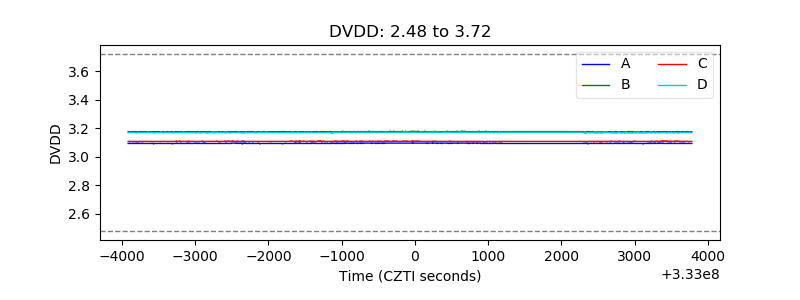 |
| Temperature 1 | 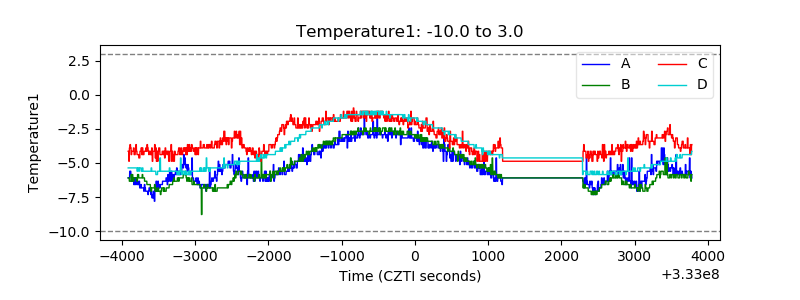 |
| Veto HV Monitor |  |
| Veto LLD | 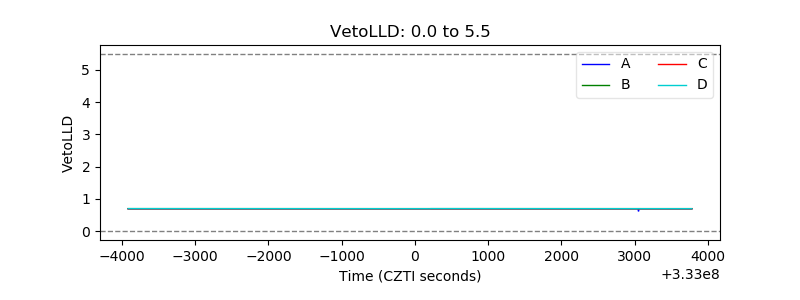 |
| Alpha Counter | 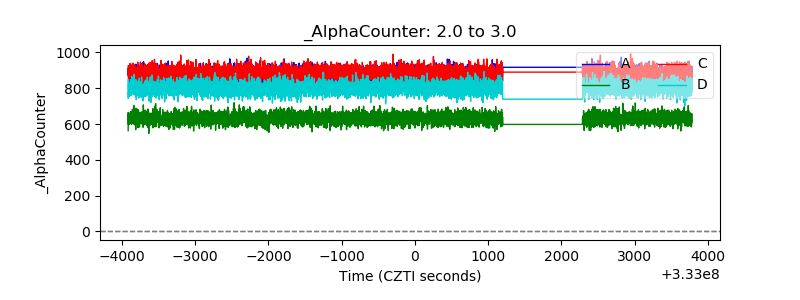 |
| _CPM_Rate | 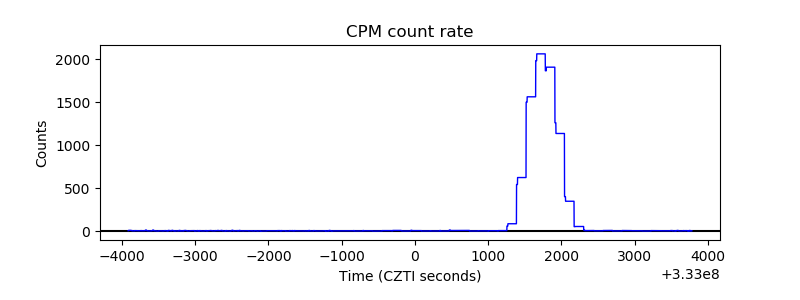 |
| CZT Counter | 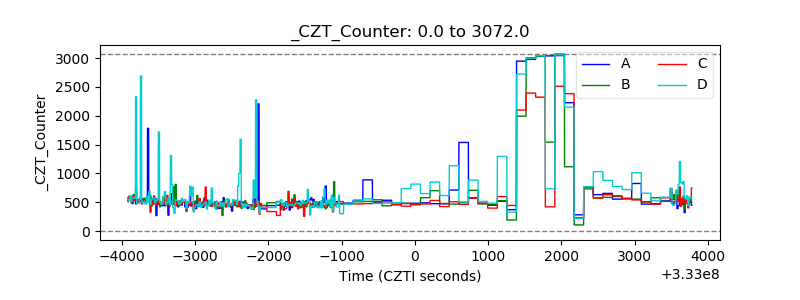 |
| +2.5 Volts monitor |  |
| +5 Volts monitor |  |
| _ROLL_ROT | 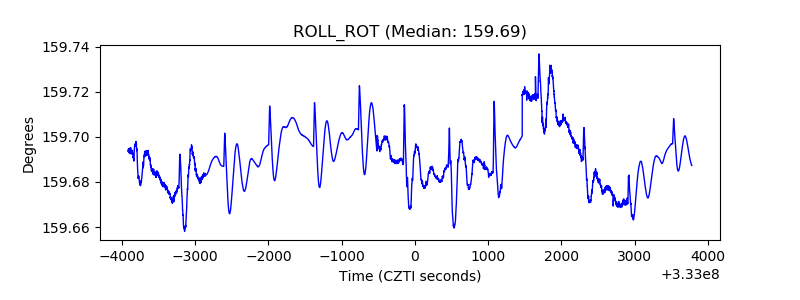 |
| _Roll_DEC |  |
| _Roll_RA | 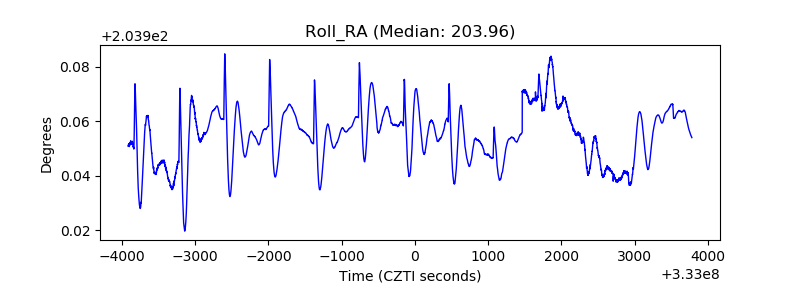 |
| Veto Counter | 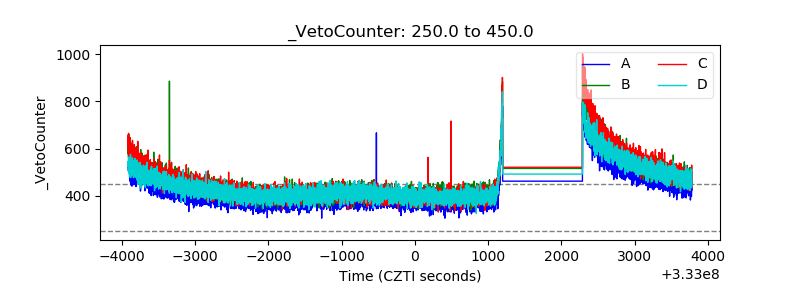 |