| Param | Original file | Final file |
|---|---|---|
| Filename | modeM0/AS1A07_068T01_9000003760_26024cztM0_level2.evt | modeM0/AS1A07_068T01_9000003760_26024cztM0_level2_quad_clean.evt |
| Size (bytes) | 335,724,480 | 73,658,880 |
| Size | 320.2 MB | 70.2 MB |
| Events in quadrant A | 2,547,530 | 487,565 |
| Events in quadrant B | 2,474,333 | 492,991 |
| Events in quadrant C | 2,317,372 | 473,149 |
| Events in quadrant D | 2,531,610 | 470,571 |
| Mode M0 | |||
|---|---|---|---|
| Quadrant | BADHDUFLAG | Total packets | Discarded packets |
| A | 0 | 10310 | 0 |
| B | 0 | 9991 | 0 |
| C | 0 | 9601 | 0 |
| D | 0 | 10359 | 0 |
| Mode M9 | |||
|---|---|---|---|
| Quadrant | BADHDUFLAG | Total packets | Discarded packets |
| A | 0 | 2 | 0 |
| B | 0 | 3 | 0 |
| C | 0 | 3 | 0 |
| D | 0 | 3 | 0 |
| Quadrant | Total seconds | Saturated seconds | Saturation percentage |
|---|---|---|---|
| A | 4351 | 55 | 1.264077% |
| B | 4351 | 54 | 1.241094% |
| C | 4351 | 48 | 1.103195% |
| D | 4351 | 18 | 0.413698% |
Noise dominated data is calculated using 1-second bins in cleaned event files. If a bin has >2000 counts, and if more than 50% of those come from <1% of pixels, then it is considered to be noise-dominated and hence unusable.
| Quadrant | # 1 sec bins | Bins with >0 counts | Bins with >2000 counts | High rate bins dominated by noise | Noise dominated (total time) | Noise dominated (detector-on time) | Marked lightcurve |
|---|---|---|---|---|---|---|---|
| A | 4351 | 4351 | 31 | 31 | 0.71% | 0.71% | 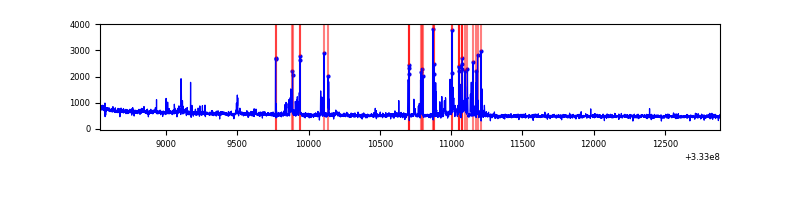 |
| B | 4351 | 4351 | 16 | 16 | 0.37% | 0.37% | 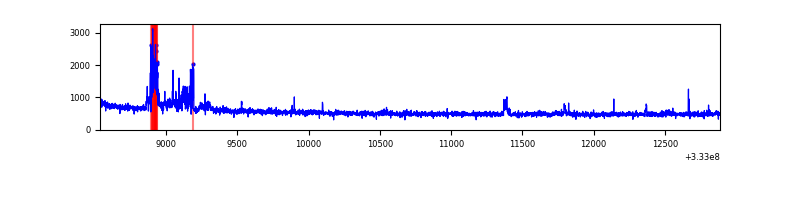 |
| C | 4351 | 4351 | 0 | 0 | 0.00% | 0.00% | 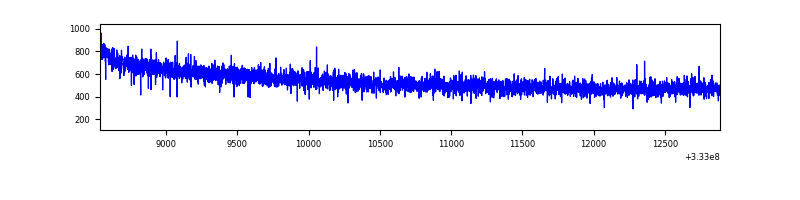 |
| D | 4351 | 4351 | 7 | 7 | 0.16% | 0.16% | 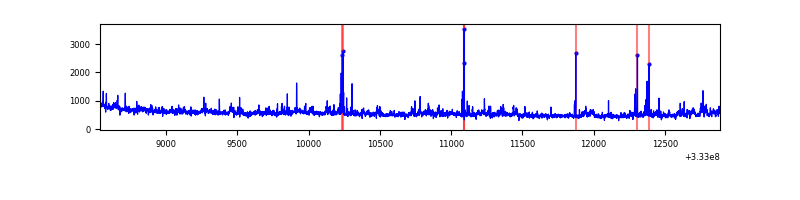 |
Top three noisy pixels from each quadrant. If the there are fewer than three noisy pixels in the level2.evt file, extra rows are filled as -1
| Pixel properties | Quadrant properties | ||||||
|---|---|---|---|---|---|---|---|
| Quadrant | DetID | PixID | Counts | Sigma | Mean | Median | Sigma |
| A | 0 | 13 | 242431 | 2057.42 | 596 | 589 | 117.5 |
| A | 13 | 254 | 6140 | 47.22 | 596 | 589 | 117.5 |
| A | 0 | 226 | 5072 | 38.14 | 596 | 589 | 117.5 |
| B | 0 | 229 | 167849 | 1533.22 | 585 | 573 | 109.1 |
| B | 12 | 111 | 12655 | 110.74 | 585 | 573 | 109.1 |
| B | 0 | 190 | 12359 | 108.03 | 585 | 573 | 109.1 |
| C | 14 | 238 | 94170 | 714.35 | 569 | 574 | 131.0 |
| C | 13 | 61 | 3898 | 25.37 | 569 | 574 | 131.0 |
| C | 3 | 233 | 3637 | 23.38 | 569 | 574 | 131.0 |
| D | 7 | 223 | 185575 | 1314.06 | 580 | 567 | 140.8 |
| D | 1 | 52 | 107654 | 760.61 | 580 | 567 | 140.8 |
| D | 11 | 176 | 22212 | 153.74 | 580 | 567 | 140.8 |
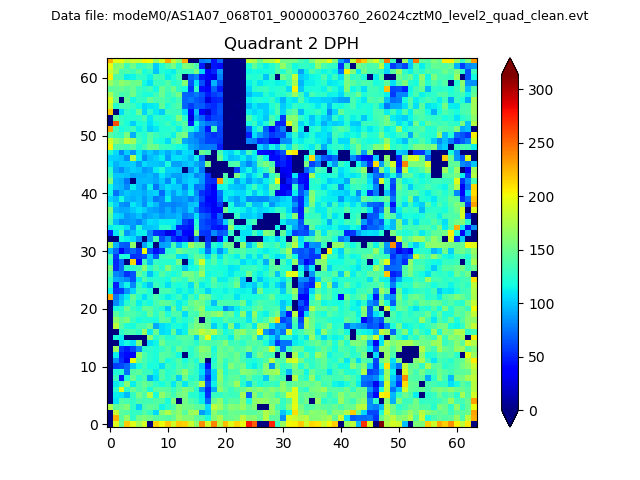
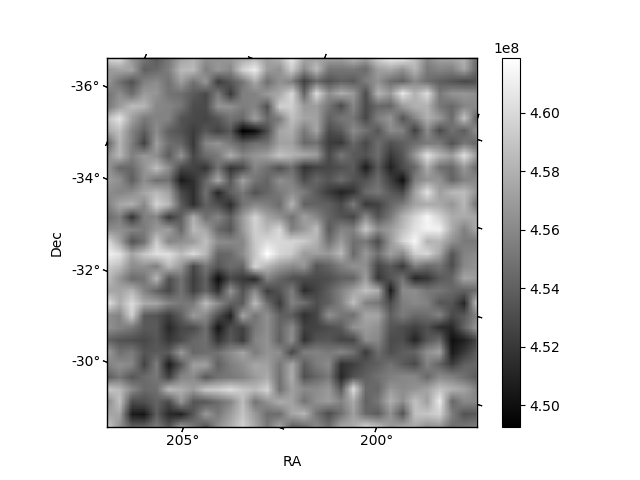
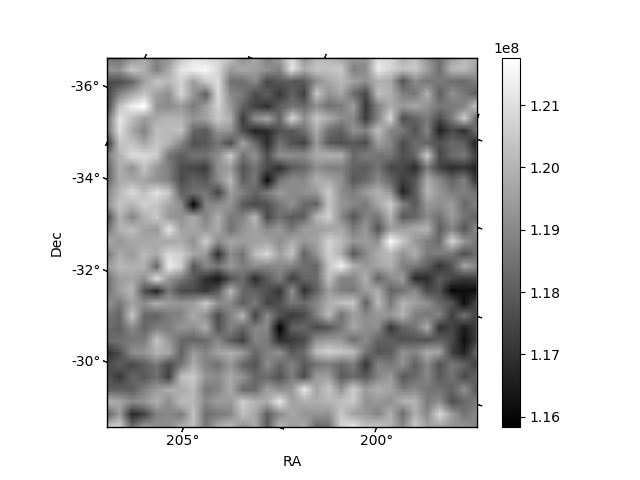
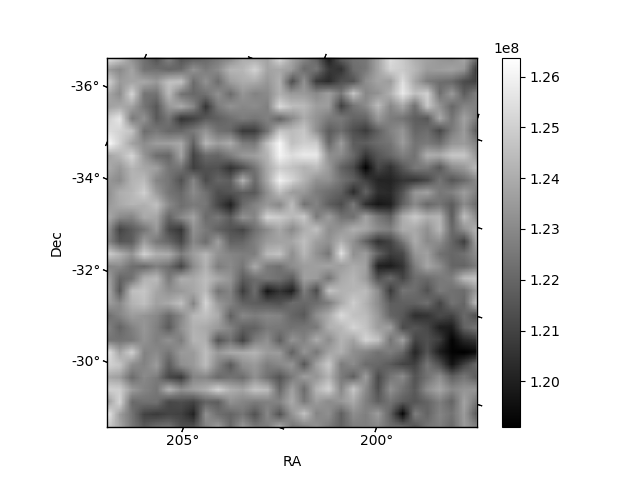
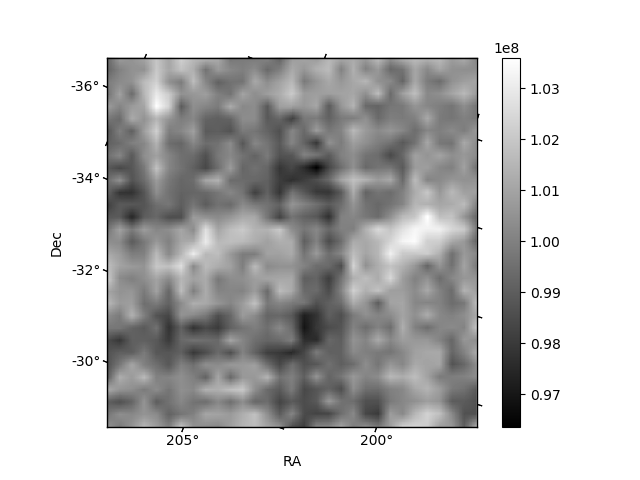
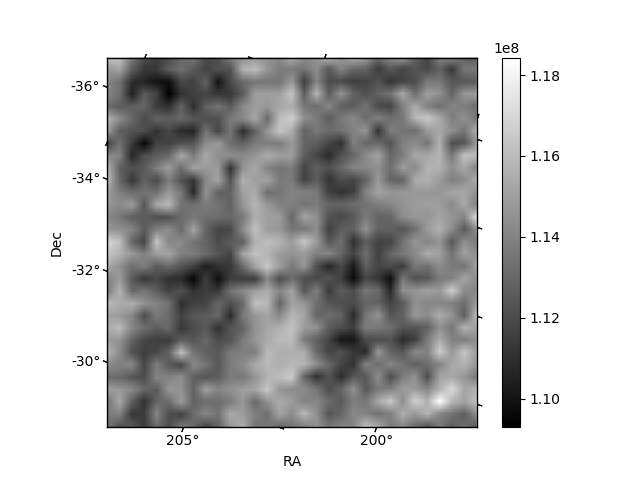
Histogram calculated using DETX and DETY for each event in the final _common_clean file
| Quadrant A | 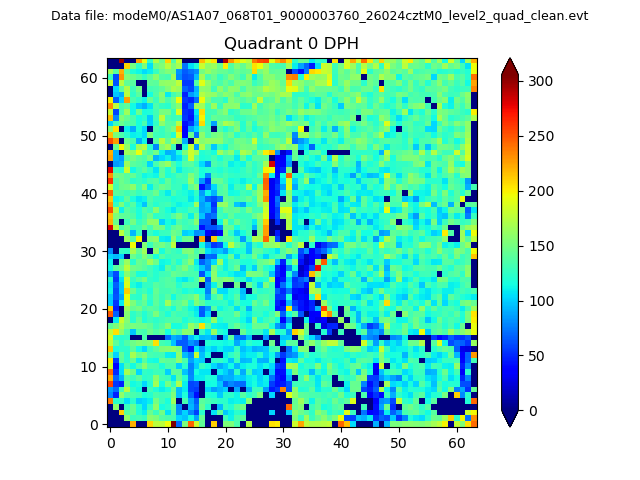 |
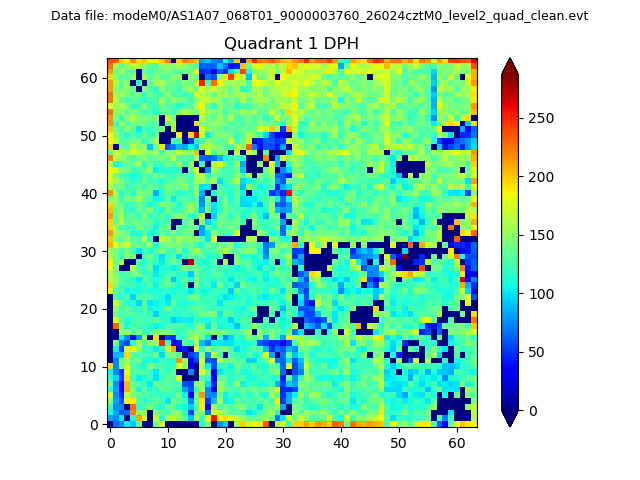 |
Quadrant B |
|---|---|---|---|
| Quadrant D | 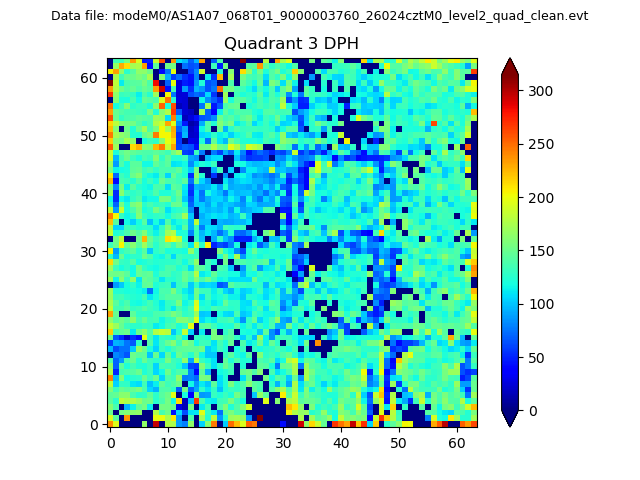 |
 |
Quadrant C |
| Plot type | Count rate plots | Images |
|---|---|---|
| Comparison with Poisson distribution Blue bars denote a histogram of data divided into 1 sec bins. Red curve is a Poisson curve with rate = median count rate of data. |
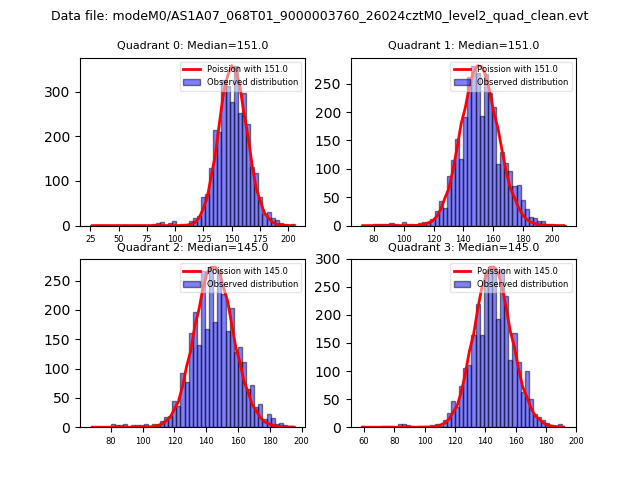 |
 |
| Quadrant-wise count rates Data is divided into 100 sec bins |
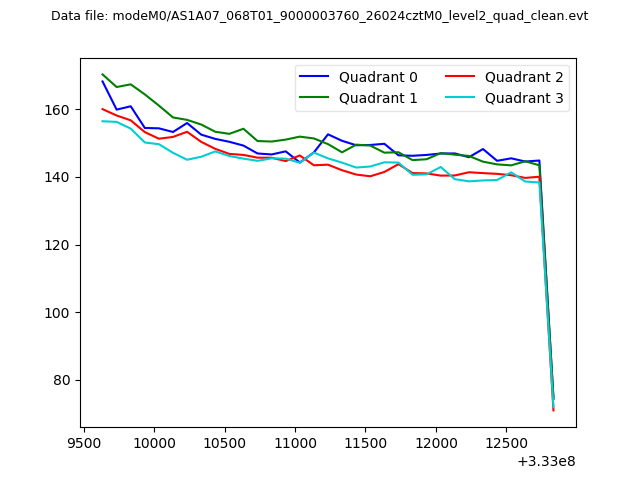 |
|
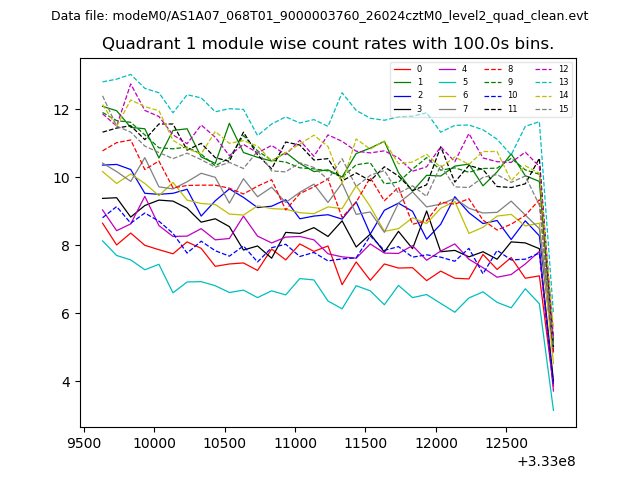
| Module-wise count rates for Quadrant A Data is divided into 100 sec bins |
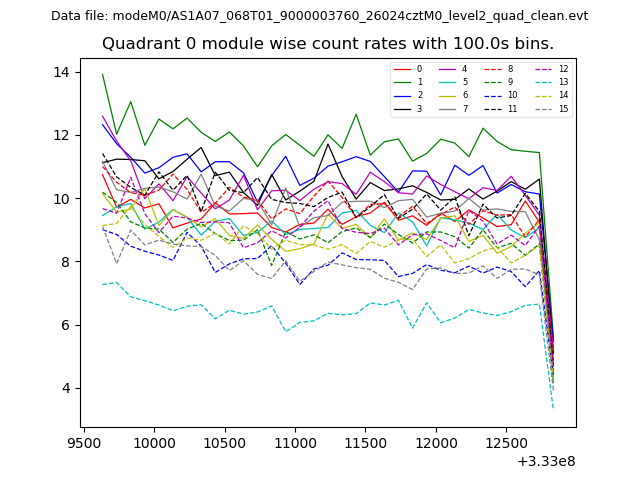 |
 |
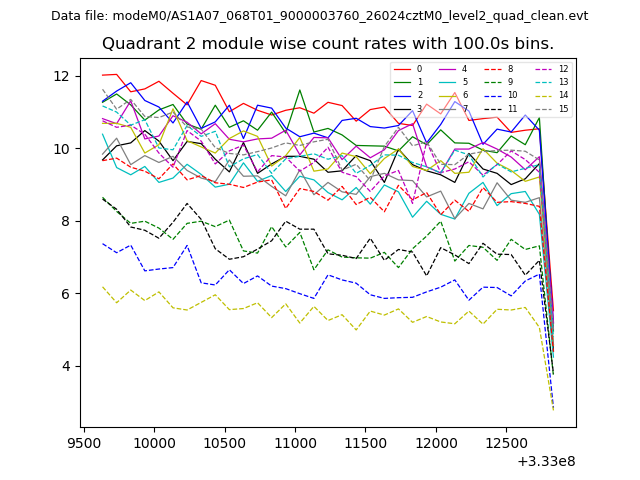
| Module-wise count rates for Quadrant B Data is divided into 100 sec bins |
 |
 |
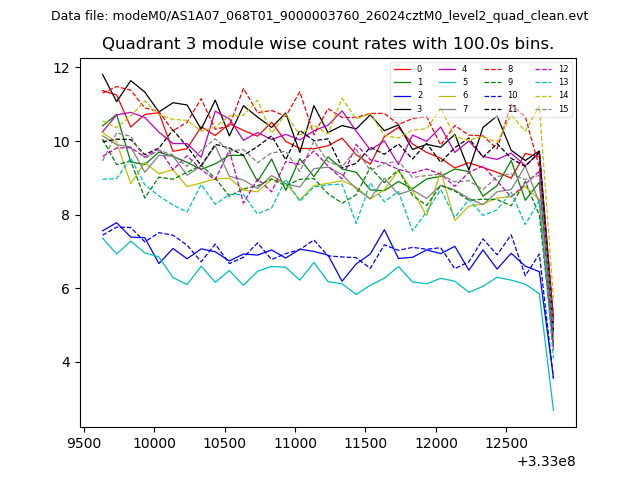
| Module-wise count rates for Quadrant C Data is divided into 100 sec bins |
 |
 |
| Module-wise count rates for Quadrant D Data is divided into 100 sec bins |
 |
 |
| Parameter | Plot |
|---|---|
| CZT HV Monitor | 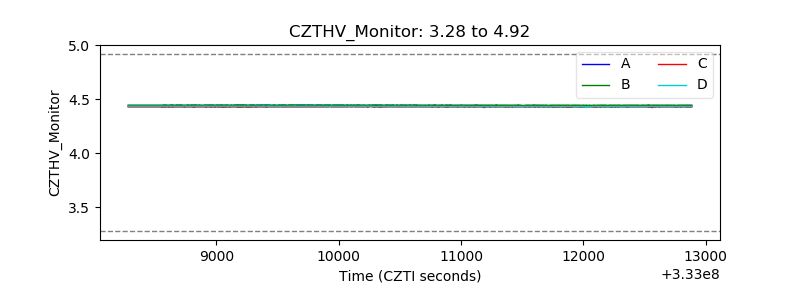 |
| D_VDD | 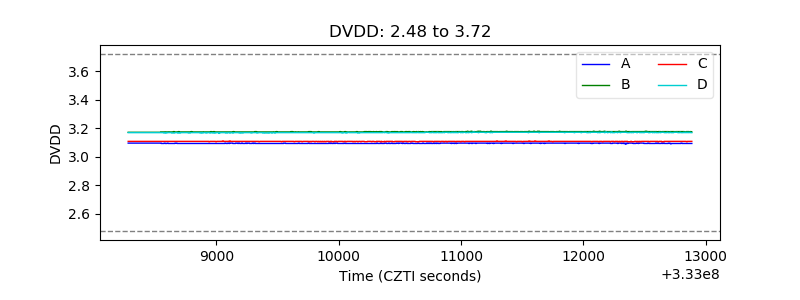 |
| Temperature 1 |  |
| Veto HV Monitor | 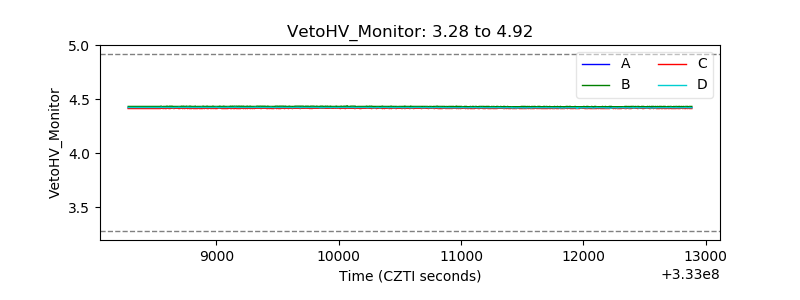 |
| Veto LLD | 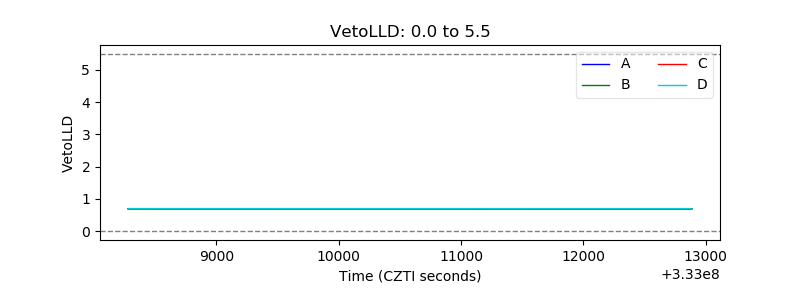 |
| Alpha Counter | 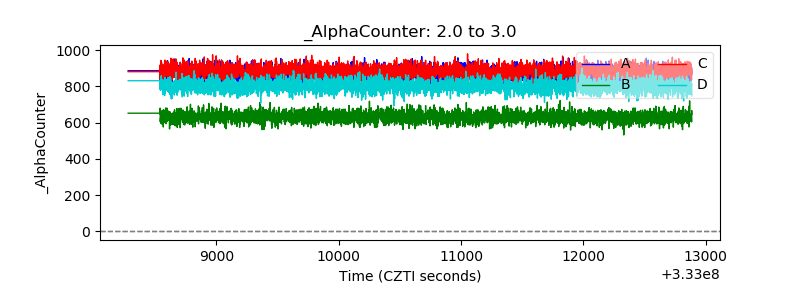 |
| _CPM_Rate | 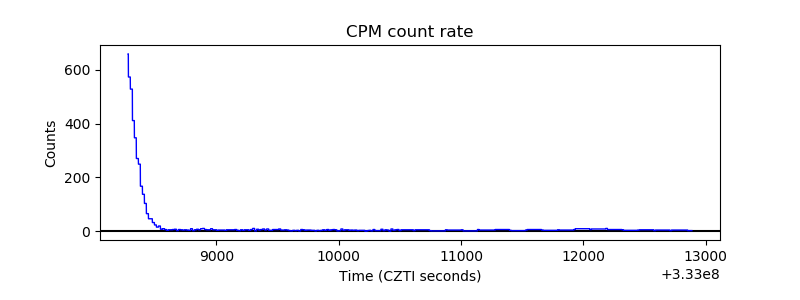 |
| CZT Counter | 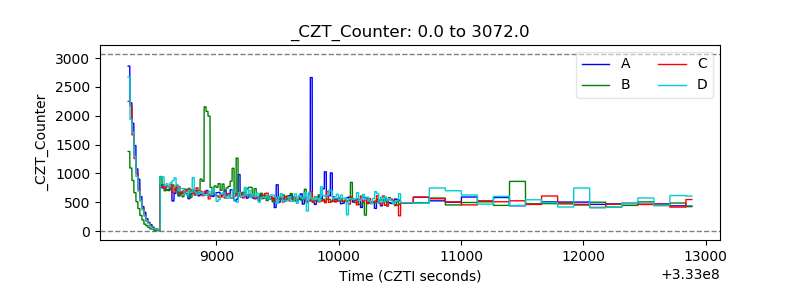 |
| +2.5 Volts monitor |  |
| +5 Volts monitor |  |
| _ROLL_ROT | 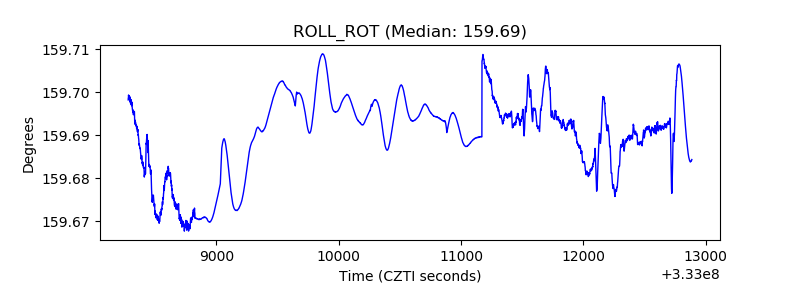 |
| _Roll_DEC | 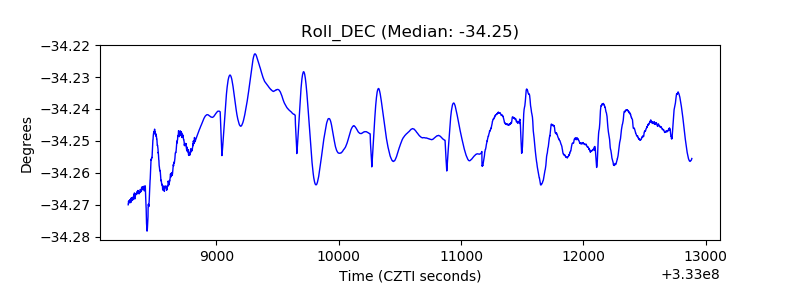 |
| _Roll_RA | 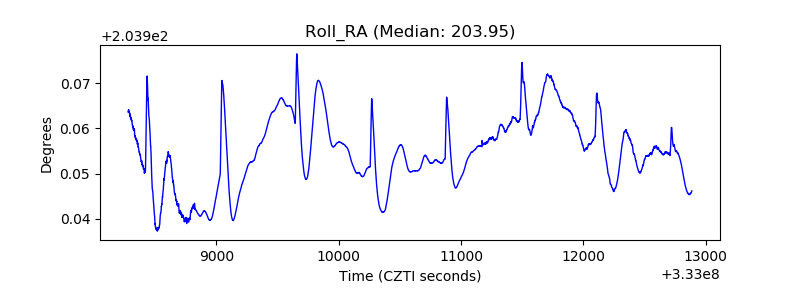 |
| Veto Counter | 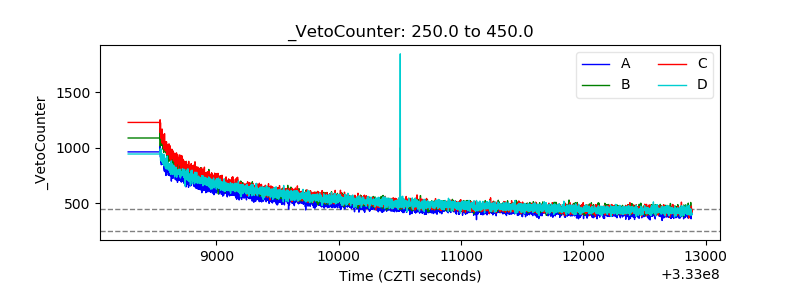 |