| Param | Original file | Final file |
|---|---|---|
| Filename | modeM0/AS1A09_033T02_9000003762cztM0_level2.fits | modeM0/AS1A09_033T02_9000003762cztM0_level2_quad_clean.evt |
| Size (bytes) | 1,025,412,480 | 733,763,520 |
| Size | 977.9 MB | 699.8 MB |
| Events in quadrant A | 6,497,088 | 4,051,875 |
| Events in quadrant B | 6,108,848 | 4,035,236 |
| Events in quadrant C | 6,189,226 | 3,818,293 |
| Events in quadrant D | 5,505,672 | 3,559,436 |
| Mode M9 | |||
|---|---|---|---|
| Quadrant | BADHDUFLAG | Total packets | Discarded packets |
| A | 0 | 173 | 0 |
| B | 0 | 173 | 0 |
| C | 0 | 173 | 0 |
| D | 0 | 173 | 0 |
| Mode SS | |||
|---|---|---|---|
| Quadrant | BADHDUFLAG | Total packets | Discarded packets |
| A | 0 | 2010 | 0 |
| B | 0 | 2010 | 0 |
| C | 0 | 2010 | 0 |
| D | 0 | 2010 | 0 |
| Mode M0 | |||
|---|---|---|---|
| Quadrant | BADHDUFLAG | Total packets | Discarded packets |
| A | 0 | 214004 | 0 |
| B | 0 | 215400 | 0 |
| C | 0 | 206437 | 0 |
| D | 0 | 240495 | 0 |
| Quadrant | Total seconds | Saturated seconds | Saturation percentage |
|---|---|---|---|
| A | 98531 | 1553 | 1.576154% |
| B | 98531 | 1891 | 1.919193% |
| C | 98530 | 1717 | 1.742616% |
| D | 98531 | 2731 | 2.771717% |
Noise dominated data is calculated using 1-second bins in cleaned event files. If a bin has >2000 counts, and if more than 50% of those come from <1% of pixels, then it is considered to be noise-dominated and hence unusable.
| Quadrant | # 1 sec bins | Bins with >0 counts | Bins with >2000 counts | High rate bins dominated by noise | Noise dominated (total time) | Noise dominated (detector-on time) | Marked lightcurve |
|---|---|---|---|---|---|---|---|
| A | 115710 | 98516 | 0 | 0 | 0.00% | 0.00% | 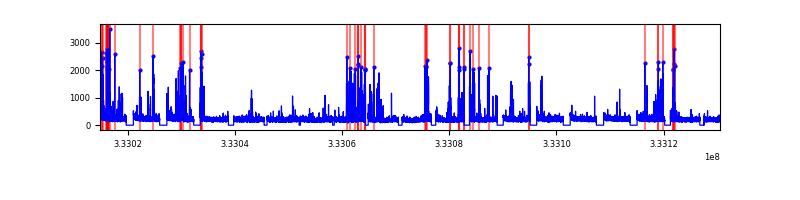 |
| B | 115710 | 98505 | 0 | 0 | 0.00% | 0.00% |  |
| C | 115710 | 98517 | 0 | 0 | 0.00% | 0.00% |  |
| D | 115710 | 98515 | 0 | 0 | 0.00% | 0.00% |  |
Top three noisy pixels from each quadrant. If the there are fewer than three noisy pixels in the level2.evt file, extra rows are filled as -1
| Pixel properties | Quadrant properties | ||||||
|---|---|---|---|---|---|---|---|
| Quadrant | DetID | PixID | Counts | Sigma | Mean | Median | Sigma |
| A | 0 | 29 | 5572 | 9.77 | 1693 | 1599 | 406.8 |
| A | 7 | 110 | 5142 | 8.71 | 1693 | 1599 | 406.8 |
| A | 9 | 19 | 4862 | 8.02 | 1693 | 1599 | 406.8 |
| B | 2 | 9 | 4804 | 10.48 | 1616 | 1551 | 310.4 |
| B | 3 | 80 | 4035 | 8.0 | 1616 | 1551 | 310.4 |
| B | 2 | 8 | 4024 | 7.97 | 1616 | 1551 | 310.4 |
| C | 12 | 241 | 4310 | 6.75 | 1637 | 1539 | 410.7 |
| C | 3 | 126 | 4264 | 6.64 | 1637 | 1539 | 410.7 |
| C | 9 | 233 | 4228 | 6.55 | 1637 | 1539 | 410.7 |
| D | 3 | 14 | 4020 | 6.3 | 1573 | 1439 | 409.3 |
| D | 6 | 231 | 3925 | 6.07 | 1573 | 1439 | 409.3 |
| D | 10 | 189 | 3886 | 5.98 | 1573 | 1439 | 409.3 |
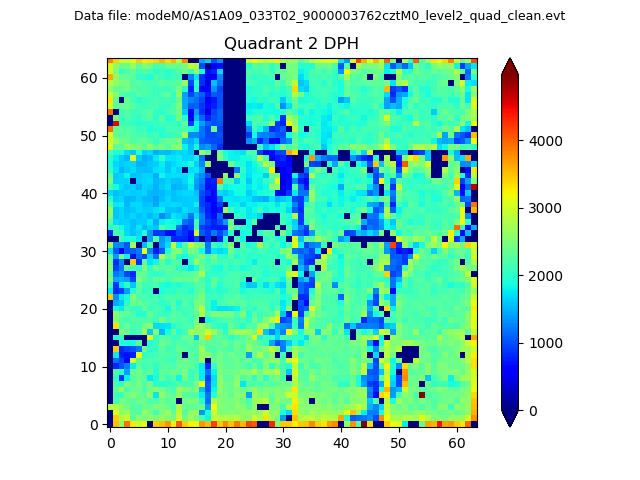
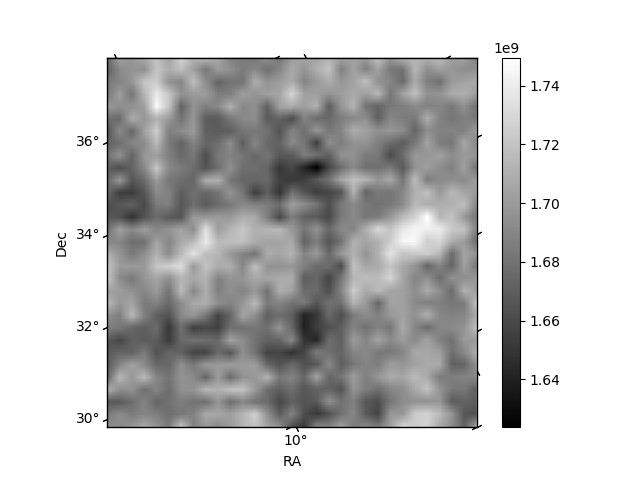
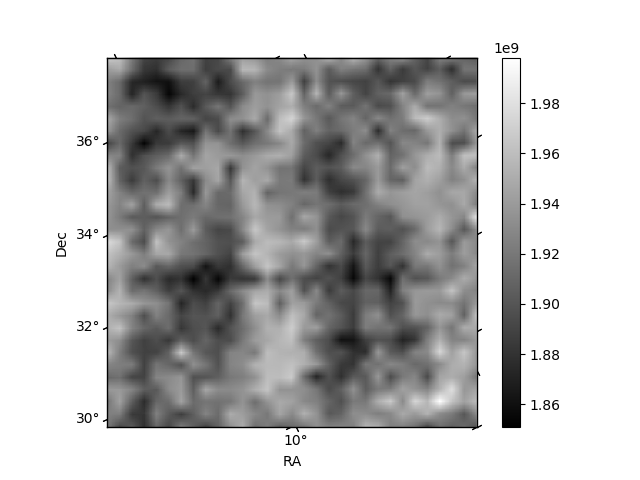
Histogram calculated using DETX and DETY for each event in the final _common_clean file
| Quadrant A | 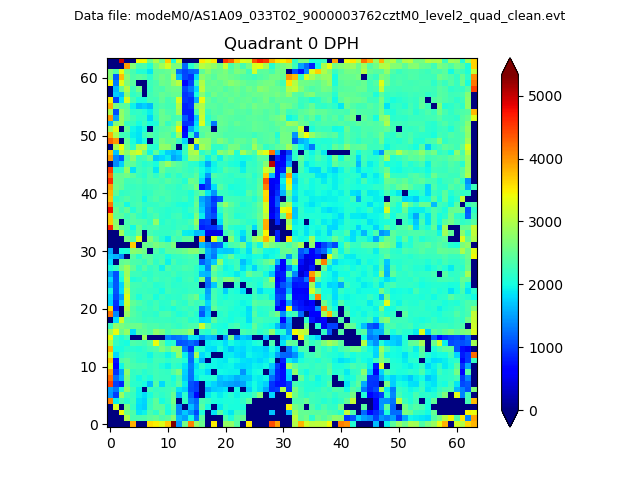 |
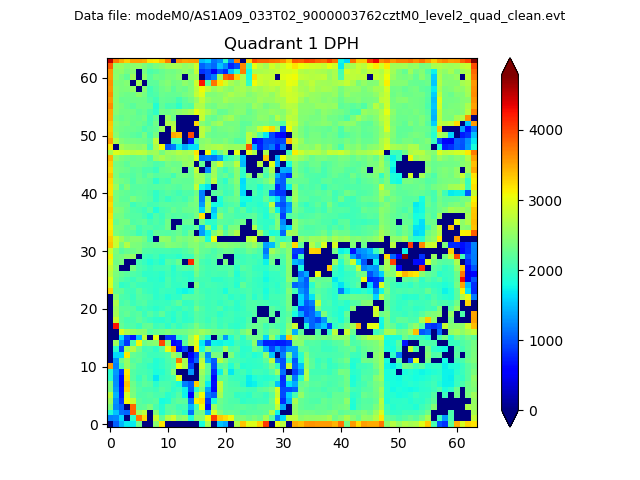 |
Quadrant B |
|---|---|---|---|
| Quadrant D | 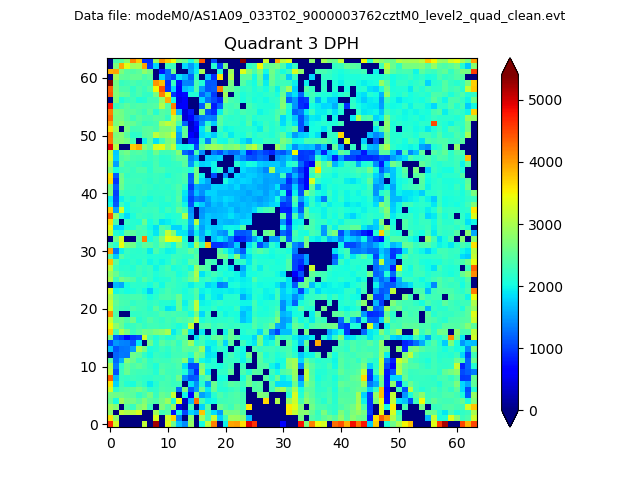 |
 |
Quadrant C |
| Plot type | Count rate plots | Images |
|---|---|---|
| Comparison with Poisson distribution Blue bars denote a histogram of data divided into 1 sec bins. Red curve is a Poisson curve with rate = median count rate of data. |
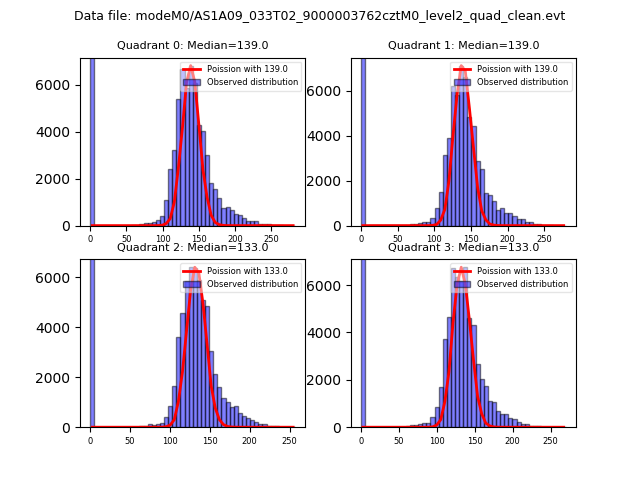 |
 |
| Quadrant-wise count rates Data is divided into 100 sec bins |
 |
|
| Module-wise count rates for Quadrant A Data is divided into 100 sec bins |
 |
 |
| Module-wise count rates for Quadrant B Data is divided into 100 sec bins |
 |
 |
| Module-wise count rates for Quadrant C Data is divided into 100 sec bins |
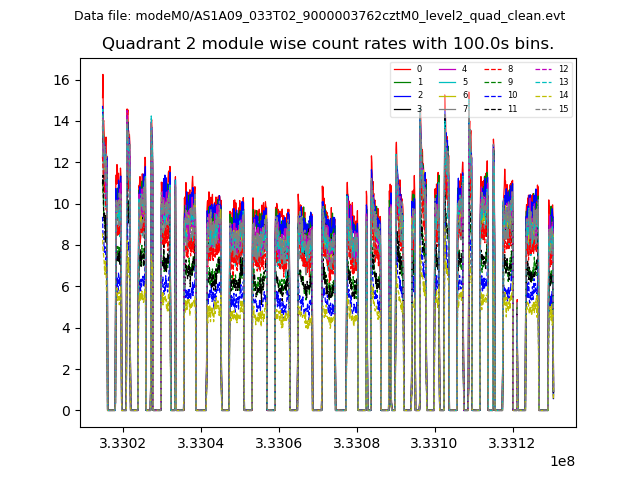 |
 |
| Module-wise count rates for Quadrant D Data is divided into 100 sec bins |
 |
 |
| Parameter | Plot |
|---|---|
| CZT HV Monitor |  |
| D_VDD |  |
| Temperature 1 | 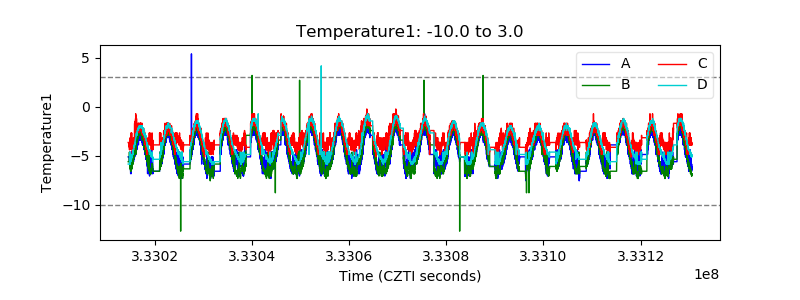 |
| Veto HV Monitor |  |
| Veto LLD |  |
| Alpha Counter |  |
| _CPM_Rate | 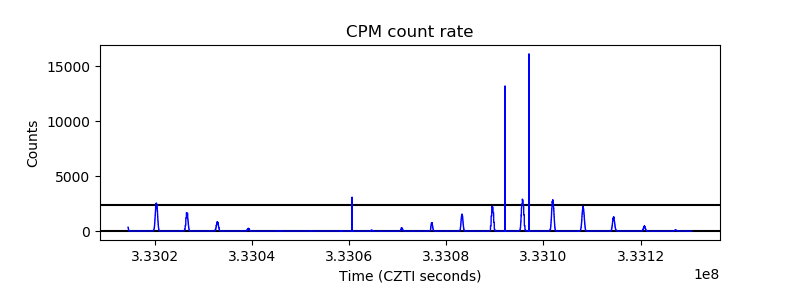 |
| CZT Counter |  |
| +2.5 Volts monitor |  |
| +5 Volts monitor | 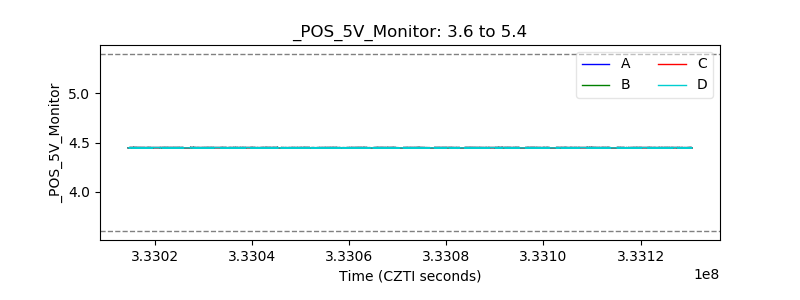 |
| _ROLL_ROT | 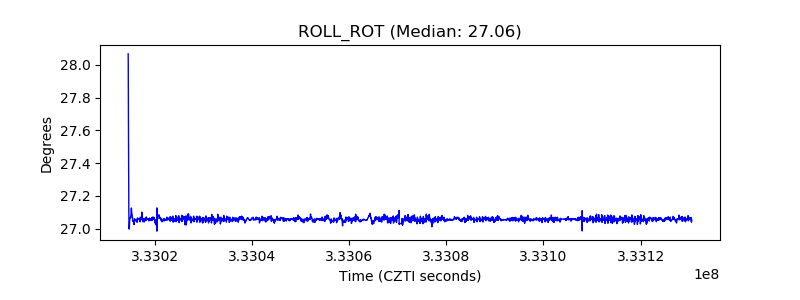 |
| _Roll_DEC | 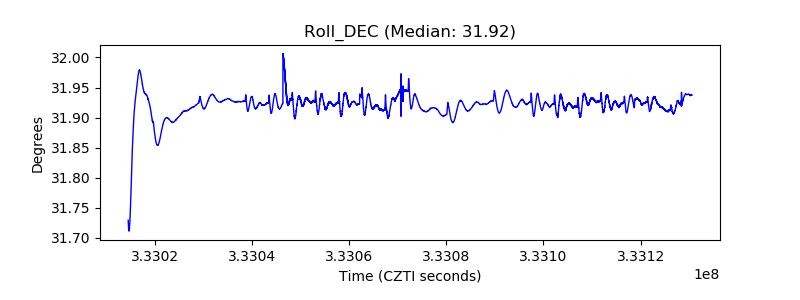 |
| _Roll_RA |  |
| Veto Counter | 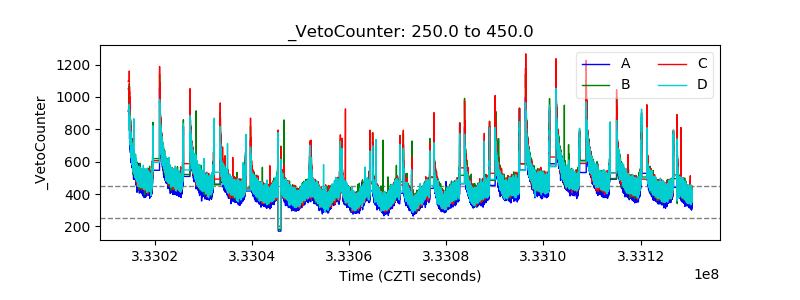 |