| Param | Original file | Final file |
|---|---|---|
| Filename | modeM0/AS1A09_033T02_9000003762_26025cztM0_level2.evt | modeM0/AS1A09_033T02_9000003762_26025cztM0_level2_quad_clean.evt |
| Size (bytes) | 452,208,960 | 89,029,440 |
| Size | 431.3 MB | 84.9 MB |
| Events in quadrant A | 3,653,965 | 582,385 |
| Events in quadrant B | 3,263,194 | 592,847 |
| Events in quadrant C | 3,161,126 | 554,674 |
| Events in quadrant D | 3,221,822 | 559,461 |
| Mode M9 | |||
|---|---|---|---|
| Quadrant | BADHDUFLAG | Total packets | Discarded packets |
| A | 0 | 13 | 0 |
| B | 0 | 13 | 0 |
| C | 0 | 13 | 0 |
| D | 0 | 13 | 0 |
| Mode M0 | |||
|---|---|---|---|
| Quadrant | BADHDUFLAG | Total packets | Discarded packets |
| A | 0 | 14365 | 0 |
| B | 0 | 13013 | 0 |
| C | 0 | 12635 | 0 |
| D | 0 | 13047 | 0 |
| Quadrant | Total seconds | Saturated seconds | Saturation percentage |
|---|---|---|---|
| A | 5821 | 148 | 2.542518% |
| B | 5821 | 65 | 1.116647% |
| C | 5821 | 75 | 1.288438% |
| D | 5821 | 44 | 0.755884% |
Noise dominated data is calculated using 1-second bins in cleaned event files. If a bin has >2000 counts, and if more than 50% of those come from <1% of pixels, then it is considered to be noise-dominated and hence unusable.
| Quadrant | # 1 sec bins | Bins with >0 counts | Bins with >2000 counts | High rate bins dominated by noise | Noise dominated (total time) | Noise dominated (detector-on time) | Marked lightcurve |
|---|---|---|---|---|---|---|---|
| A | 7166 | 5821 | 81 | 81 | 1.13% | 1.39% | 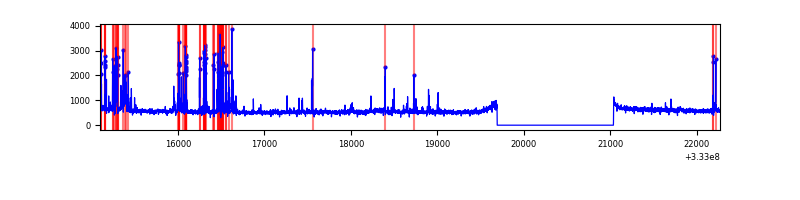 |
| B | 7166 | 5821 | 2 | 2 | 0.03% | 0.03% | 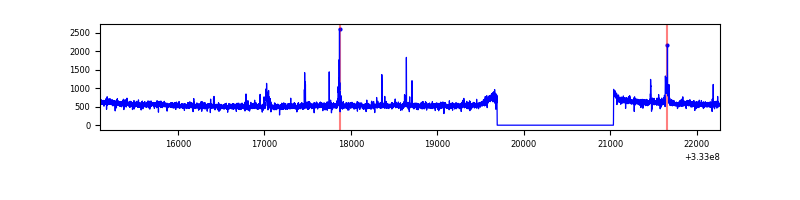 |
| C | 7166 | 5822 | 0 | 0 | 0.00% | 0.00% | 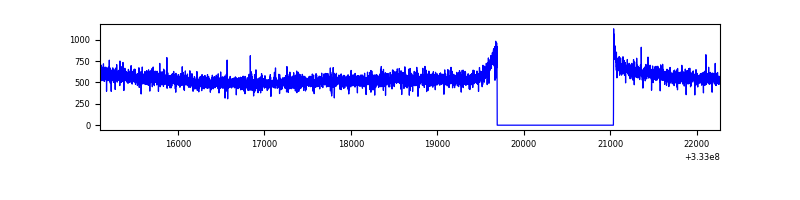 |
| D | 7166 | 5821 | 2 | 2 | 0.03% | 0.03% | 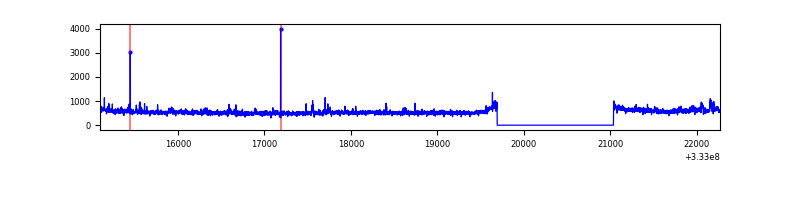 |
Top three noisy pixels from each quadrant. If the there are fewer than three noisy pixels in the level2.evt file, extra rows are filled as -1
| Pixel properties | Quadrant properties | ||||||
|---|---|---|---|---|---|---|---|
| Quadrant | DetID | PixID | Counts | Sigma | Mean | Median | Sigma |
| A | 0 | 13 | 453679 | 2774.43 | 829 | 817 | 163.2 |
| A | 13 | 254 | 8614 | 47.77 | 829 | 817 | 163.2 |
| A | 0 | 226 | 7113 | 38.57 | 829 | 817 | 163.2 |
| B | 10 | 245 | 33340 | 214.11 | 812 | 796 | 152.0 |
| B | 0 | 190 | 28781 | 184.12 | 812 | 796 | 152.0 |
| B | 0 | 229 | 28492 | 182.22 | 812 | 796 | 152.0 |
| C | 14 | 238 | 128608 | 713.74 | 777 | 782 | 179.1 |
| C | 3 | 233 | 5690 | 27.4 | 777 | 782 | 179.1 |
| C | 13 | 61 | 5359 | 25.56 | 777 | 782 | 179.1 |
| D | 1 | 52 | 90858 | 467.76 | 801 | 786 | 192.6 |
| D | 7 | 223 | 46198 | 235.83 | 801 | 786 | 192.6 |
| D | 2 | 234 | 23142 | 116.1 | 801 | 786 | 192.6 |
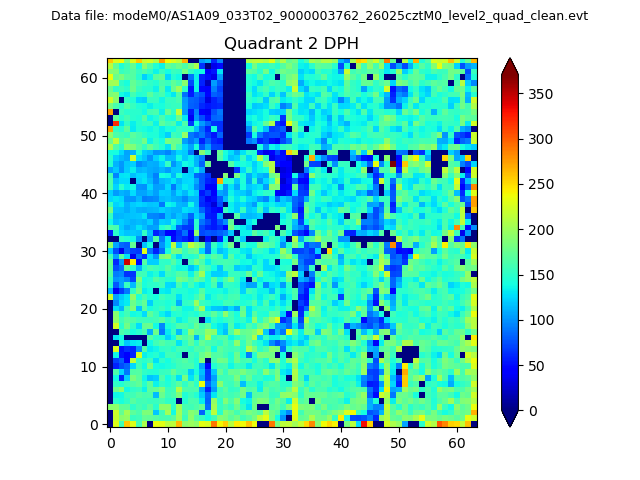
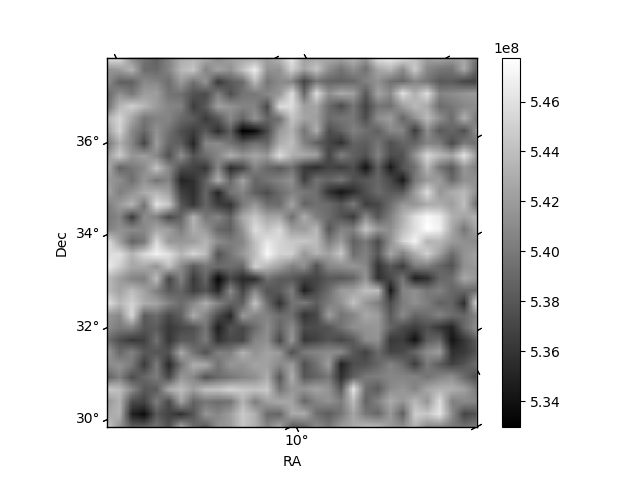
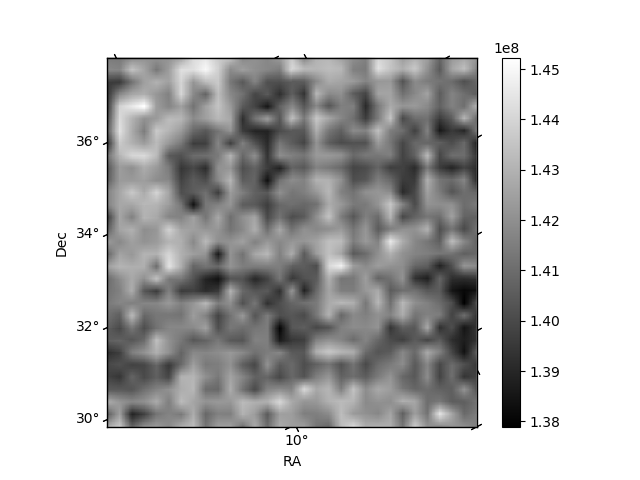
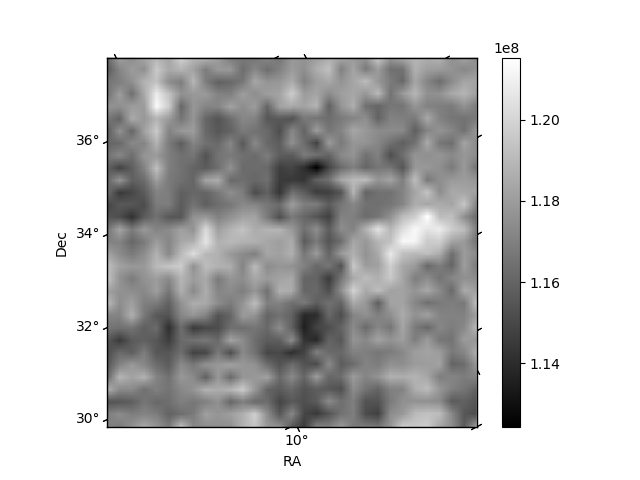
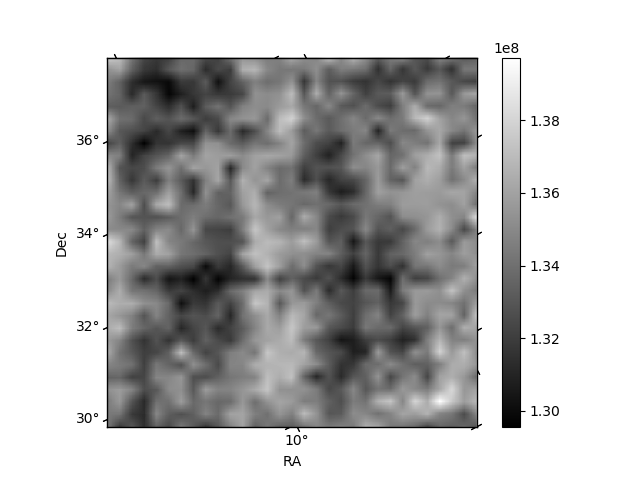
Histogram calculated using DETX and DETY for each event in the final _common_clean file
| Quadrant A | 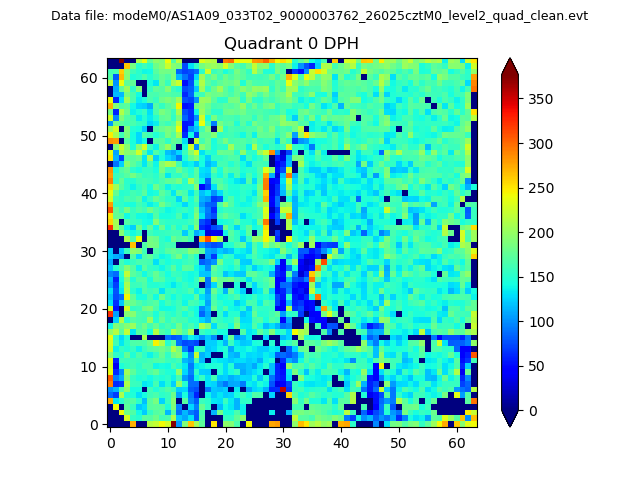 |
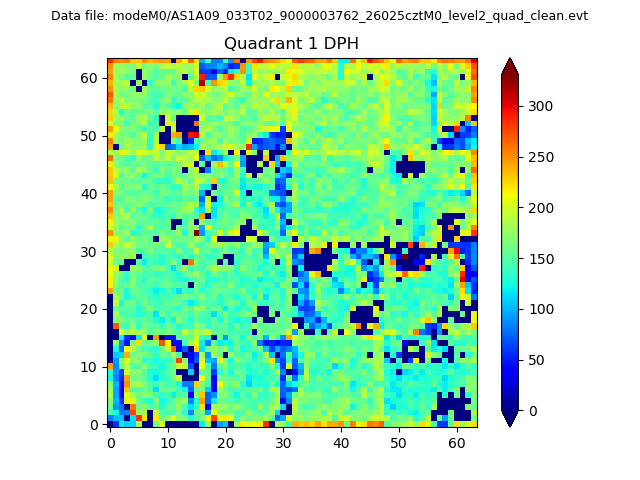 |
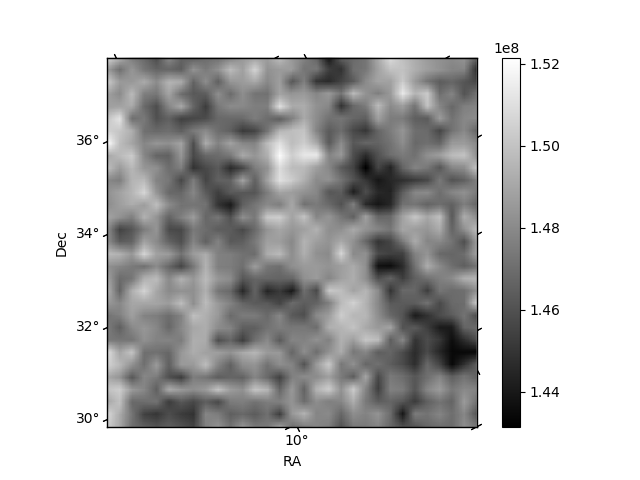
Quadrant B |
|---|---|---|---|
| Quadrant D | 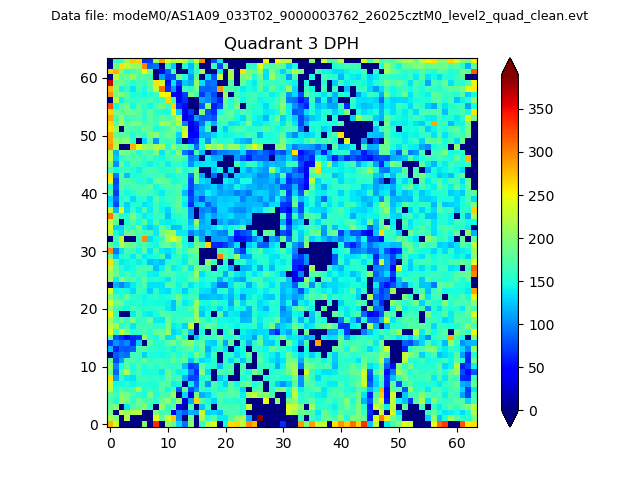 |
 |
Quadrant C |
| Plot type | Count rate plots | Images |
|---|---|---|
| Comparison with Poisson distribution Blue bars denote a histogram of data divided into 1 sec bins. Red curve is a Poisson curve with rate = median count rate of data. |
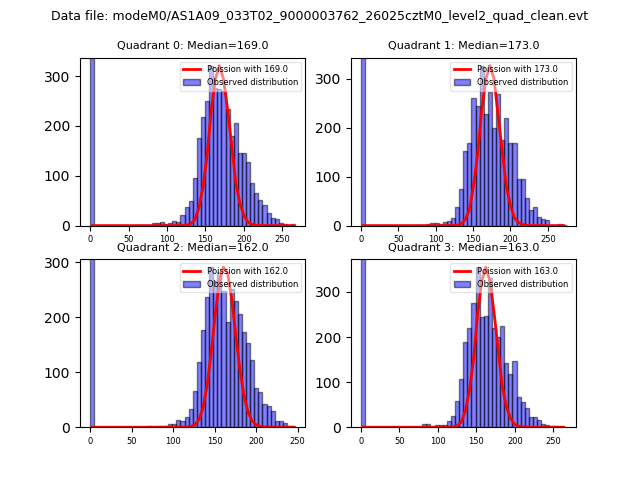 |
 |
| Quadrant-wise count rates Data is divided into 100 sec bins |
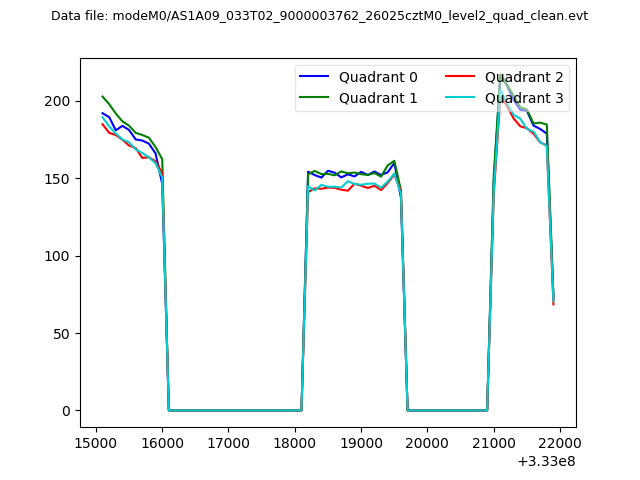 |
|
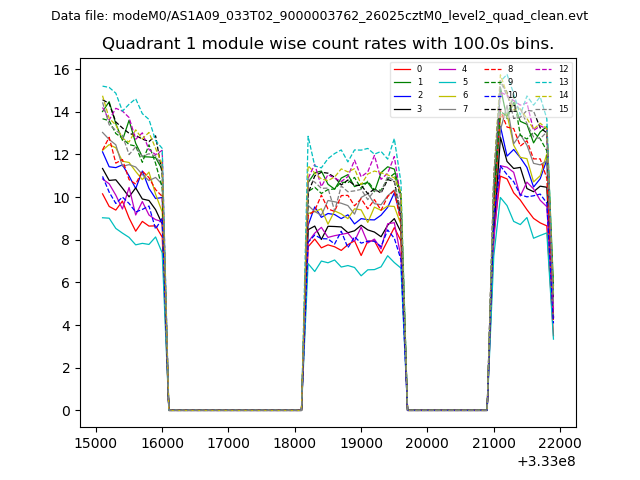
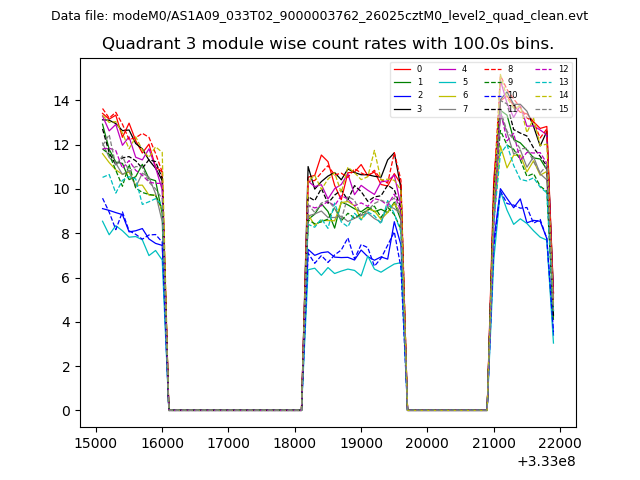
| Module-wise count rates for Quadrant A Data is divided into 100 sec bins |
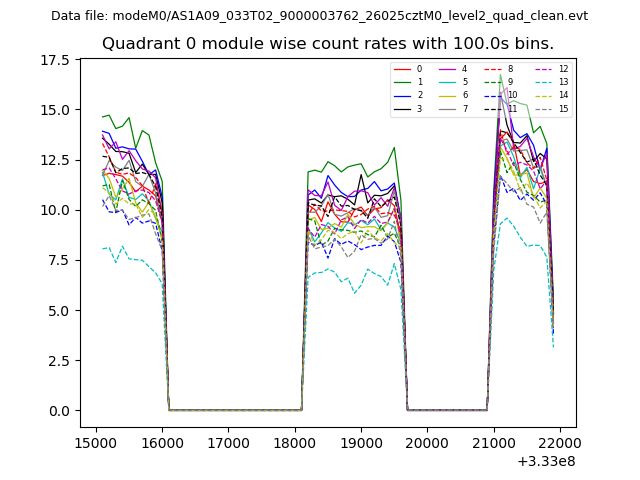 |
 |
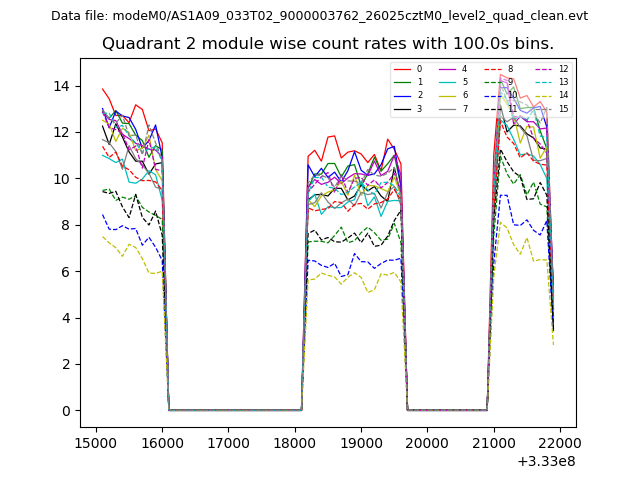
| Module-wise count rates for Quadrant B Data is divided into 100 sec bins |
 |
 |
| Module-wise count rates for Quadrant C Data is divided into 100 sec bins |
 |
 |
| Module-wise count rates for Quadrant D Data is divided into 100 sec bins |
 |
 |
| Parameter | Plot |
|---|---|
| CZT HV Monitor | 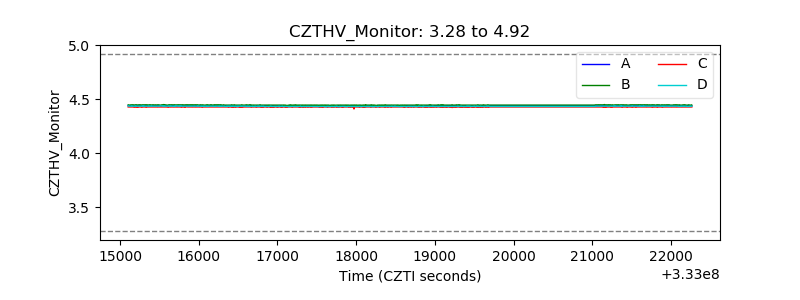 |
| D_VDD | 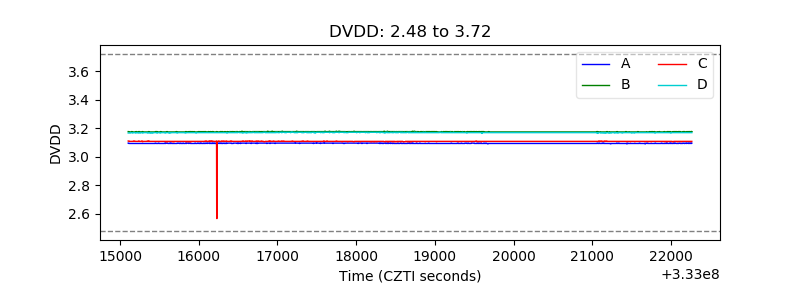 |
| Temperature 1 | 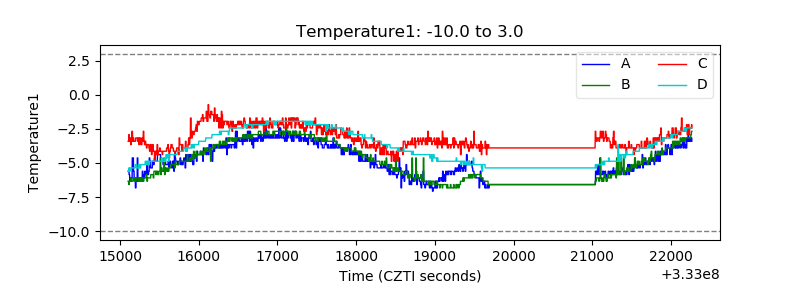 |
| Veto HV Monitor | 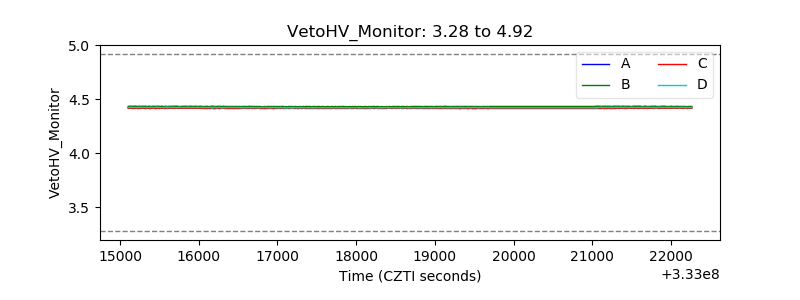 |
| Veto LLD | 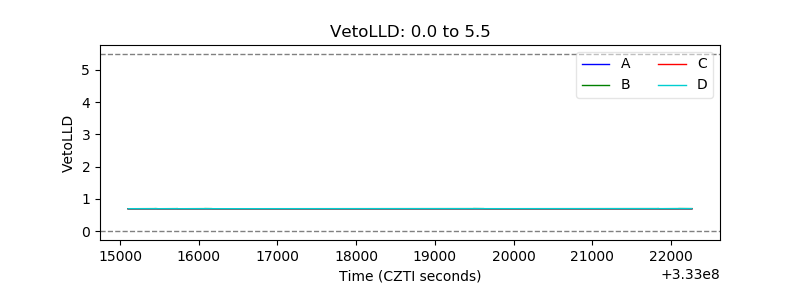 |
| Alpha Counter |  |
| _CPM_Rate | 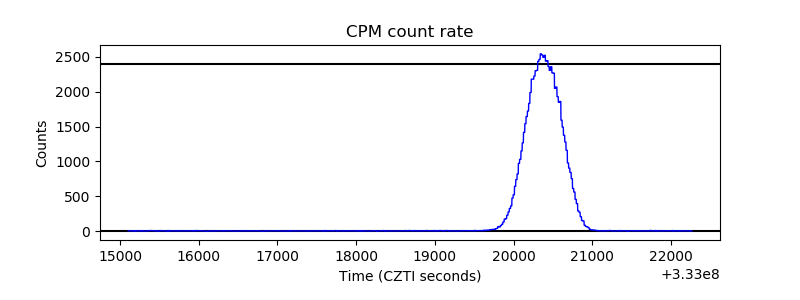 |
| CZT Counter | 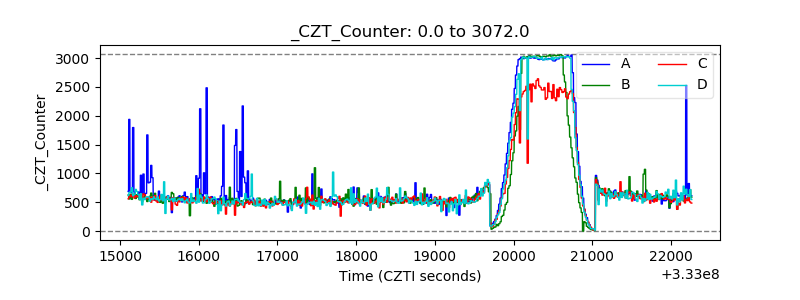 |
| +2.5 Volts monitor |  |
| +5 Volts monitor |  |
| _ROLL_ROT | 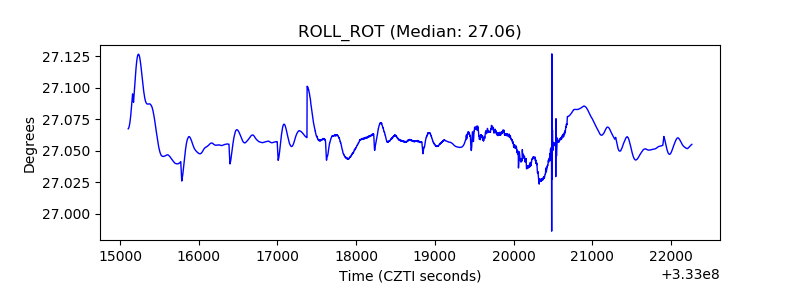 |
| _Roll_DEC | 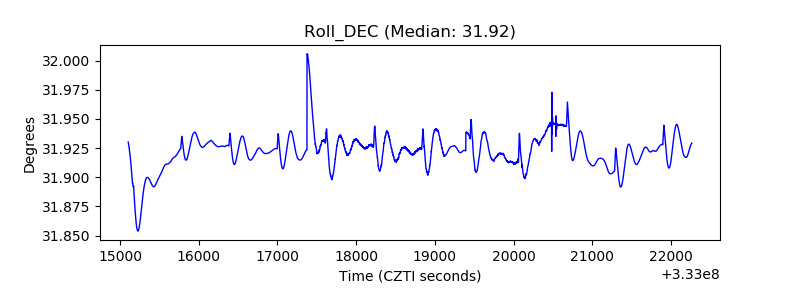 |
| _Roll_RA |  |
| Veto Counter | 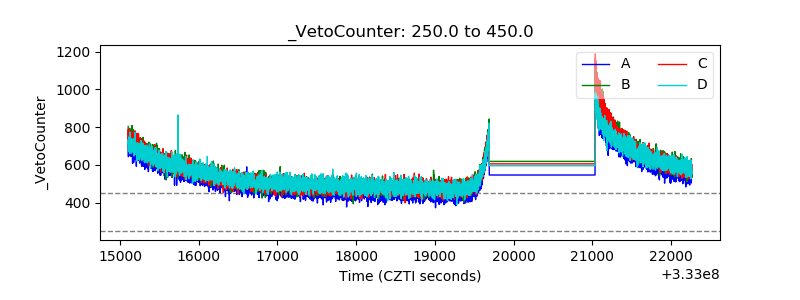 |