| Param | Original file | Final file |
|---|---|---|
| Filename | modeM0/AS1A09_033T02_9000003762_26026cztM0_level2.evt | modeM0/AS1A09_033T02_9000003762_26026cztM0_level2_quad_clean.evt |
| Size (bytes) | 514,929,600 | 87,672,960 |
| Size | 491.1 MB | 83.6 MB |
| Events in quadrant A | 3,706,356 | 564,177 |
| Events in quadrant B | 3,791,438 | 563,726 |
| Events in quadrant C | 3,578,698 | 535,670 |
| Events in quadrant D | 4,076,293 | 537,039 |
| Mode M9 | |||
|---|---|---|---|
| Quadrant | BADHDUFLAG | Total packets | Discarded packets |
| A | 0 | 15 | 0 |
| B | 0 | 16 | 0 |
| C | 0 | 16 | 0 |
| D | 0 | 16 | 0 |
| Mode M0 | |||
|---|---|---|---|
| Quadrant | BADHDUFLAG | Total packets | Discarded packets |
| A | 0 | 14883 | 0 |
| B | 0 | 15170 | 0 |
| C | 0 | 14280 | 0 |
| D | 0 | 16128 | 0 |
| Quadrant | Total seconds | Saturated seconds | Saturation percentage |
|---|---|---|---|
| A | 6516 | 107 | 1.642112% |
| B | 6516 | 144 | 2.209945% |
| C | 6516 | 121 | 1.856967% |
| D | 6516 | 202 | 3.100061% |
Noise dominated data is calculated using 1-second bins in cleaned event files. If a bin has >2000 counts, and if more than 50% of those come from <1% of pixels, then it is considered to be noise-dominated and hence unusable.
| Quadrant | # 1 sec bins | Bins with >0 counts | Bins with >2000 counts | High rate bins dominated by noise | Noise dominated (total time) | Noise dominated (detector-on time) | Marked lightcurve |
|---|---|---|---|---|---|---|---|
| A | 7866 | 6516 | 11 | 11 | 0.14% | 0.17% | 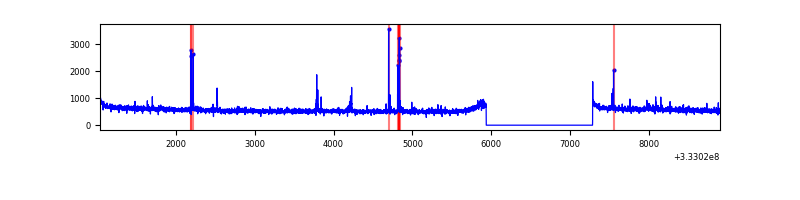 |
| B | 7866 | 6516 | 43 | 43 | 0.55% | 0.66% | 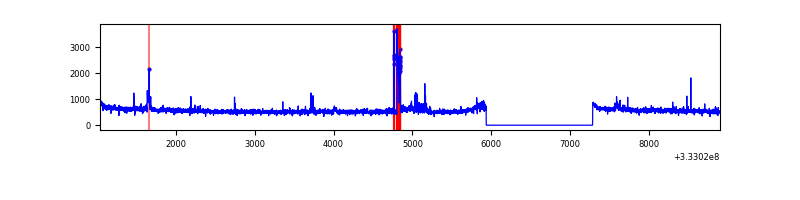 |
| C | 7866 | 6516 | 0 | 0 | 0.00% | 0.00% | 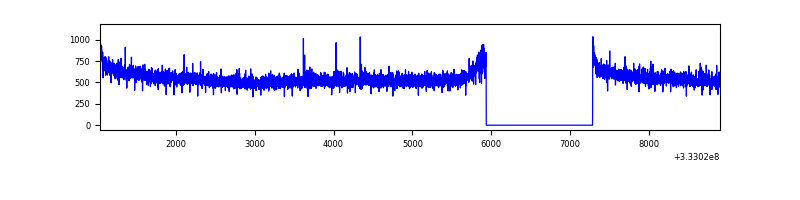 |
| D | 7866 | 6516 | 101 | 101 | 1.28% | 1.55% | 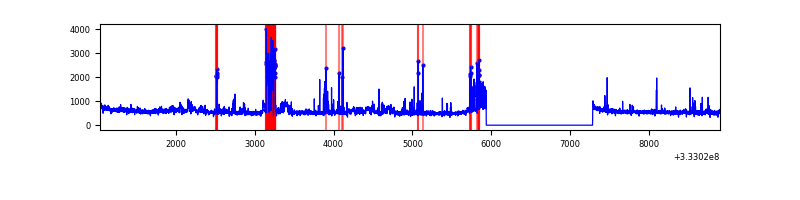 |
Top three noisy pixels from each quadrant. If the there are fewer than three noisy pixels in the level2.evt file, extra rows are filled as -1
| Pixel properties | Quadrant properties | ||||||
|---|---|---|---|---|---|---|---|
| Quadrant | DetID | PixID | Counts | Sigma | Mean | Median | Sigma |
| A | 0 | 13 | 85094 | 457.31 | 938 | 923 | 184.1 |
| A | 8 | 255 | 9314 | 45.59 | 938 | 923 | 184.1 |
| A | 13 | 254 | 9251 | 45.24 | 938 | 923 | 184.1 |
| B | 0 | 229 | 184809 | 1073.2 | 912 | 894 | 171.4 |
| B | 10 | 245 | 31330 | 177.6 | 912 | 894 | 171.4 |
| B | 12 | 111 | 19676 | 109.6 | 912 | 894 | 171.4 |
| C | 14 | 238 | 146310 | 725.02 | 877 | 885 | 200.6 |
| C | 3 | 233 | 10087 | 45.88 | 877 | 885 | 200.6 |
| C | 2 | 16 | 6705 | 29.02 | 877 | 885 | 200.6 |
| D | 1 | 52 | 436543 | 2018.31 | 900 | 882 | 215.9 |
| D | 7 | 223 | 177163 | 816.67 | 900 | 882 | 215.9 |
| D | 2 | 234 | 24622 | 109.98 | 900 | 882 | 215.9 |
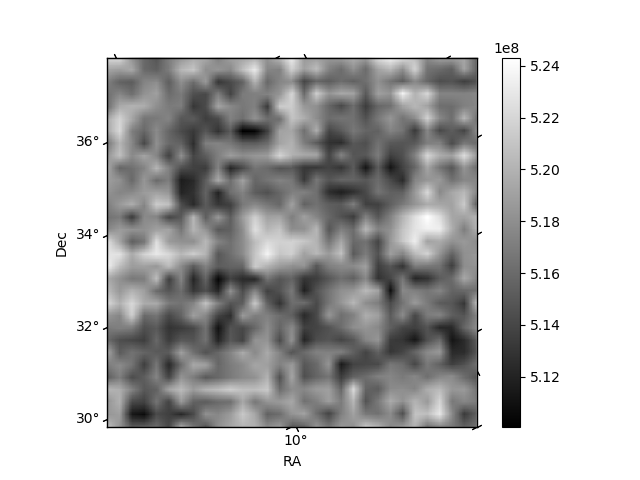
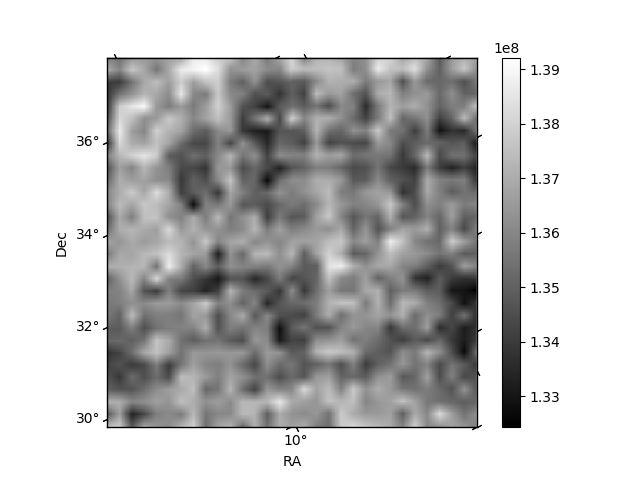
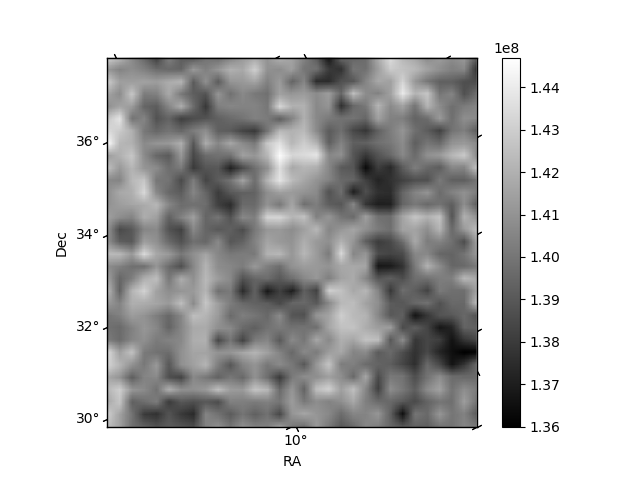
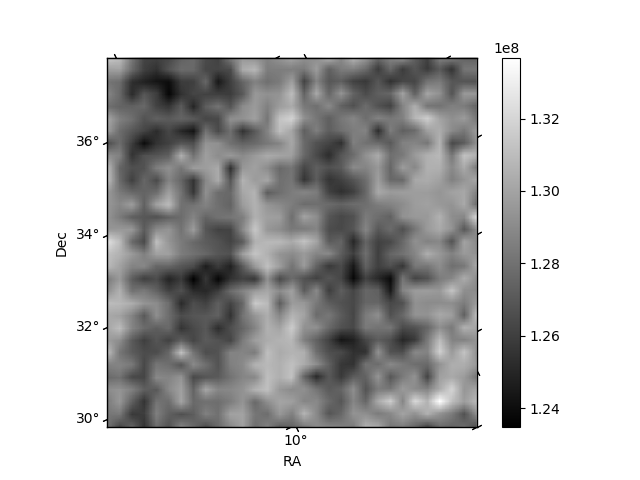
Histogram calculated using DETX and DETY for each event in the final _common_clean file
| Quadrant A | 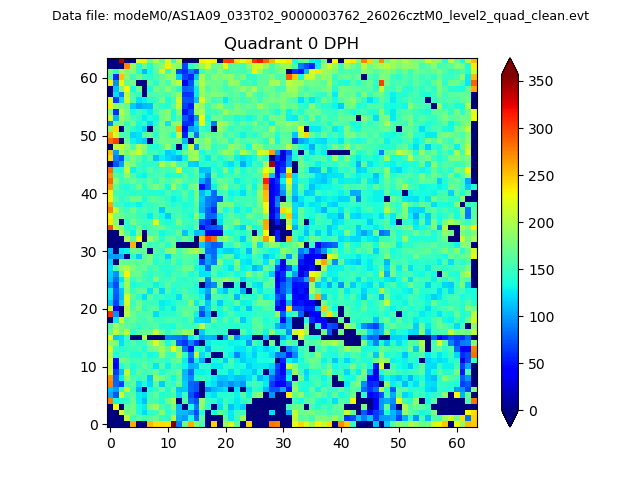 |
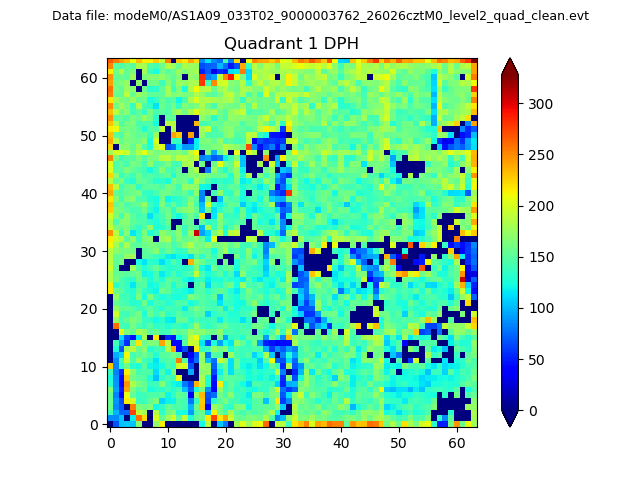 |
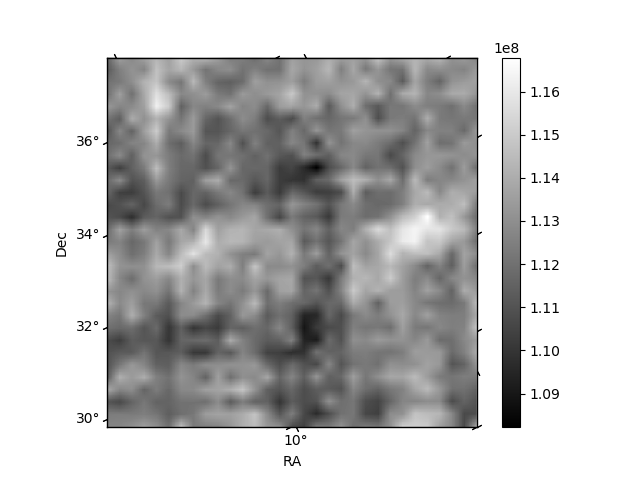
Quadrant B |
|---|---|---|---|
| Quadrant D |  |
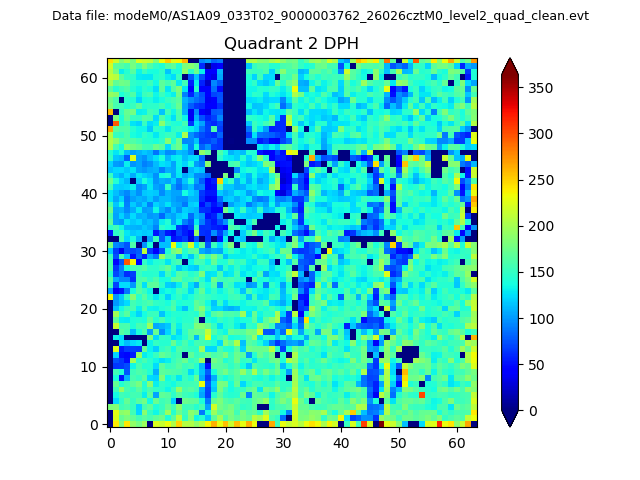 |
Quadrant C |
| Plot type | Count rate plots | Images |
|---|---|---|
| Comparison with Poisson distribution Blue bars denote a histogram of data divided into 1 sec bins. Red curve is a Poisson curve with rate = median count rate of data. |
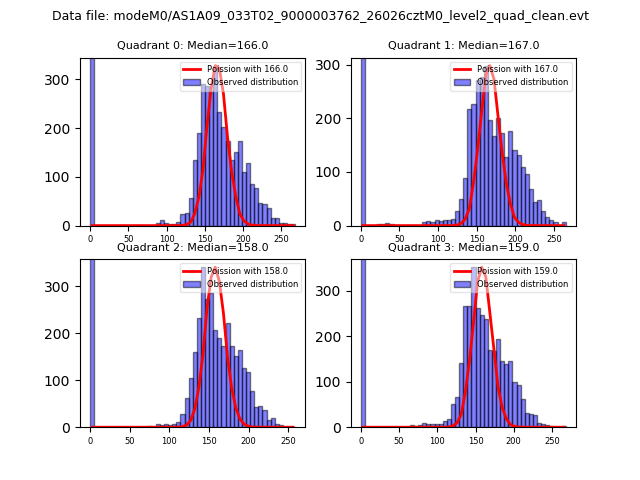 |
 |
| Quadrant-wise count rates Data is divided into 100 sec bins |
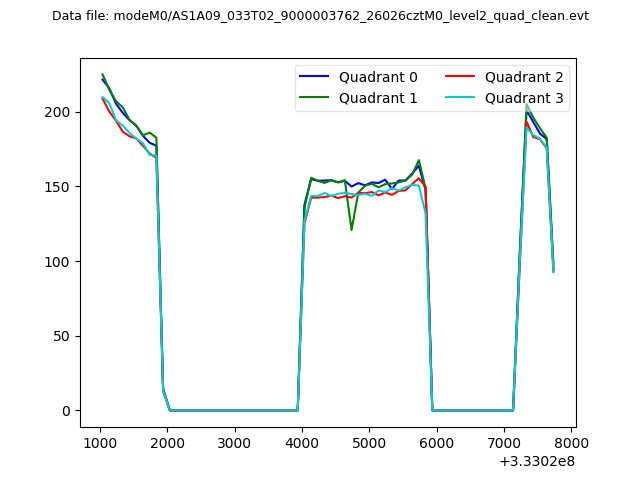 |
|
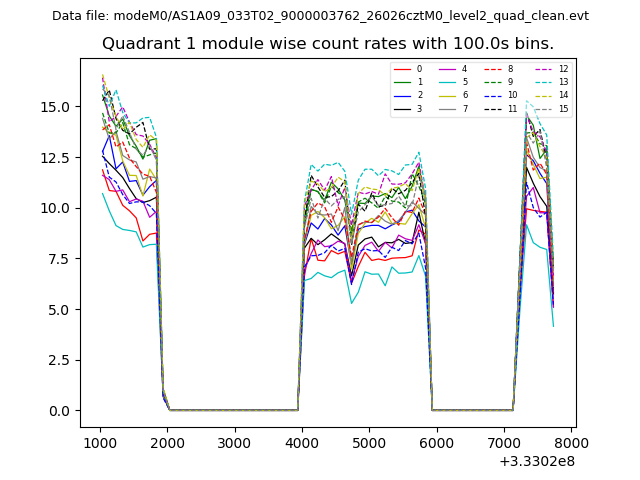
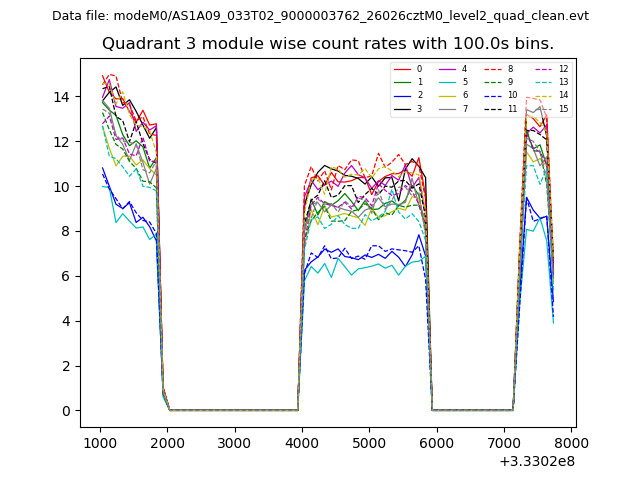
| Module-wise count rates for Quadrant A Data is divided into 100 sec bins |
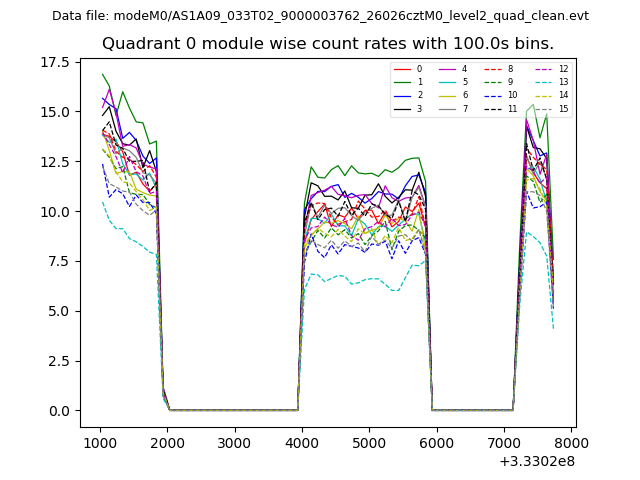 |
 |
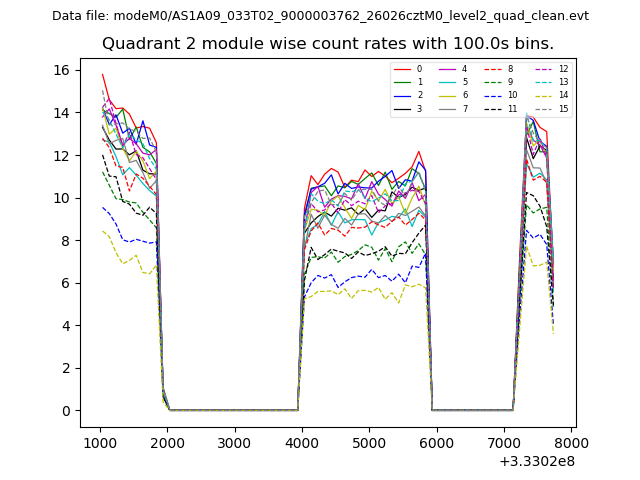
| Module-wise count rates for Quadrant B Data is divided into 100 sec bins |
 |
 |
| Module-wise count rates for Quadrant C Data is divided into 100 sec bins |
 |
 |
| Module-wise count rates for Quadrant D Data is divided into 100 sec bins |
 |
 |
| Parameter | Plot |
|---|---|
| CZT HV Monitor | 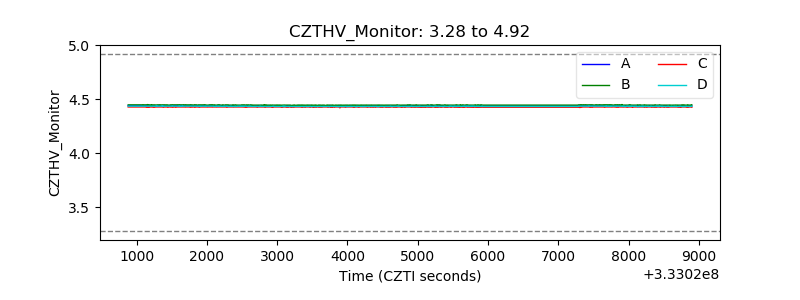 |
| D_VDD | 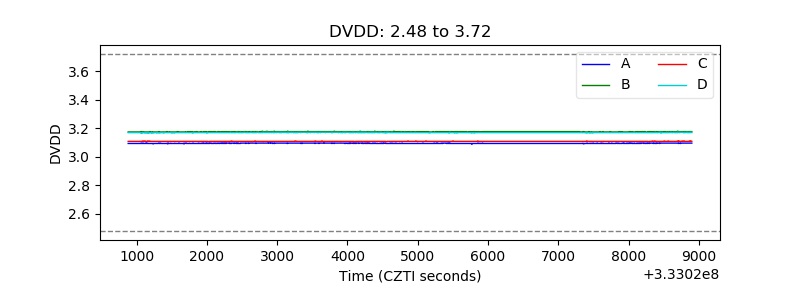 |
| Temperature 1 | 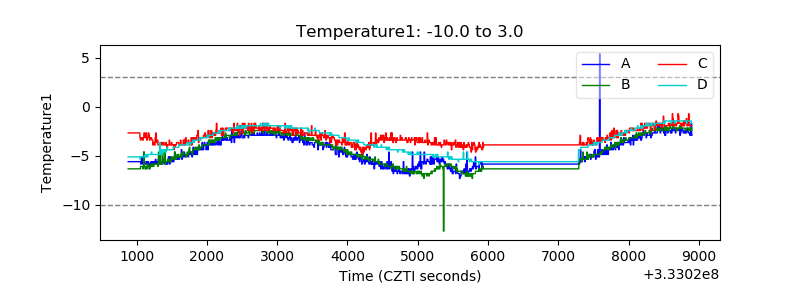 |
| Veto HV Monitor |  |
| Veto LLD | 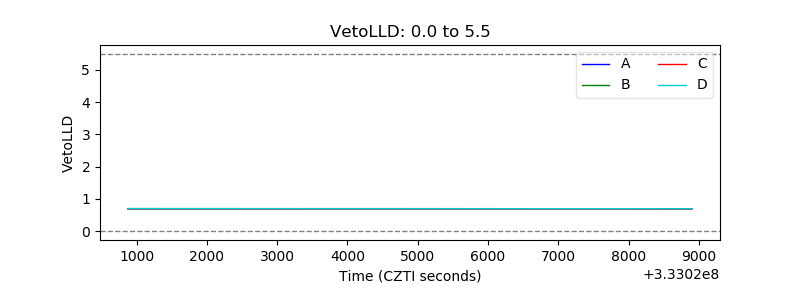 |
| Alpha Counter | 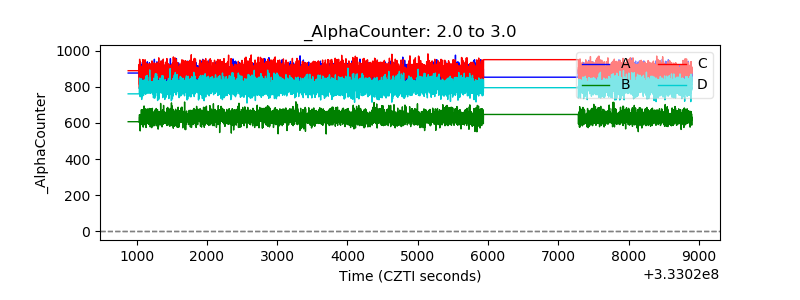 |
| _CPM_Rate | 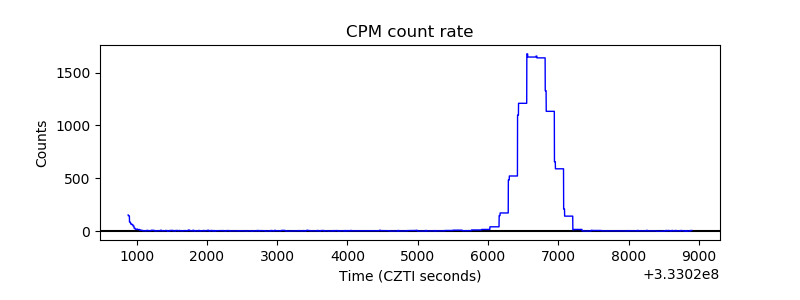 |
| CZT Counter |  |
| +2.5 Volts monitor |  |
| +5 Volts monitor |  |
| _ROLL_ROT | 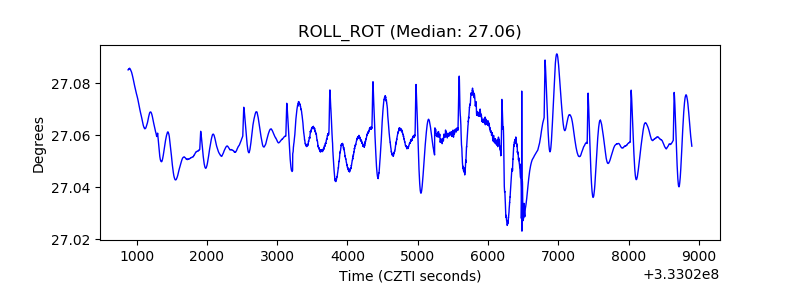 |
| _Roll_DEC | 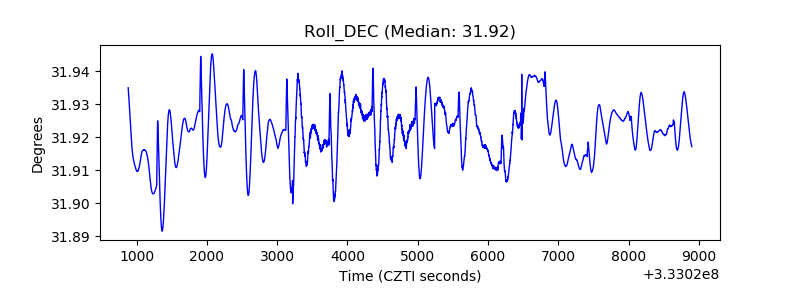 |
| _Roll_RA | 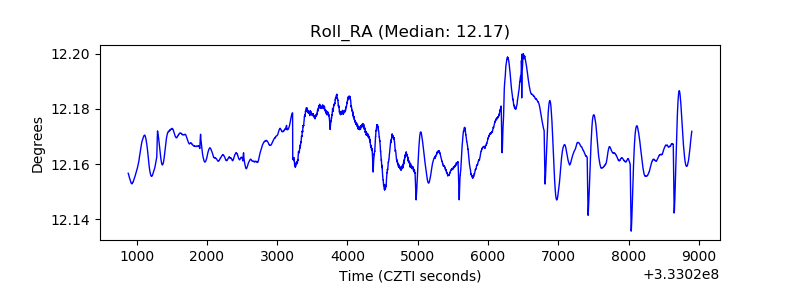 |
| Veto Counter | 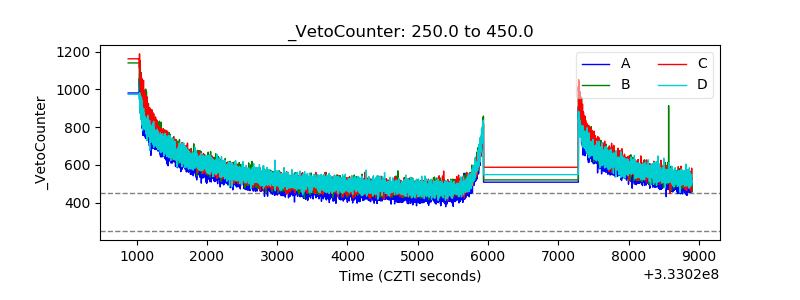 |