| Param | Original file | Final file |
|---|---|---|
| Filename | modeM0/AS1A09_033T02_9000003762_26027cztM0_level2.evt | modeM0/AS1A09_033T02_9000003762_26027cztM0_level2_quad_clean.evt |
| Size (bytes) | 490,688,640 | 73,028,160 |
| Size | 468.0 MB | 69.6 MB |
| Events in quadrant A | 3,832,600 | 447,985 |
| Events in quadrant B | 3,523,421 | 450,725 |
| Events in quadrant C | 3,457,303 | 427,999 |
| Events in quadrant D | 3,606,359 | 431,396 |
| Mode M9 | |||
|---|---|---|---|
| Quadrant | BADHDUFLAG | Total packets | Discarded packets |
| A | 0 | 12 | 0 |
| B | 0 | 12 | 0 |
| C | 0 | 12 | 0 |
| D | 0 | 12 | 0 |
| Mode M0 | |||
|---|---|---|---|
| Quadrant | BADHDUFLAG | Total packets | Discarded packets |
| A | 0 | 15162 | 0 |
| B | 0 | 14141 | 0 |
| C | 0 | 13823 | 0 |
| D | 0 | 14390 | 0 |
| Quadrant | Total seconds | Saturated seconds | Saturation percentage |
|---|---|---|---|
| A | 6493 | 189 | 2.910827% |
| B | 6494 | 117 | 1.801663% |
| C | 6494 | 132 | 2.032646% |
| D | 6494 | 80 | 1.231906% |
Noise dominated data is calculated using 1-second bins in cleaned event files. If a bin has >2000 counts, and if more than 50% of those come from <1% of pixels, then it is considered to be noise-dominated and hence unusable.
| Quadrant | # 1 sec bins | Bins with >0 counts | Bins with >2000 counts | High rate bins dominated by noise | Noise dominated (total time) | Noise dominated (detector-on time) | Marked lightcurve |
|---|---|---|---|---|---|---|---|
| A | 7728 | 6493 | 61 | 61 | 0.79% | 0.94% | 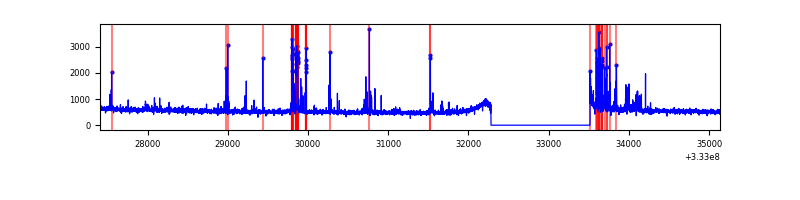 |
| B | 7729 | 6494 | 2 | 2 | 0.03% | 0.03% | 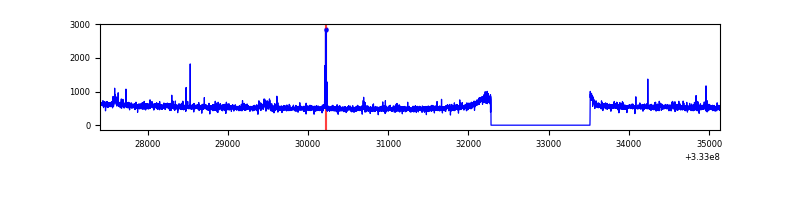 |
| C | 7729 | 6495 | 0 | 0 | 0.00% | 0.00% | 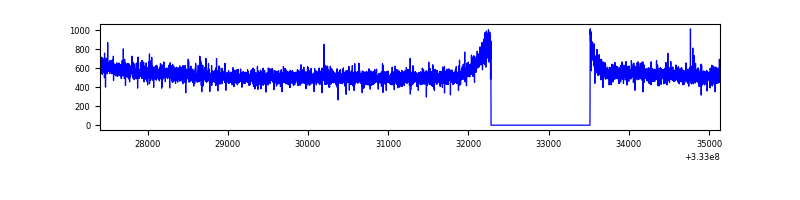 |
| D | 7729 | 6494 | 4 | 4 | 0.05% | 0.06% | 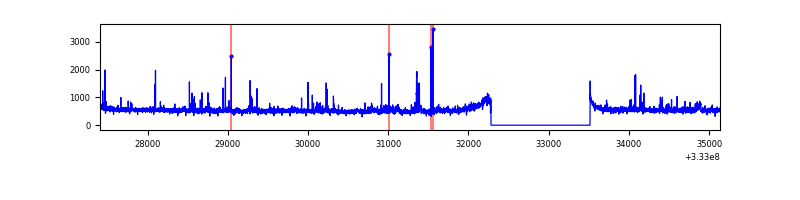 |
Top three noisy pixels from each quadrant. If the there are fewer than three noisy pixels in the level2.evt file, extra rows are filled as -1
| Pixel properties | Quadrant properties | ||||||
|---|---|---|---|---|---|---|---|
| Quadrant | DetID | PixID | Counts | Sigma | Mean | Median | Sigma |
| A | 0 | 13 | 378753 | 2115.18 | 896 | 880 | 178.6 |
| A | 13 | 254 | 9100 | 46.01 | 896 | 880 | 178.6 |
| A | 0 | 226 | 7851 | 39.02 | 896 | 880 | 178.6 |
| B | 0 | 229 | 28376 | 166.29 | 879 | 861 | 165.5 |
| B | 0 | 190 | 27942 | 163.66 | 879 | 861 | 165.5 |
| B | 5 | 172 | 21350 | 123.83 | 879 | 861 | 165.5 |
| C | 14 | 238 | 140023 | 712.65 | 848 | 852 | 195.3 |
| C | 3 | 233 | 12720 | 60.77 | 848 | 852 | 195.3 |
| C | 13 | 61 | 5934 | 26.02 | 848 | 852 | 195.3 |
| D | 1 | 52 | 173855 | 807.7 | 873 | 855 | 214.2 |
| D | 7 | 223 | 49157 | 225.51 | 873 | 855 | 214.2 |
| D | 13 | 168 | 27822 | 125.9 | 873 | 855 | 214.2 |
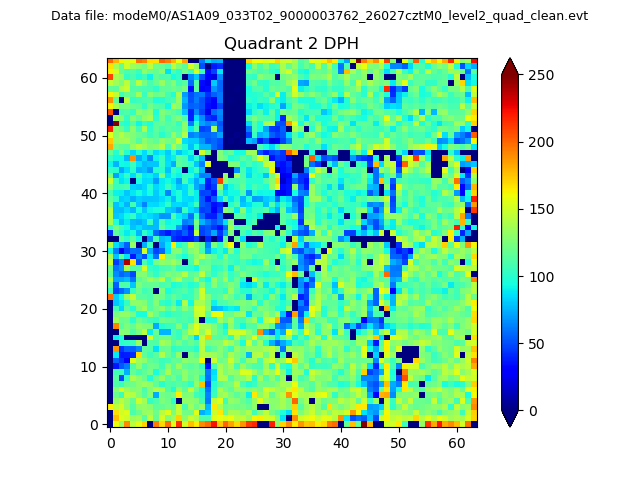
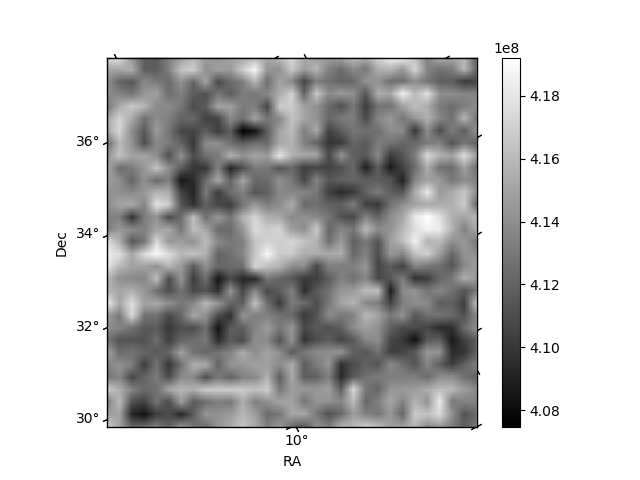
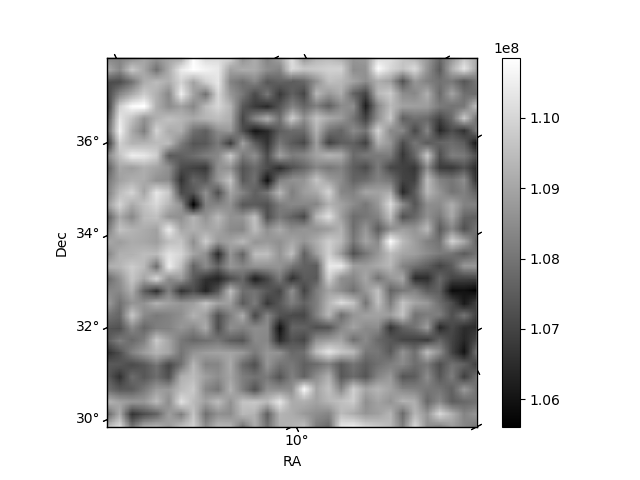
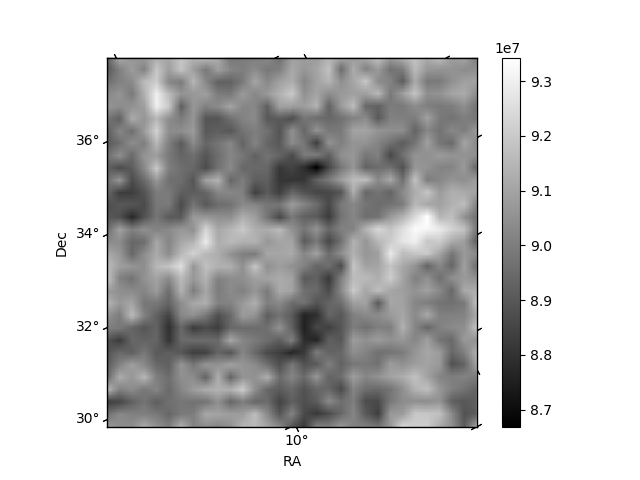
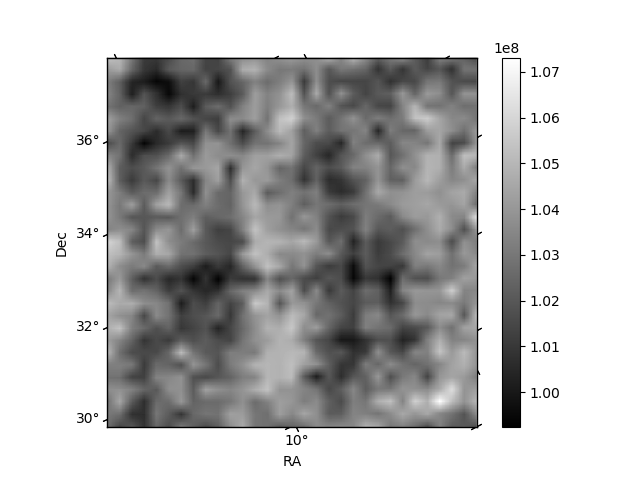
Histogram calculated using DETX and DETY for each event in the final _common_clean file
| Quadrant A | 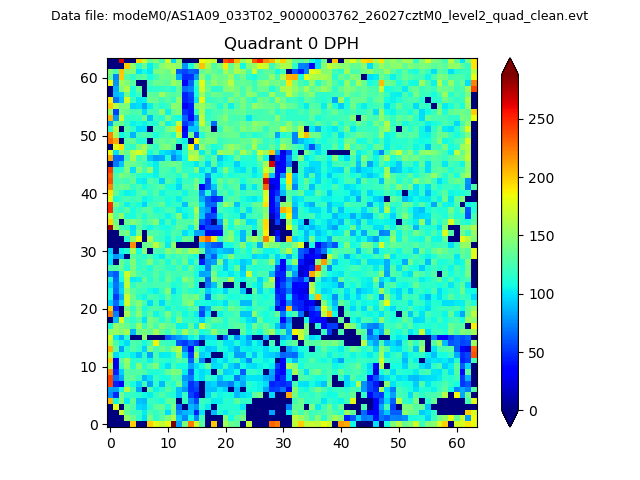 |
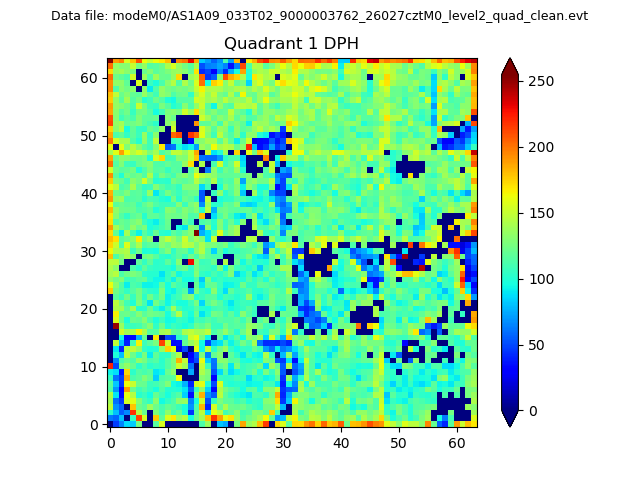 |
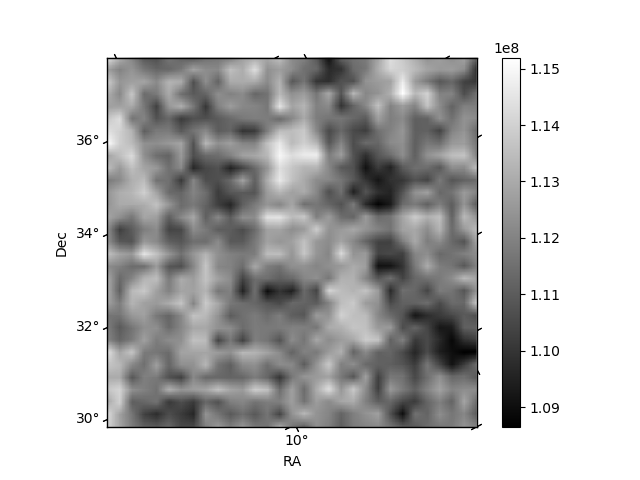
Quadrant B |
|---|---|---|---|
| Quadrant D | 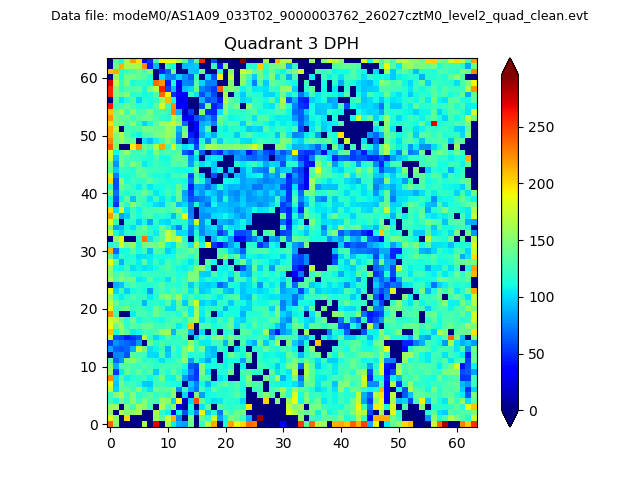 |
 |
Quadrant C |
| Plot type | Count rate plots | Images |
|---|---|---|
| Comparison with Poisson distribution Blue bars denote a histogram of data divided into 1 sec bins. Red curve is a Poisson curve with rate = median count rate of data. |
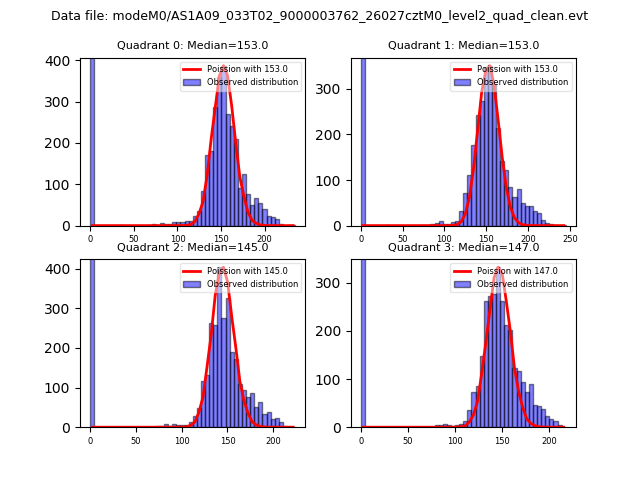 |
 |
| Quadrant-wise count rates Data is divided into 100 sec bins |
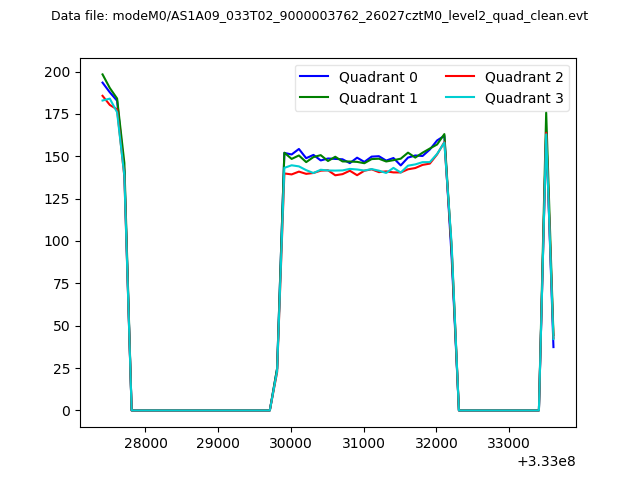 |
|
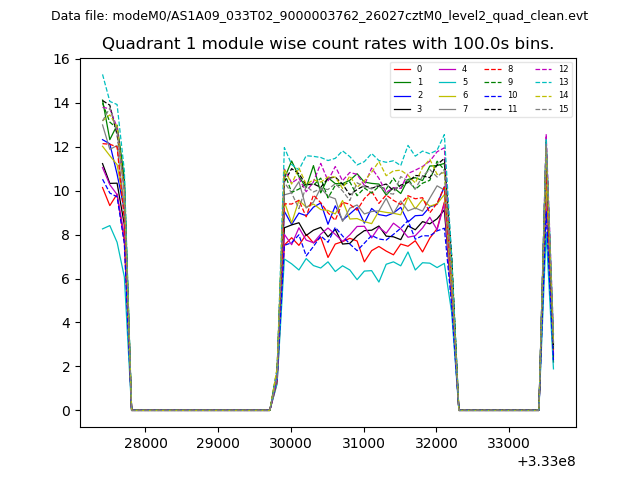
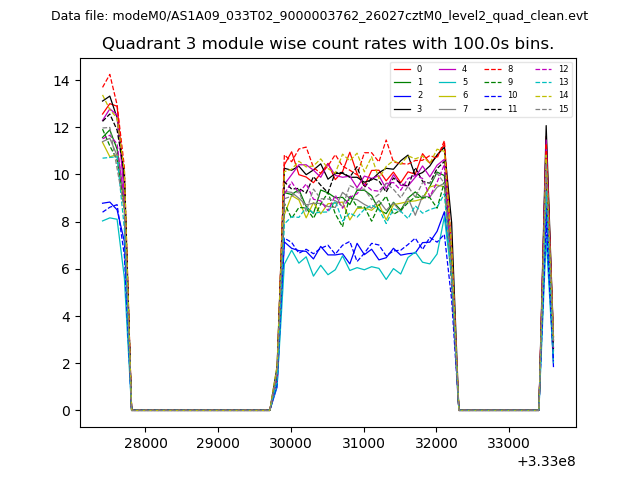
| Module-wise count rates for Quadrant A Data is divided into 100 sec bins |
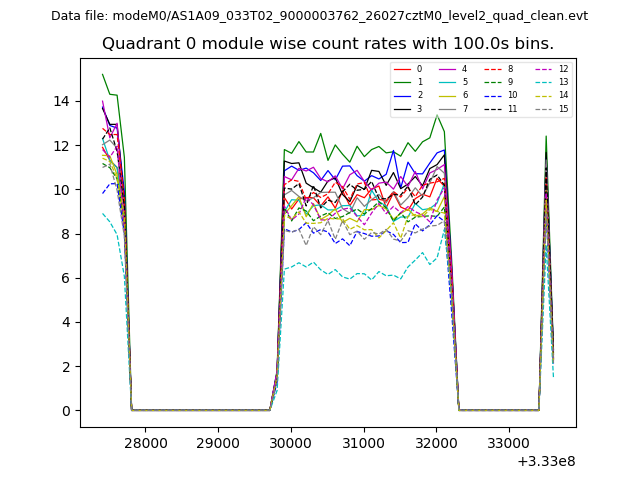 |
 |
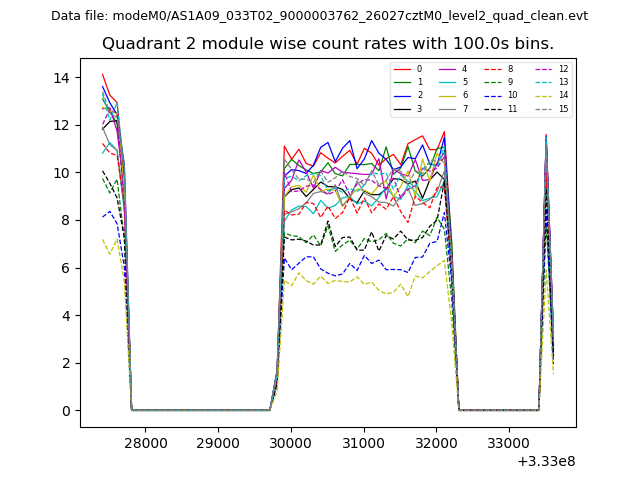
| Module-wise count rates for Quadrant B Data is divided into 100 sec bins |
 |
 |
| Module-wise count rates for Quadrant C Data is divided into 100 sec bins |
 |
 |
| Module-wise count rates for Quadrant D Data is divided into 100 sec bins |
 |
 |
| Parameter | Plot |
|---|---|
| CZT HV Monitor | 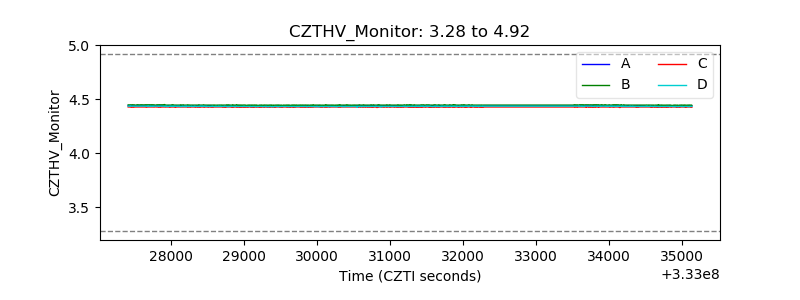 |
| D_VDD | 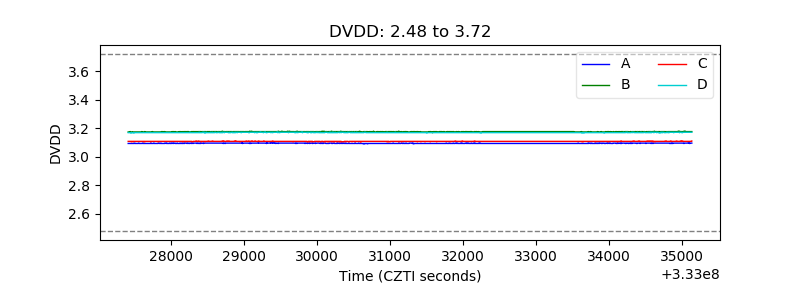 |
| Temperature 1 | 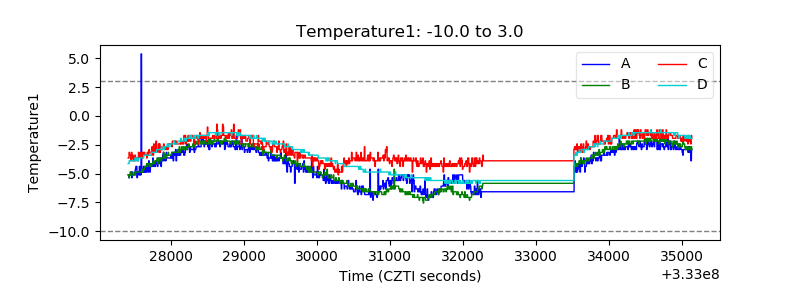 |
| Veto HV Monitor | 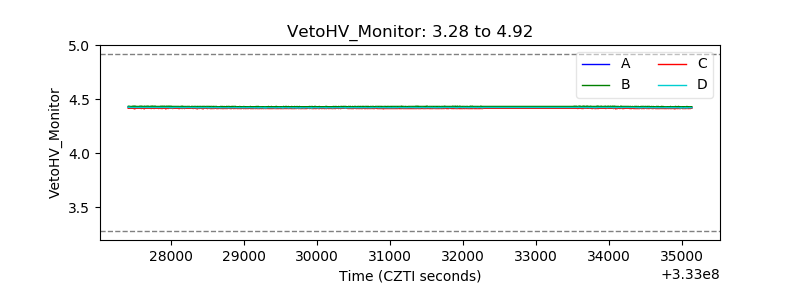 |
| Veto LLD | 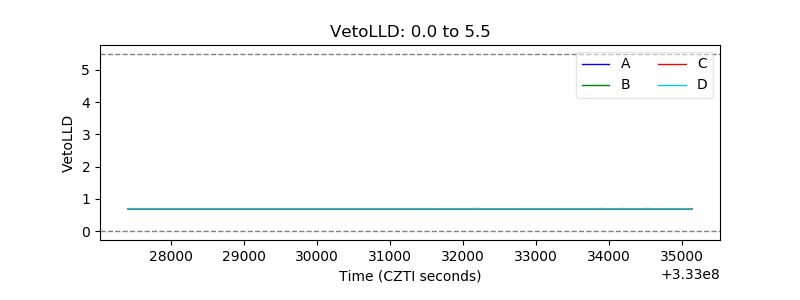 |
| Alpha Counter | 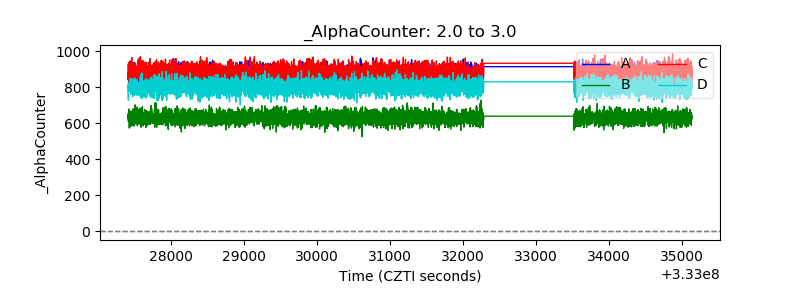 |
| _CPM_Rate | 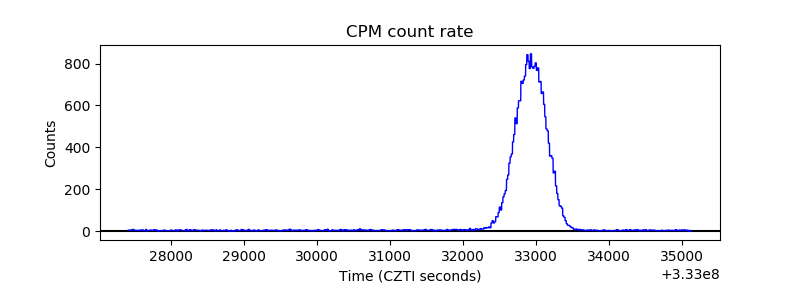 |
| CZT Counter | 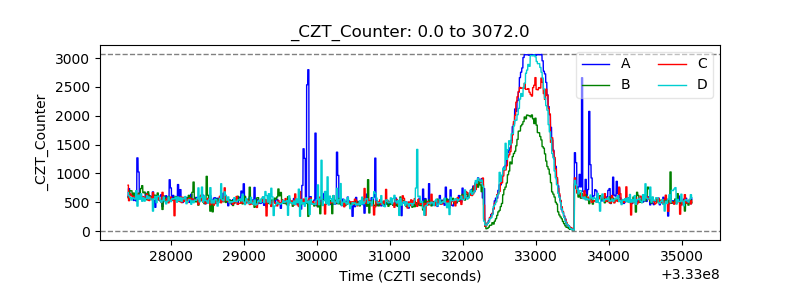 |
| +2.5 Volts monitor |  |
| +5 Volts monitor | 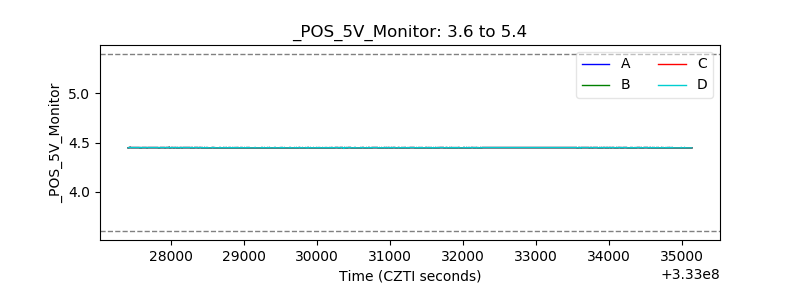 |
| _ROLL_ROT | 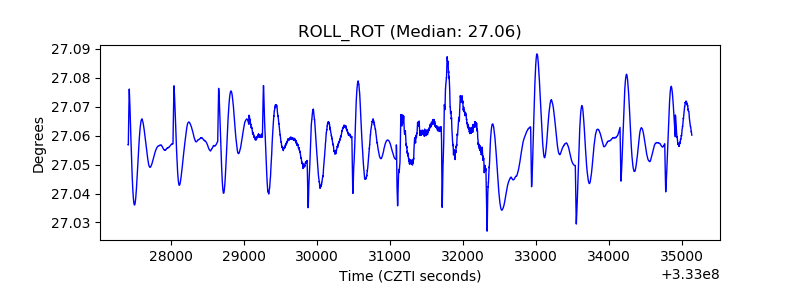 |
| _Roll_DEC | 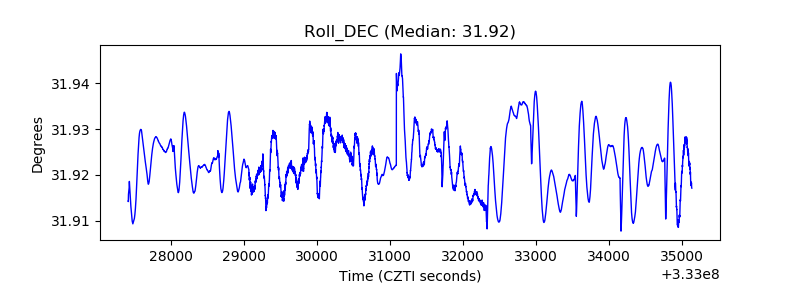 |
| _Roll_RA | 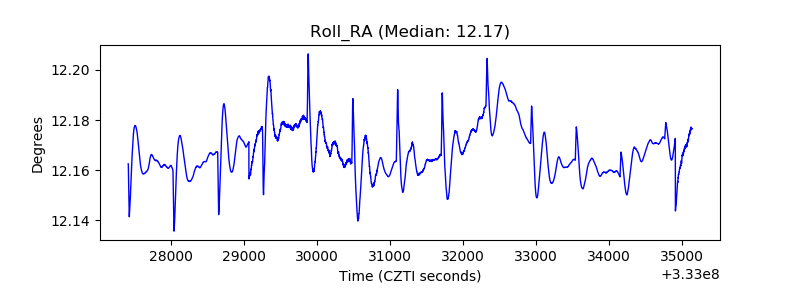 |
| Veto Counter | 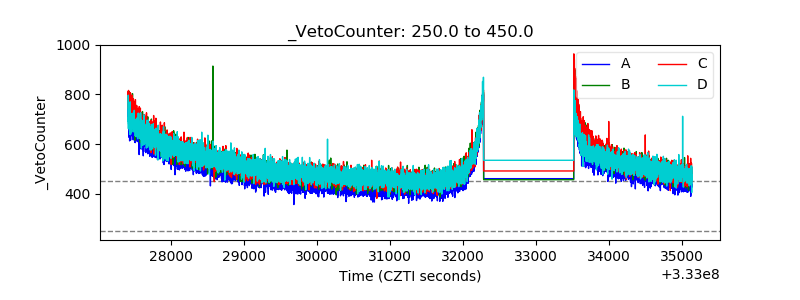 |