| Param | Original file | Final file |
|---|---|---|
| Filename | modeM0/AS1A09_033T02_9000003762_26029cztM0_level2.evt | modeM0/AS1A09_033T02_9000003762_26029cztM0_level2_quad_clean.evt |
| Size (bytes) | 498,565,440 | 82,454,400 |
| Size | 475.5 MB | 78.6 MB |
| Events in quadrant A | 3,559,631 | 506,868 |
| Events in quadrant B | 3,627,914 | 511,097 |
| Events in quadrant C | 3,575,863 | 488,331 |
| Events in quadrant D | 3,847,800 | 490,329 |
| Mode M9 | |||
|---|---|---|---|
| Quadrant | BADHDUFLAG | Total packets | Discarded packets |
| A | 0 | 10 | 0 |
| B | 0 | 11 | 0 |
| C | 0 | 11 | 0 |
| D | 0 | 11 | 0 |
| Mode M0 | |||
|---|---|---|---|
| Quadrant | BADHDUFLAG | Total packets | Discarded packets |
| A | 0 | 14931 | 0 |
| B | 0 | 15089 | 0 |
| C | 0 | 14927 | 0 |
| D | 0 | 15992 | 0 |
| Quadrant | Total seconds | Saturated seconds | Saturation percentage |
|---|---|---|---|
| A | 7182 | 106 | 1.475912% |
| B | 7182 | 127 | 1.768310% |
| C | 7182 | 145 | 2.018936% |
| D | 7182 | 85 | 1.183514% |
Noise dominated data is calculated using 1-second bins in cleaned event files. If a bin has >2000 counts, and if more than 50% of those come from <1% of pixels, then it is considered to be noise-dominated and hence unusable.
| Quadrant | # 1 sec bins | Bins with >0 counts | Bins with >2000 counts | High rate bins dominated by noise | Noise dominated (total time) | Noise dominated (detector-on time) | Marked lightcurve |
|---|---|---|---|---|---|---|---|
| A | 7722 | 7182 | 0 | 0 | 0.00% | 0.00% | 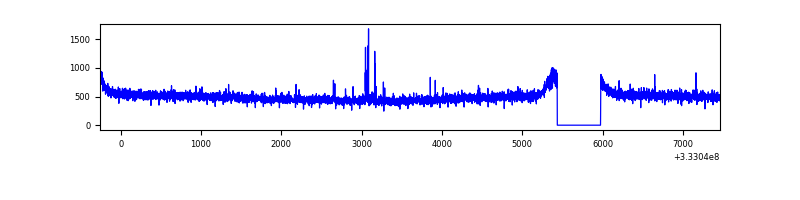 |
| B | 7722 | 7182 | 2 | 2 | 0.03% | 0.03% | 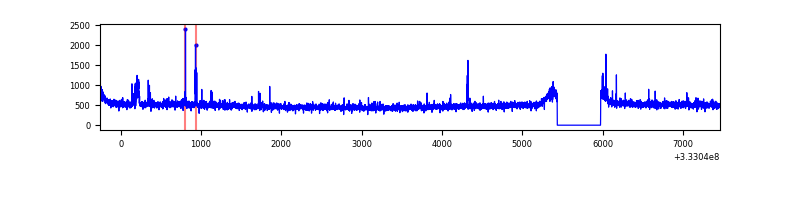 |
| C | 7722 | 7182 | 0 | 0 | 0.00% | 0.00% | 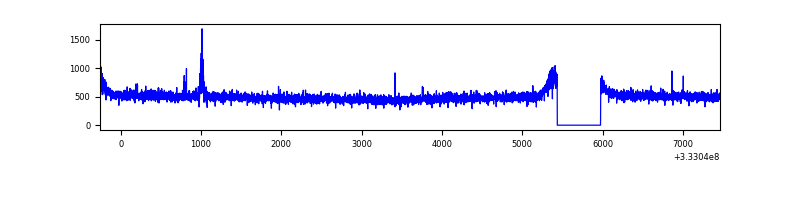 |
| D | 7722 | 7182 | 6 | 6 | 0.08% | 0.08% | 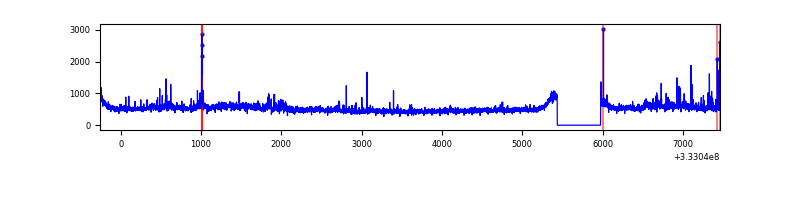 |
Top three noisy pixels from each quadrant. If the there are fewer than three noisy pixels in the level2.evt file, extra rows are filled as -1
| Pixel properties | Quadrant properties | ||||||
|---|---|---|---|---|---|---|---|
| Quadrant | DetID | PixID | Counts | Sigma | Mean | Median | Sigma |
| A | 0 | 13 | 22819 | 119.03 | 917 | 899 | 184.2 |
| A | 13 | 254 | 10468 | 51.96 | 917 | 899 | 184.2 |
| A | 3 | 137 | 8531 | 41.44 | 917 | 899 | 184.2 |
| B | 0 | 190 | 43703 | 245.82 | 903 | 879 | 174.2 |
| B | 0 | 229 | 35189 | 196.95 | 903 | 879 | 174.2 |
| B | 12 | 111 | 21027 | 115.65 | 903 | 879 | 174.2 |
| C | 14 | 238 | 141022 | 688.81 | 872 | 878 | 203.5 |
| C | 3 | 233 | 38409 | 184.47 | 872 | 878 | 203.5 |
| C | 13 | 61 | 6174 | 26.03 | 872 | 878 | 203.5 |
| D | 1 | 52 | 228316 | 1004.42 | 887 | 863 | 226.5 |
| D | 7 | 223 | 132758 | 582.44 | 887 | 863 | 226.5 |
| D | 1 | 3 | 50545 | 219.39 | 887 | 863 | 226.5 |
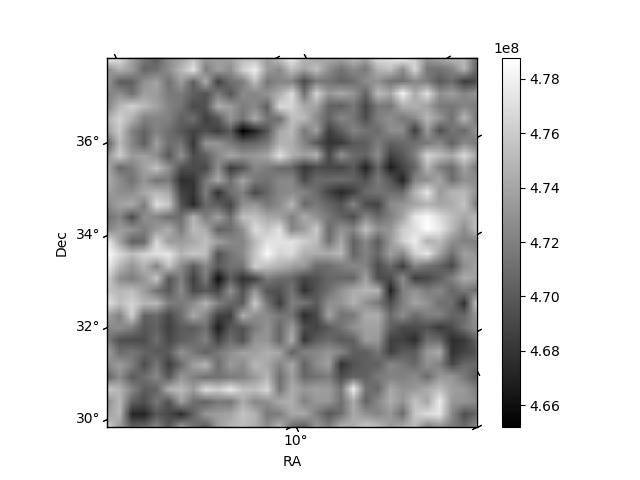
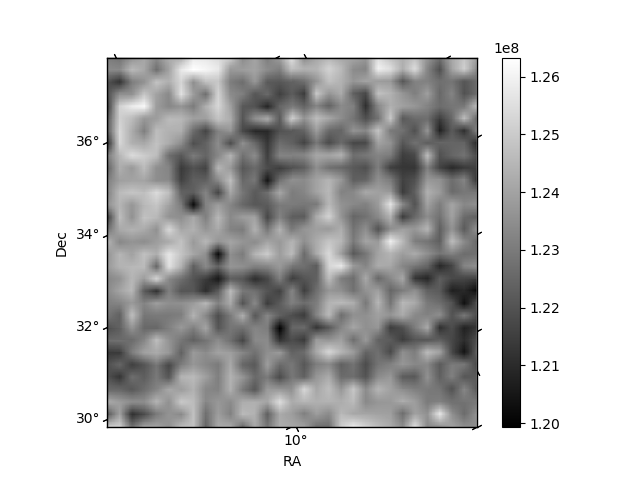
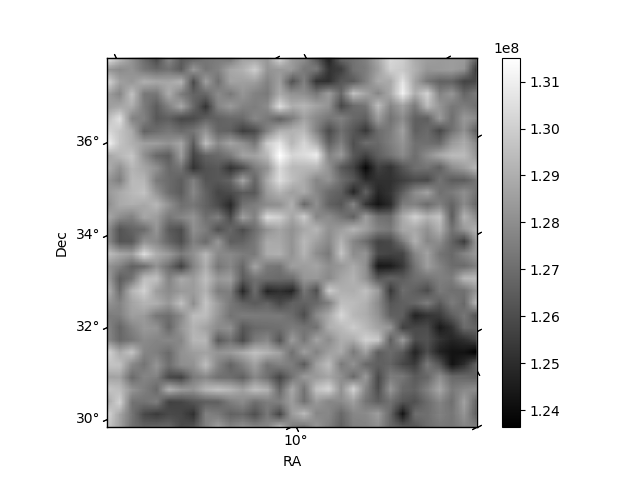
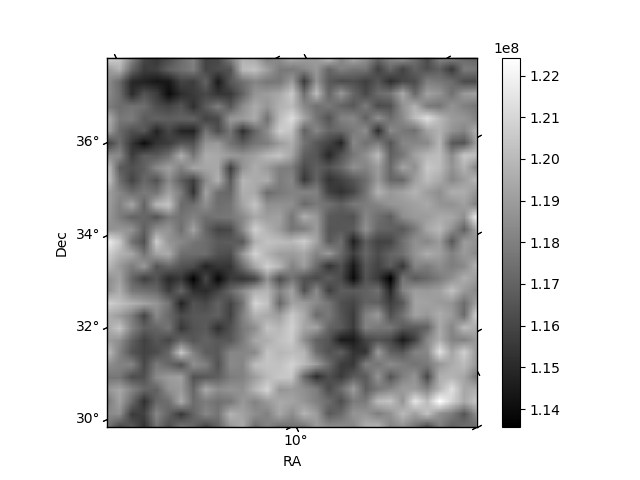
Histogram calculated using DETX and DETY for each event in the final _common_clean file
| Quadrant A | 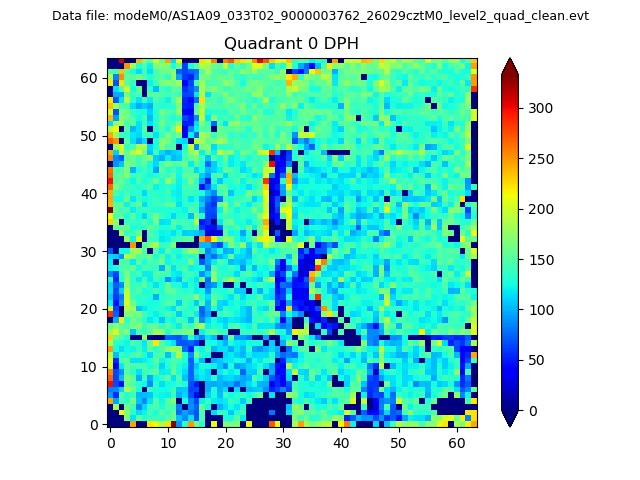 |
 |
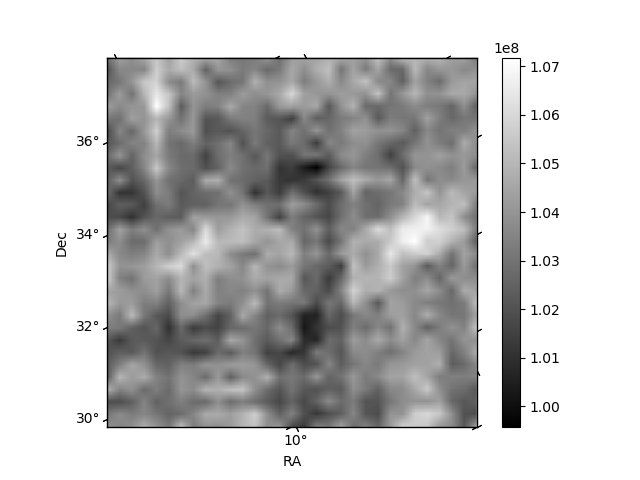
Quadrant B |
|---|---|---|---|
| Quadrant D | 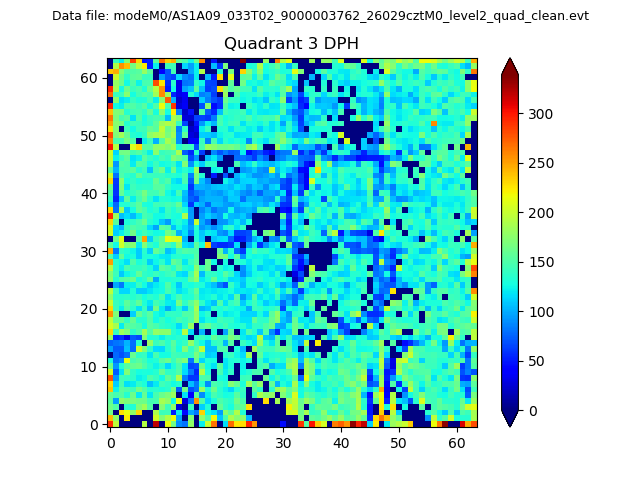 |
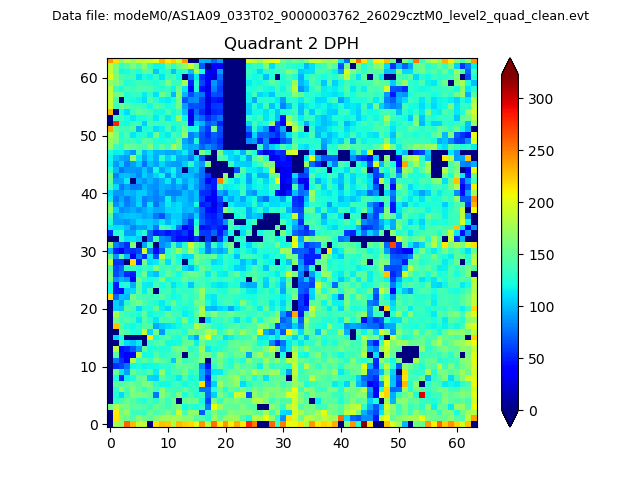 |
Quadrant C |
| Plot type | Count rate plots | Images |
|---|---|---|
| Comparison with Poisson distribution Blue bars denote a histogram of data divided into 1 sec bins. Red curve is a Poisson curve with rate = median count rate of data. |
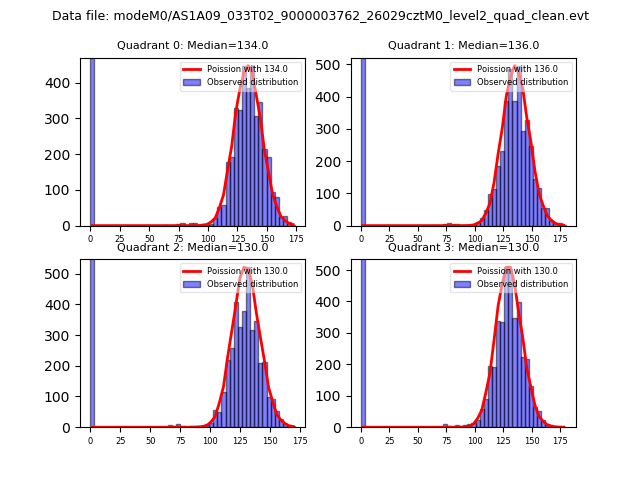 |
 |
| Quadrant-wise count rates Data is divided into 100 sec bins |
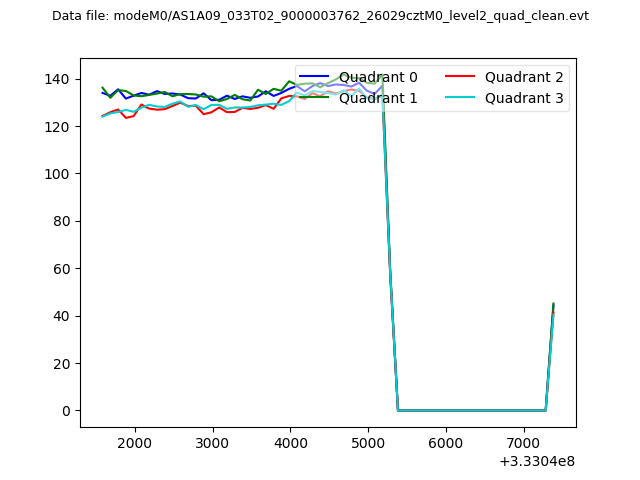 |
|
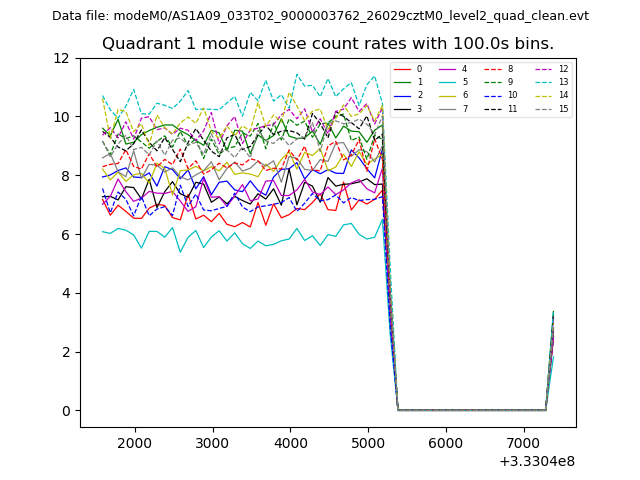
| Module-wise count rates for Quadrant A Data is divided into 100 sec bins |
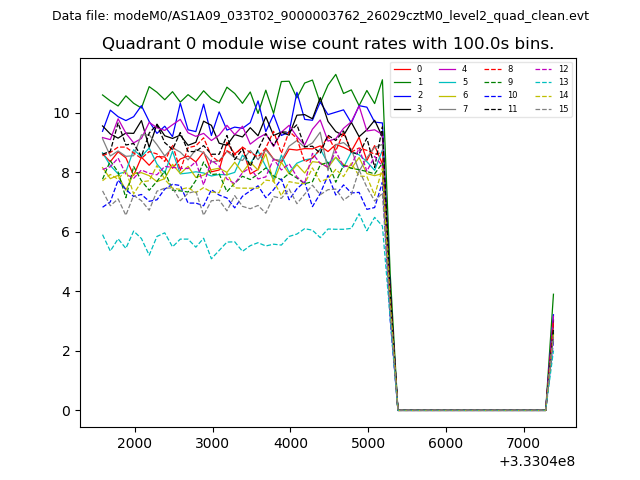 |
 |
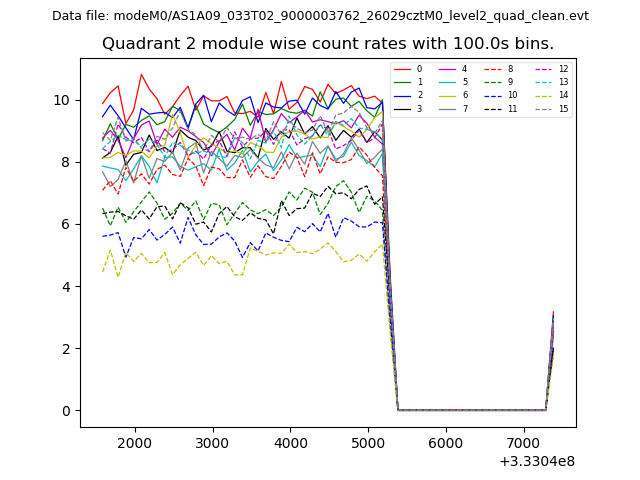
| Module-wise count rates for Quadrant B Data is divided into 100 sec bins |
 |
 |
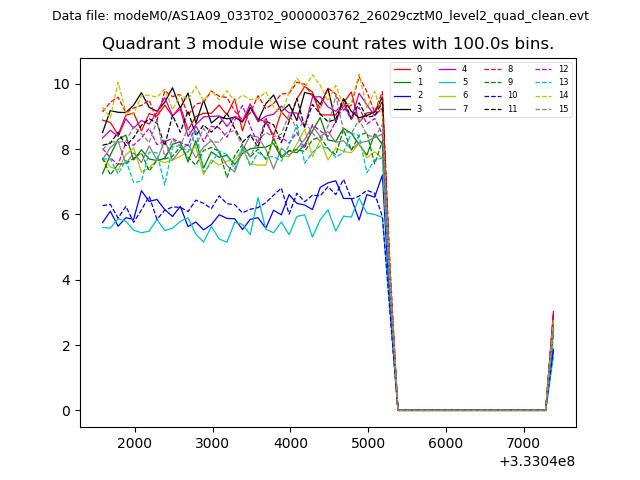
| Module-wise count rates for Quadrant C Data is divided into 100 sec bins |
 |
 |
| Module-wise count rates for Quadrant D Data is divided into 100 sec bins |
 |
 |
| Parameter | Plot |
|---|---|
| CZT HV Monitor | 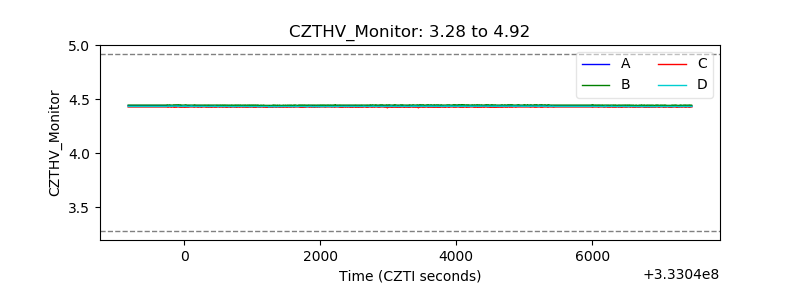 |
| D_VDD | 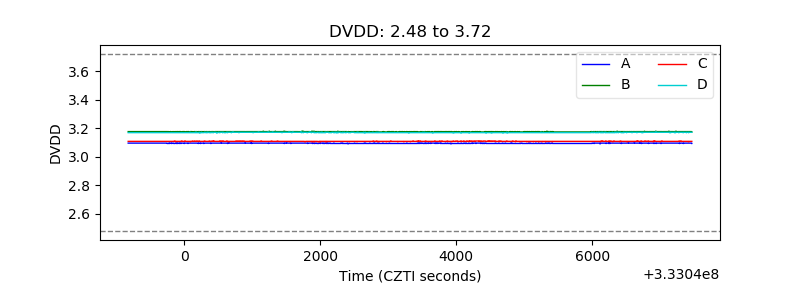 |
| Temperature 1 | 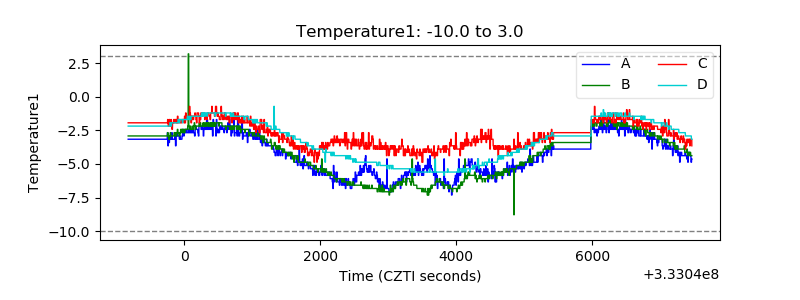 |
| Veto HV Monitor |  |
| Veto LLD | 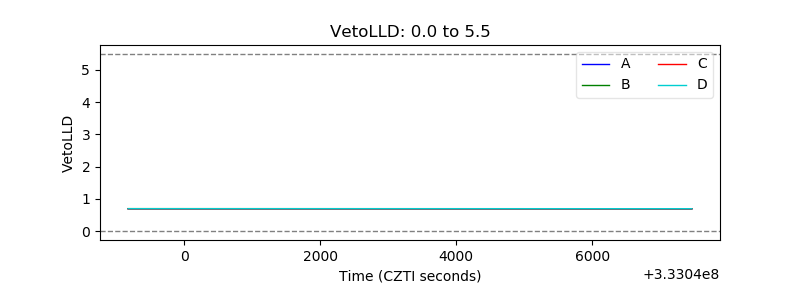 |
| Alpha Counter | 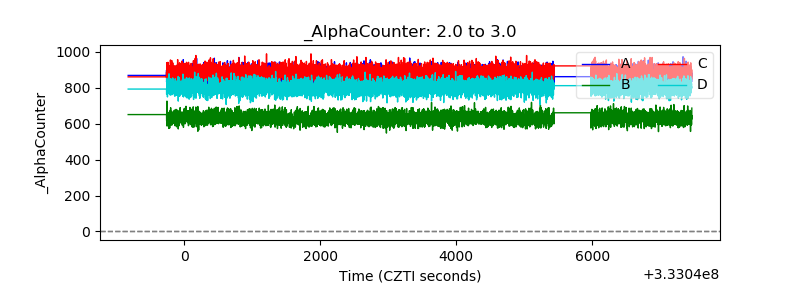 |
| _CPM_Rate |  |
| CZT Counter | 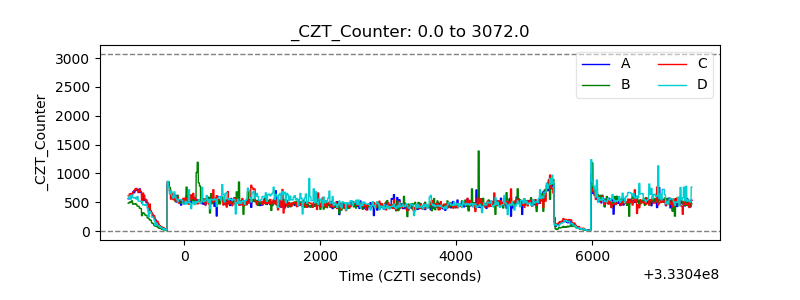 |
| +2.5 Volts monitor |  |
| +5 Volts monitor |  |
| _ROLL_ROT | 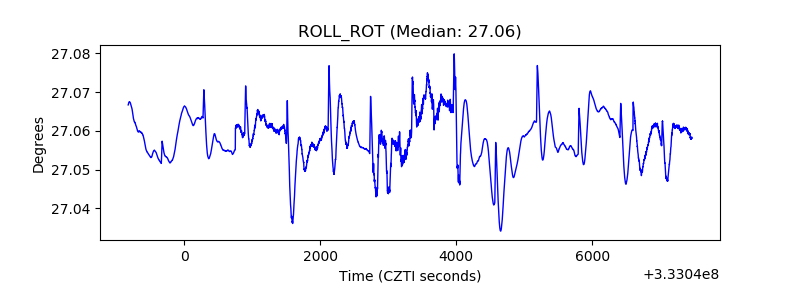 |
| _Roll_DEC |  |
| _Roll_RA | 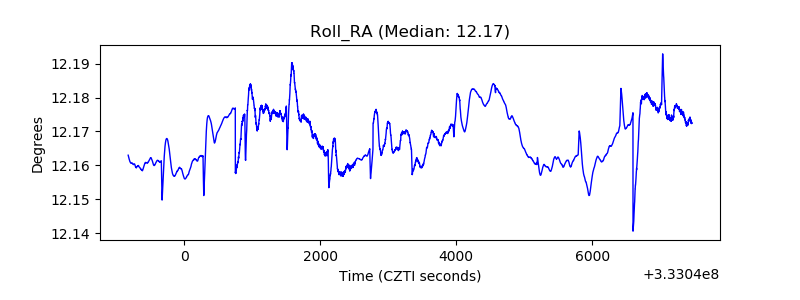 |
| Veto Counter | 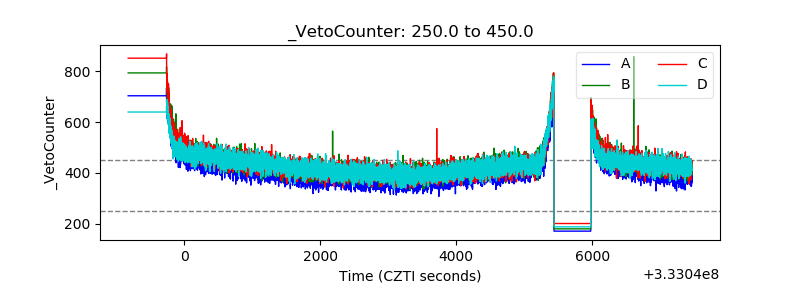 |