| Param | Original file | Final file |
|---|---|---|
| Filename | modeM0/AS1A09_033T02_9000003762_26030cztM0_level2.evt | modeM0/AS1A09_033T02_9000003762_26030cztM0_level2_quad_clean.evt |
| Size (bytes) | 545,518,080 | 92,661,120 |
| Size | 520.2 MB | 88.4 MB |
| Events in quadrant A | 3,873,578 | 575,326 |
| Events in quadrant B | 3,911,370 | 578,881 |
| Events in quadrant C | 3,860,824 | 552,585 |
| Events in quadrant D | 4,342,674 | 553,703 |
| Mode M9 | |||
|---|---|---|---|
| Quadrant | BADHDUFLAG | Total packets | Discarded packets |
| A | 0 | 8 | 0 |
| B | 0 | 8 | 0 |
| C | 0 | 8 | 0 |
| D | 0 | 8 | 0 |
| Mode M0 | |||
|---|---|---|---|
| Quadrant | BADHDUFLAG | Total packets | Discarded packets |
| A | 0 | 16456 | 0 |
| B | 0 | 16473 | 0 |
| C | 0 | 16322 | 0 |
| D | 0 | 17976 | 0 |
| Quadrant | Total seconds | Saturated seconds | Saturation percentage |
|---|---|---|---|
| A | 7841 | 180 | 2.295626% |
| B | 7842 | 235 | 2.996685% |
| C | 7841 | 256 | 3.264890% |
| D | 7841 | 171 | 2.180844% |
Noise dominated data is calculated using 1-second bins in cleaned event files. If a bin has >2000 counts, and if more than 50% of those come from <1% of pixels, then it is considered to be noise-dominated and hence unusable.
| Quadrant | # 1 sec bins | Bins with >0 counts | Bins with >2000 counts | High rate bins dominated by noise | Noise dominated (total time) | Noise dominated (detector-on time) | Marked lightcurve |
|---|---|---|---|---|---|---|---|
| A | 8621 | 7842 | 0 | 0 | 0.00% | 0.00% | 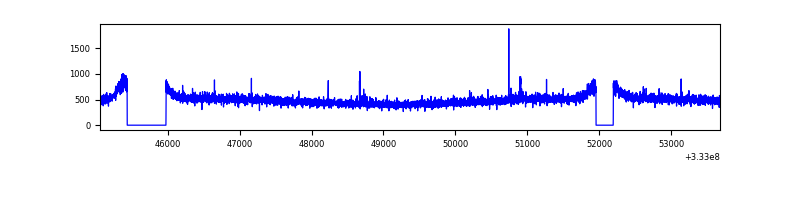 |
| B | 8622 | 7843 | 0 | 0 | 0.00% | 0.00% | 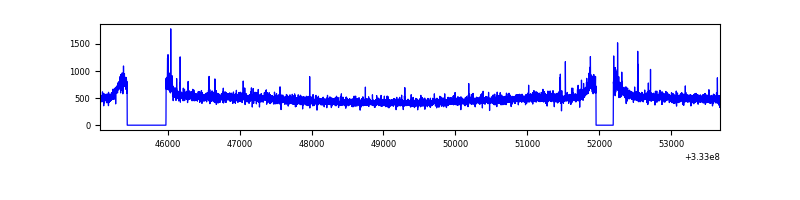 |
| C | 8621 | 7841 | 2 | 2 | 0.02% | 0.03% | 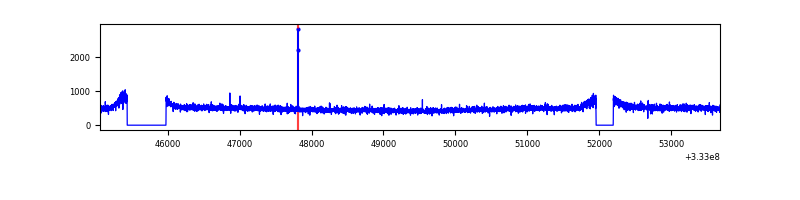 |
| D | 8621 | 7842 | 24 | 24 | 0.28% | 0.31% | 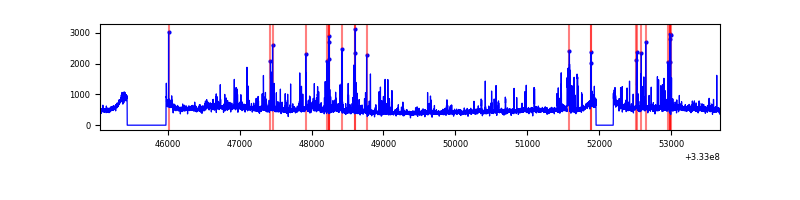 |
Top three noisy pixels from each quadrant. If the there are fewer than three noisy pixels in the level2.evt file, extra rows are filled as -1
| Pixel properties | Quadrant properties | ||||||
|---|---|---|---|---|---|---|---|
| Quadrant | DetID | PixID | Counts | Sigma | Mean | Median | Sigma |
| A | 0 | 13 | 15785 | 73.51 | 1000 | 978 | 201.4 |
| A | 13 | 254 | 11989 | 54.67 | 1000 | 978 | 201.4 |
| A | 3 | 137 | 9540 | 42.51 | 1000 | 978 | 201.4 |
| B | 0 | 190 | 25556 | 130.35 | 984 | 960 | 188.7 |
| B | 12 | 111 | 23543 | 119.69 | 984 | 960 | 188.7 |
| B | 11 | 111 | 21364 | 108.14 | 984 | 960 | 188.7 |
| C | 14 | 238 | 150796 | 677.99 | 947 | 951 | 221.0 |
| C | 3 | 233 | 14785 | 62.59 | 947 | 951 | 221.0 |
| C | 2 | 16 | 7337 | 28.89 | 947 | 951 | 221.0 |
| D | 1 | 52 | 401968 | 1641.58 | 967 | 944 | 244.3 |
| D | 7 | 223 | 131451 | 534.22 | 967 | 944 | 244.3 |
| D | 1 | 3 | 93285 | 377.99 | 967 | 944 | 244.3 |
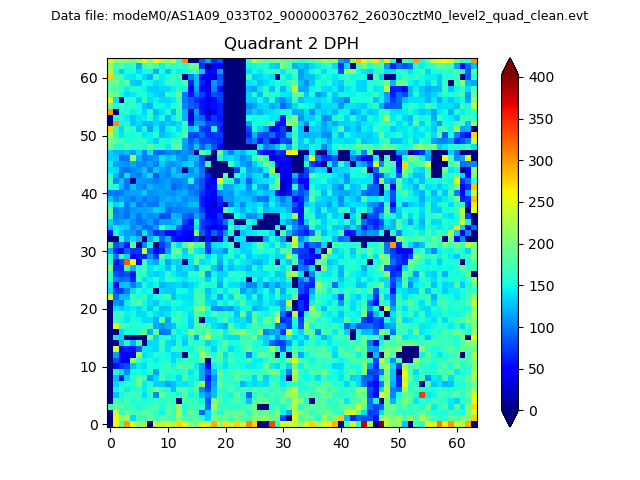
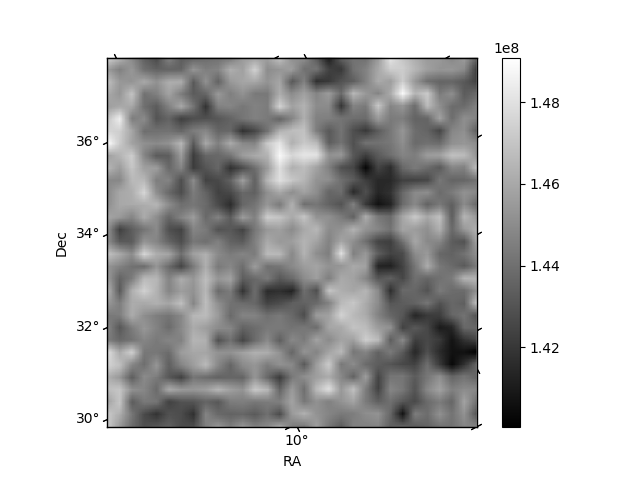
Histogram calculated using DETX and DETY for each event in the final _common_clean file
| Quadrant A | 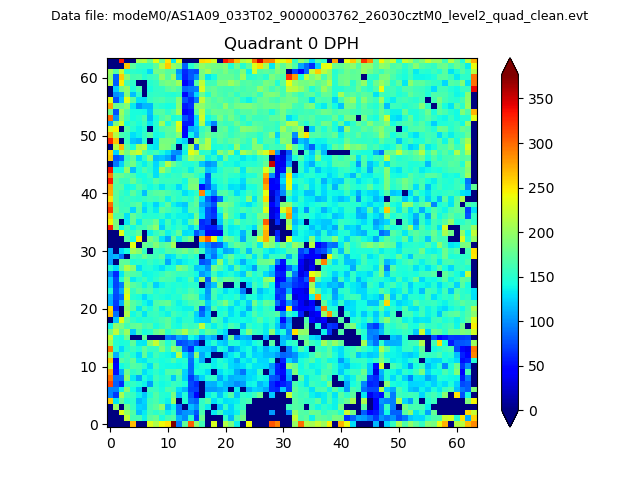 |
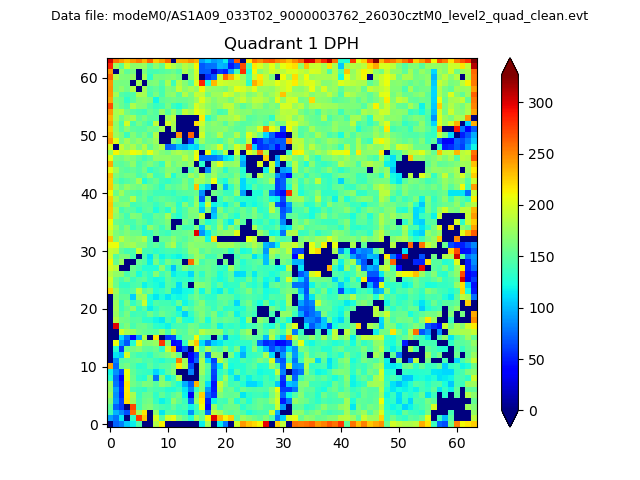 |
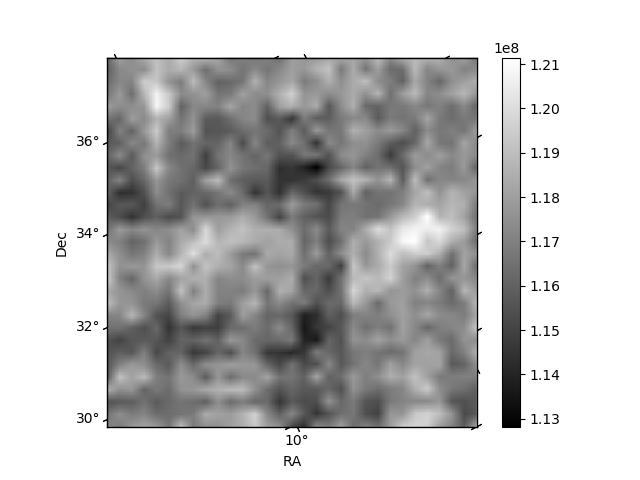
Quadrant B |
|---|---|---|---|
| Quadrant D | 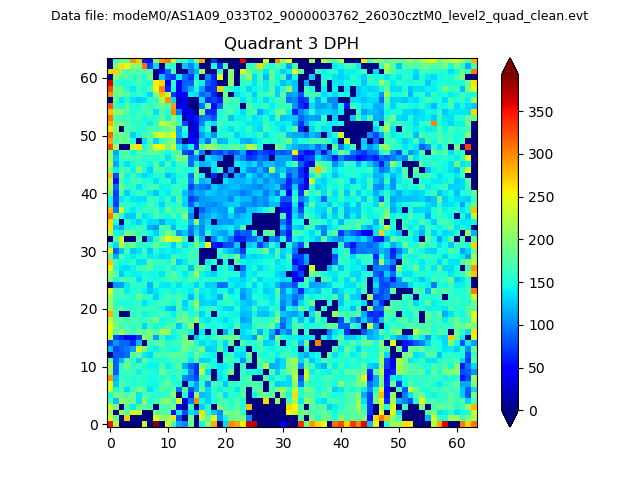 |
 |
Quadrant C |
| Plot type | Count rate plots | Images |
|---|---|---|
| Comparison with Poisson distribution Blue bars denote a histogram of data divided into 1 sec bins. Red curve is a Poisson curve with rate = median count rate of data. |
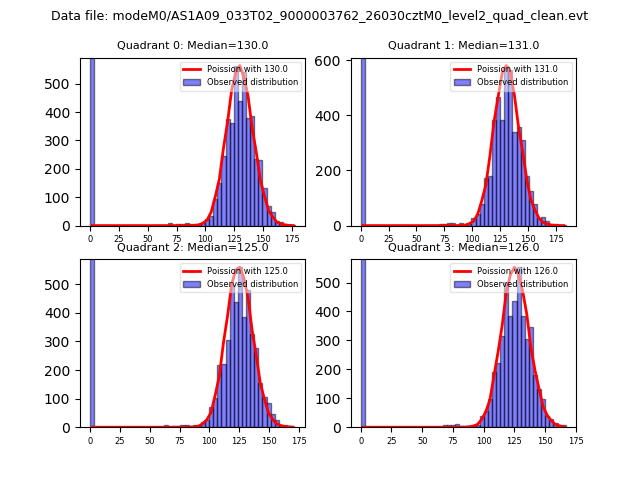 |
 |
| Quadrant-wise count rates Data is divided into 100 sec bins |
 |
|
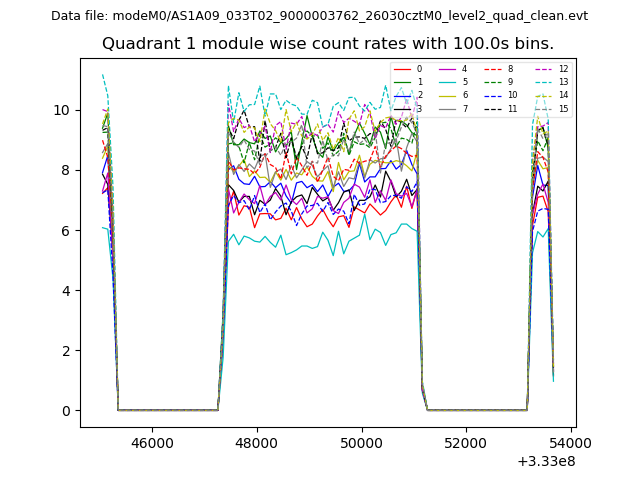
| Module-wise count rates for Quadrant A Data is divided into 100 sec bins |
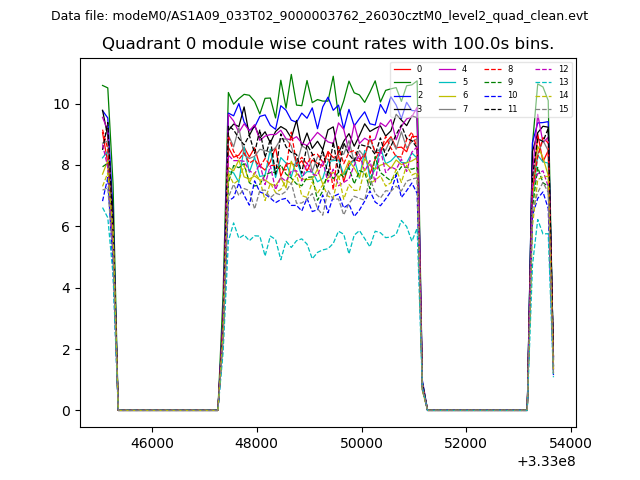 |
 |
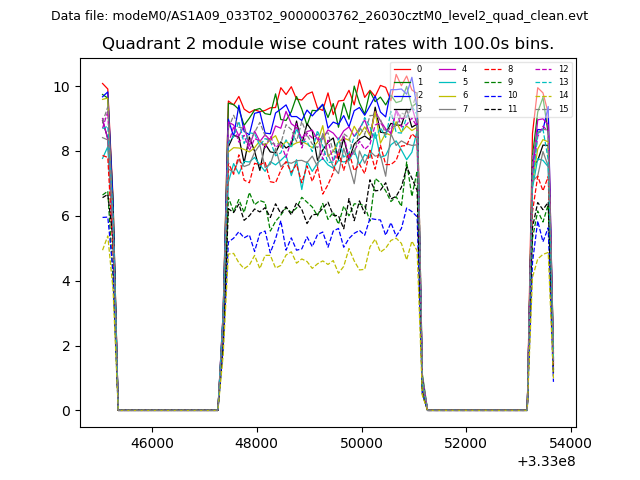
| Module-wise count rates for Quadrant B Data is divided into 100 sec bins |
 |
 |
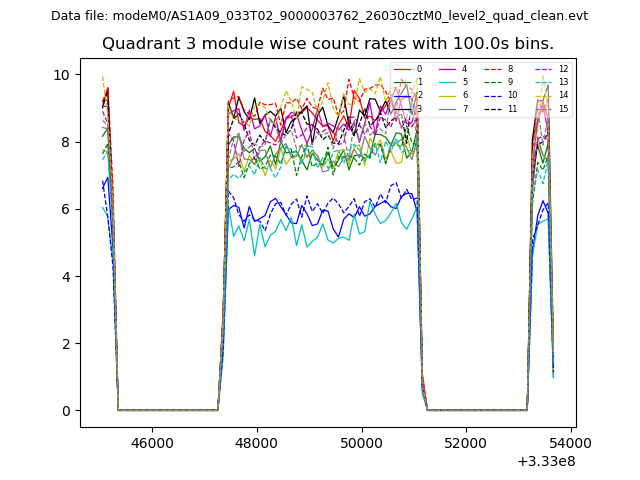
| Module-wise count rates for Quadrant C Data is divided into 100 sec bins |
 |
 |
| Module-wise count rates for Quadrant D Data is divided into 100 sec bins |
 |
 |
| Parameter | Plot |
|---|---|
| CZT HV Monitor | 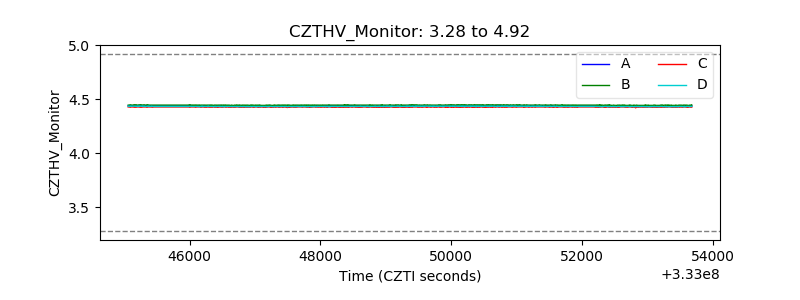 |
| D_VDD | 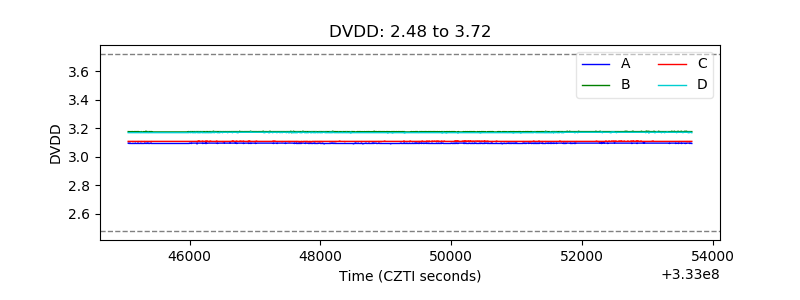 |
| Temperature 1 | 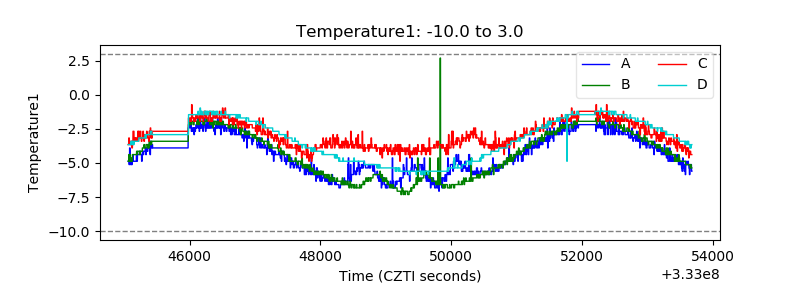 |
| Veto HV Monitor | 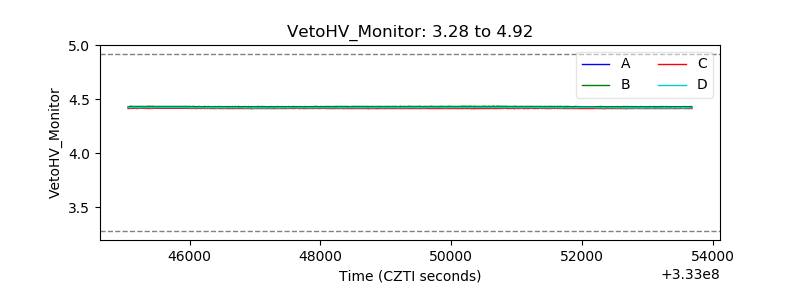 |
| Veto LLD | 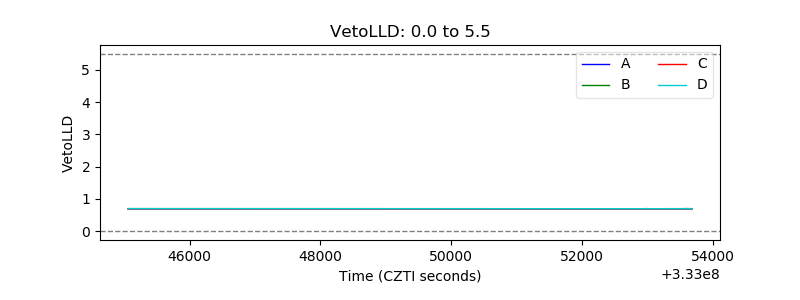 |
| Alpha Counter | 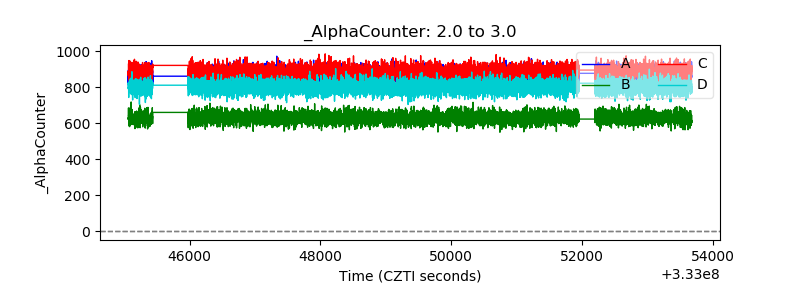 |
| _CPM_Rate | 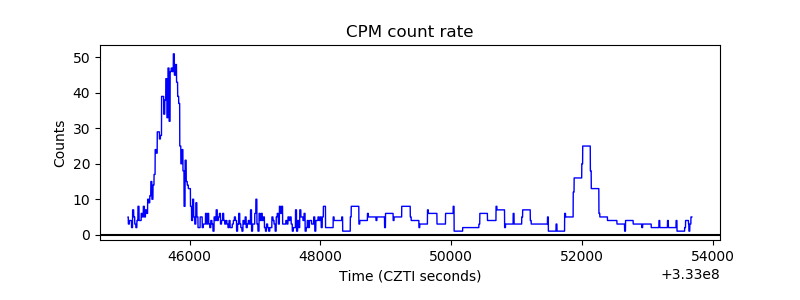 |
| CZT Counter | 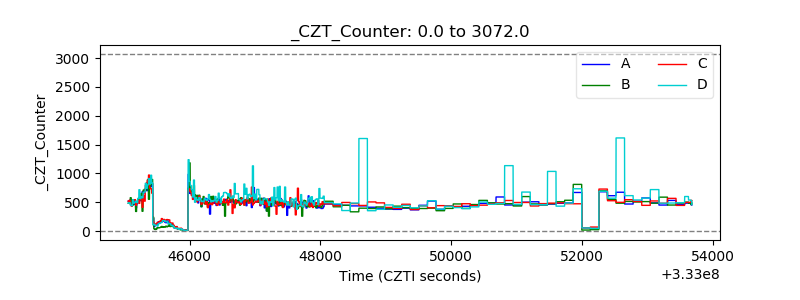 |
| +2.5 Volts monitor |  |
| +5 Volts monitor |  |
| _ROLL_ROT | 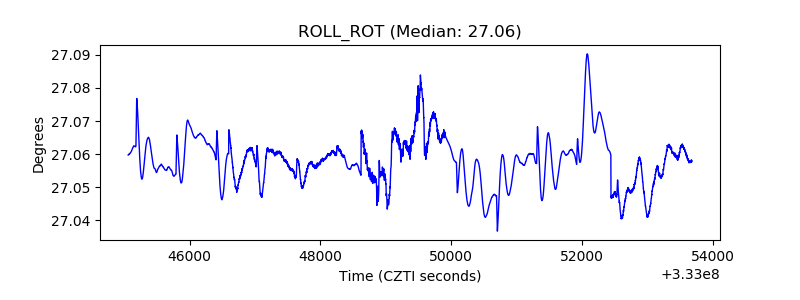 |
| _Roll_DEC | 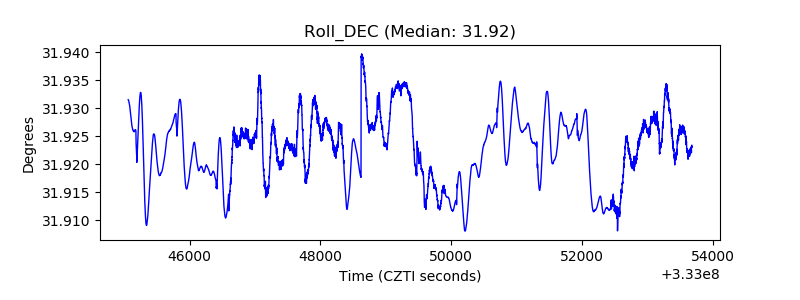 |
| _Roll_RA | 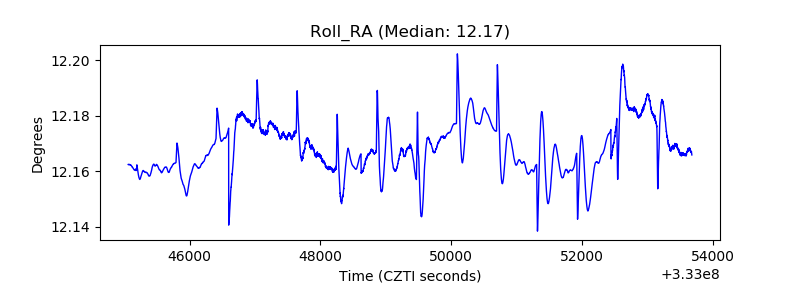 |
| Veto Counter | 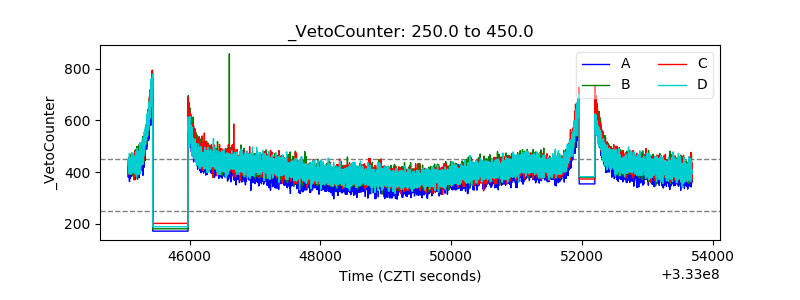 |