| Param | Original file | Final file |
|---|---|---|
| Filename | modeM0/AS1A09_033T02_9000003762_26031cztM0_level2.evt | modeM0/AS1A09_033T02_9000003762_26031cztM0_level2_quad_clean.evt |
| Size (bytes) | 500,351,040 | 95,299,200 |
| Size | 477.2 MB | 90.9 MB |
| Events in quadrant A | 3,510,508 | 603,523 |
| Events in quadrant B | 3,586,427 | 608,021 |
| Events in quadrant C | 3,526,957 | 580,702 |
| Events in quadrant D | 4,029,786 | 582,114 |
| Mode M9 | |||
|---|---|---|---|
| Quadrant | BADHDUFLAG | Total packets | Discarded packets |
| A | 0 | 3 | 0 |
| B | 0 | 3 | 0 |
| C | 0 | 3 | 0 |
| D | 0 | 3 | 0 |
| Mode M0 | |||
|---|---|---|---|
| Quadrant | BADHDUFLAG | Total packets | Discarded packets |
| A | 0 | 15132 | 0 |
| B | 0 | 15331 | 0 |
| C | 0 | 15066 | 0 |
| D | 0 | 16897 | 0 |
| Quadrant | Total seconds | Saturated seconds | Saturation percentage |
|---|---|---|---|
| A | 7348 | 62 | 0.843767% |
| B | 7349 | 108 | 1.469588% |
| C | 7348 | 148 | 2.014154% |
| D | 7348 | 116 | 1.578661% |
Noise dominated data is calculated using 1-second bins in cleaned event files. If a bin has >2000 counts, and if more than 50% of those come from <1% of pixels, then it is considered to be noise-dominated and hence unusable.
| Quadrant | # 1 sec bins | Bins with >0 counts | Bins with >2000 counts | High rate bins dominated by noise | Noise dominated (total time) | Noise dominated (detector-on time) | Marked lightcurve |
|---|---|---|---|---|---|---|---|
| A | 7643 | 7348 | 0 | 0 | 0.00% | 0.00% | 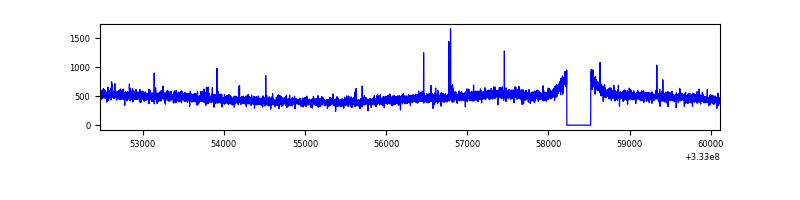 |
| B | 7644 | 7350 | 0 | 0 | 0.00% | 0.00% | 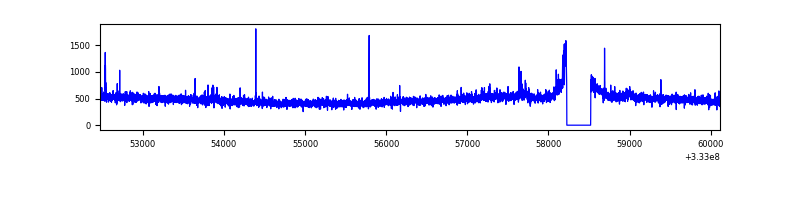 |
| C | 7643 | 7348 | 0 | 0 | 0.00% | 0.00% | 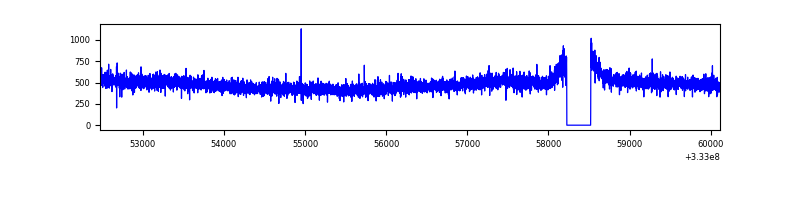 |
| D | 7643 | 7348 | 29 | 29 | 0.38% | 0.39% | 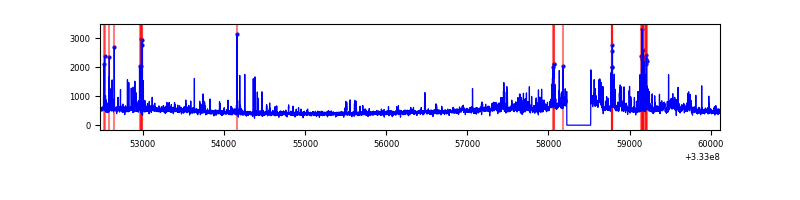 |
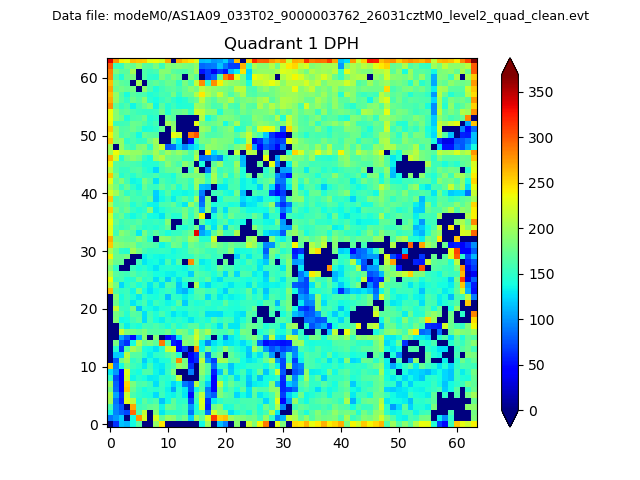
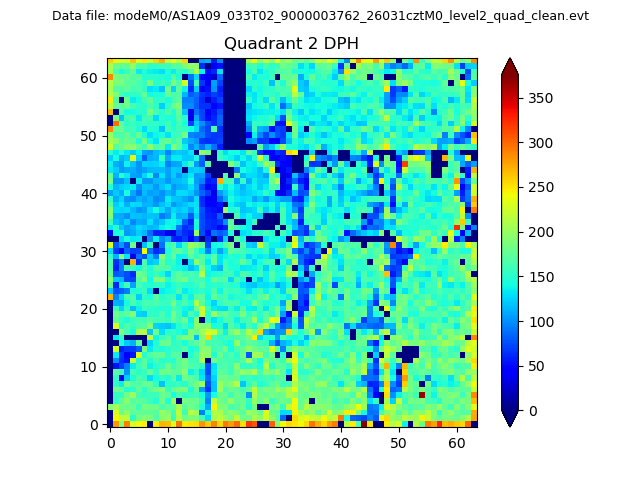
Top three noisy pixels from each quadrant. If the there are fewer than three noisy pixels in the level2.evt file, extra rows are filled as -1
| Pixel properties | Quadrant properties | ||||||
|---|---|---|---|---|---|---|---|
| Quadrant | DetID | PixID | Counts | Sigma | Mean | Median | Sigma |
| A | 0 | 13 | 14578 | 74.69 | 906 | 886 | 183.3 |
| A | 13 | 254 | 10989 | 55.11 | 906 | 886 | 183.3 |
| A | 3 | 137 | 8515 | 41.62 | 906 | 886 | 183.3 |
| B | 2 | 0 | 47682 | 269.68 | 896 | 870 | 173.6 |
| B | 12 | 111 | 21154 | 116.85 | 896 | 870 | 173.6 |
| B | 11 | 111 | 19203 | 105.61 | 896 | 870 | 173.6 |
| C | 14 | 238 | 138244 | 673.74 | 863 | 865 | 203.9 |
| C | 3 | 233 | 26362 | 125.04 | 863 | 865 | 203.9 |
| C | 13 | 61 | 5921 | 24.8 | 863 | 865 | 203.9 |
| D | 1 | 52 | 475837 | 2108.78 | 875 | 853 | 225.2 |
| D | 7 | 223 | 100651 | 443.07 | 875 | 853 | 225.2 |
| D | 1 | 3 | 58017 | 253.79 | 875 | 853 | 225.2 |
Histogram calculated using DETX and DETY for each event in the final _common_clean file
| Quadrant A | 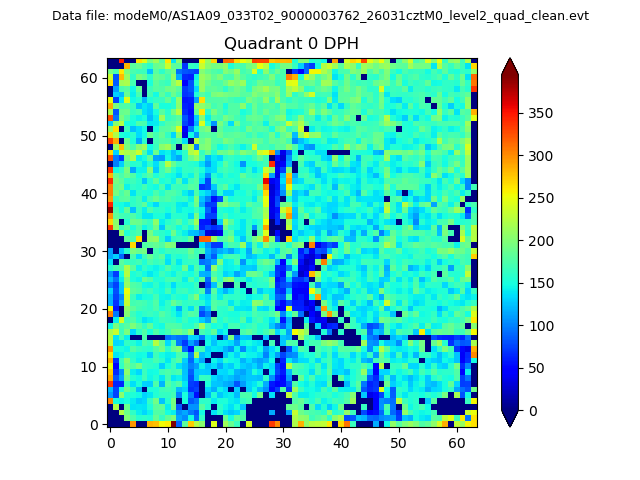 |
 |
Quadrant B |
|---|---|---|---|
| Quadrant D |  |
 |
Quadrant C |
| Plot type | Count rate plots | Images |
|---|---|---|
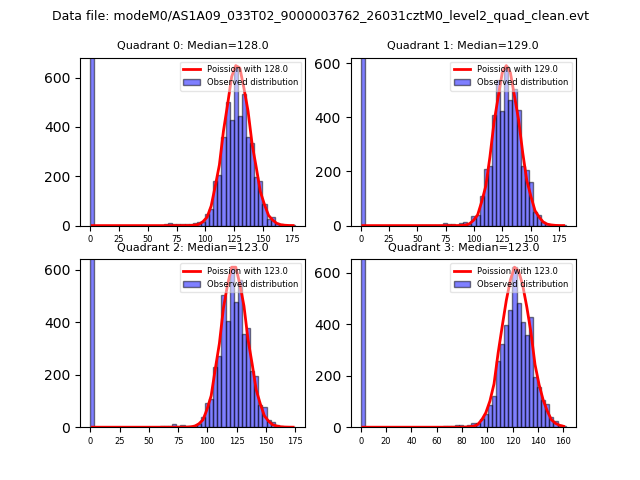
| Comparison with Poisson distribution Blue bars denote a histogram of data divided into 1 sec bins. Red curve is a Poisson curve with rate = median count rate of data. |
 |
 |
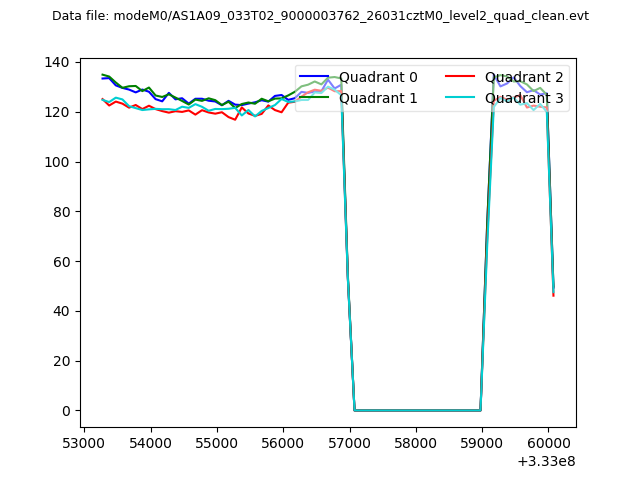
| Quadrant-wise count rates Data is divided into 100 sec bins |
 |
|
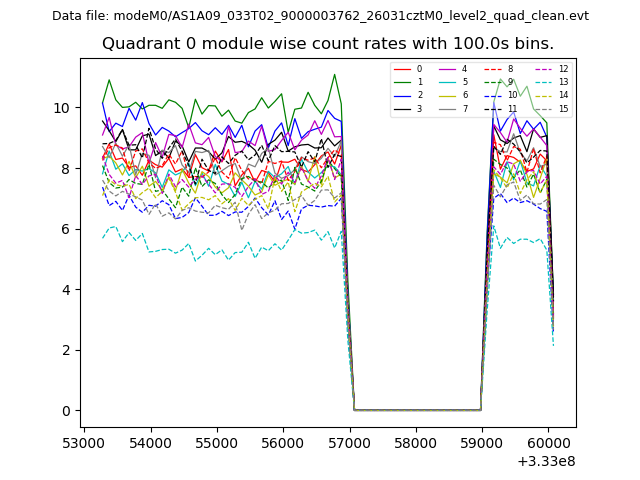
| Module-wise count rates for Quadrant A Data is divided into 100 sec bins |
 |
 |
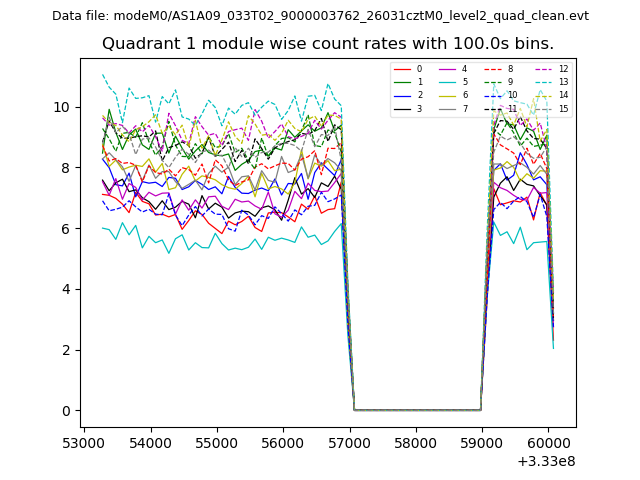
| Module-wise count rates for Quadrant B Data is divided into 100 sec bins |
 |
 |
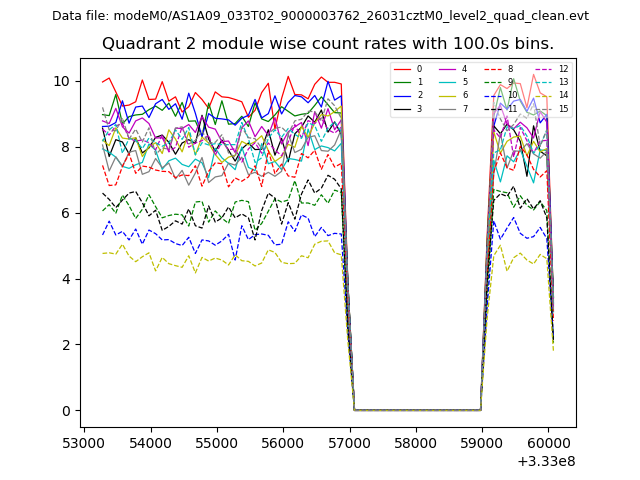
| Module-wise count rates for Quadrant C Data is divided into 100 sec bins |
 |
 |
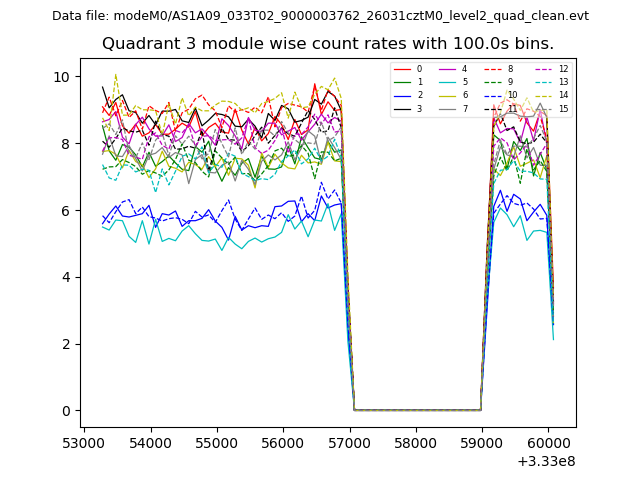
| Module-wise count rates for Quadrant D Data is divided into 100 sec bins |
 |
 |
| Parameter | Plot |
|---|---|
| CZT HV Monitor | 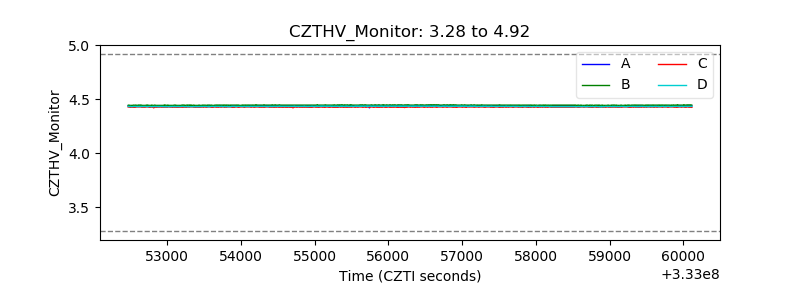 |
| D_VDD | 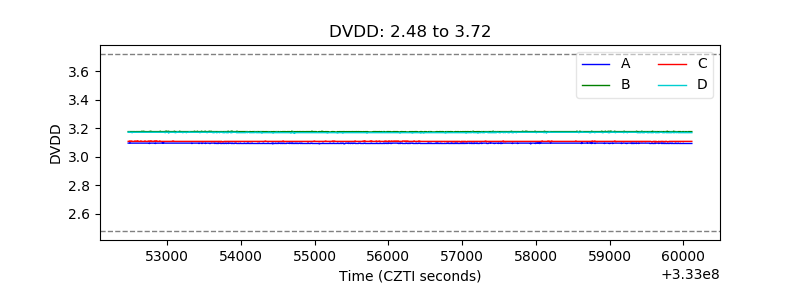 |
| Temperature 1 | 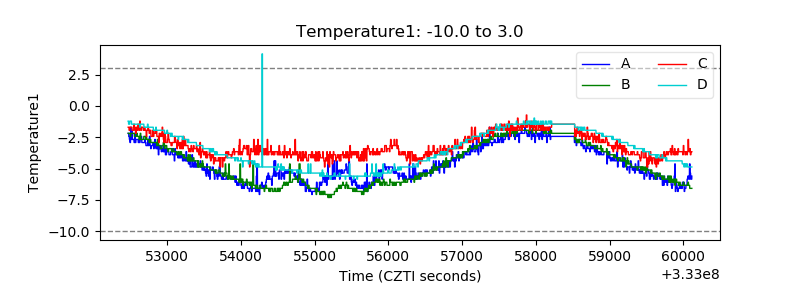 |
| Veto HV Monitor |  |
| Veto LLD | 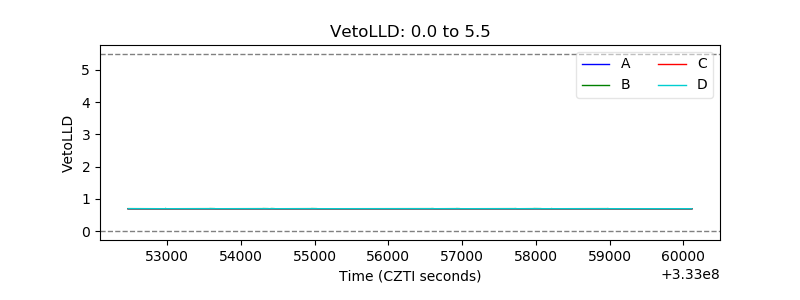 |
| Alpha Counter | 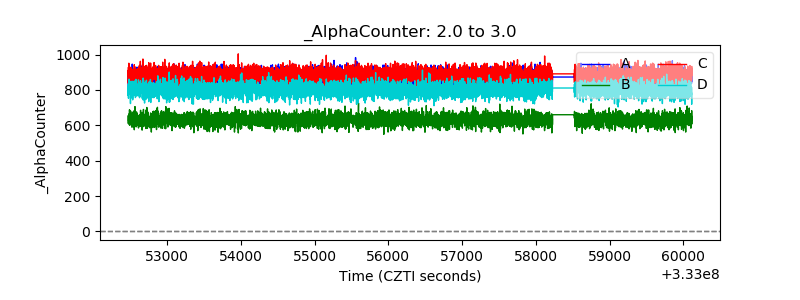 |
| _CPM_Rate | 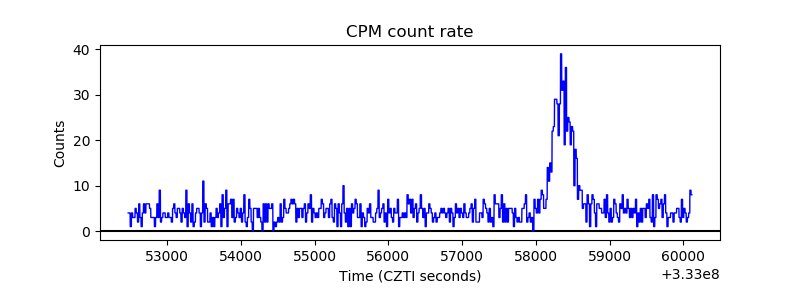 |
| CZT Counter | 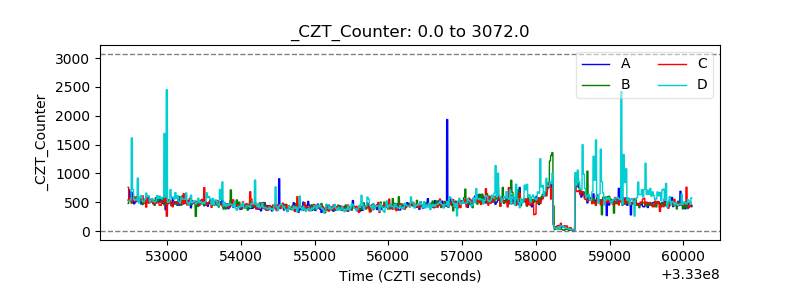 |
| +2.5 Volts monitor |  |
| +5 Volts monitor |  |
| _ROLL_ROT | 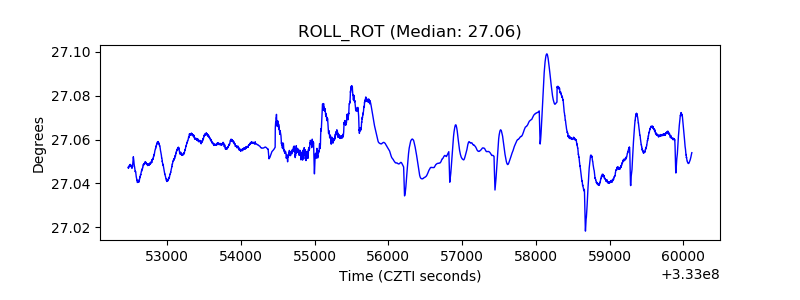 |
| _Roll_DEC |  |
| _Roll_RA |  |
| Veto Counter | 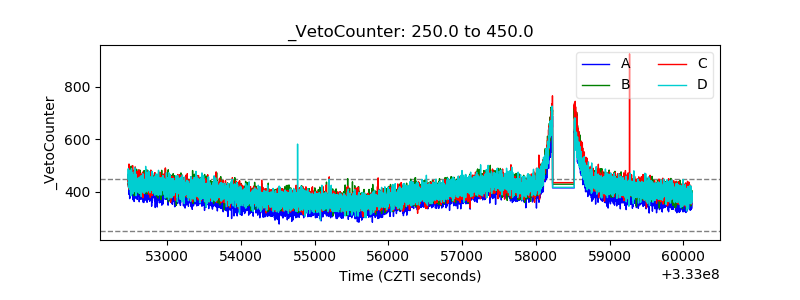 |