| Param | Original file | Final file |
|---|---|---|
| Filename | modeM0/AS1A09_033T02_9000003762_26034cztM0_level2.evt | modeM0/AS1A09_033T02_9000003762_26034cztM0_level2_quad_clean.evt |
| Size (bytes) | 1,324,344,960 | 245,384,640 |
| Size | 1.2 GB | 234.0 MB |
| Events in quadrant A | 9,438,129 | 1,556,887 |
| Events in quadrant B | 10,053,466 | 1,568,383 |
| Events in quadrant C | 8,855,937 | 1,511,524 |
| Events in quadrant D | 10,496,906 | 1,507,517 |
| Mode M9 | |||
|---|---|---|---|
| Quadrant | BADHDUFLAG | Total packets | Discarded packets |
| A | 0 | 22 | 0 |
| B | 0 | 22 | 0 |
| C | 0 | 22 | 0 |
| D | 0 | 22 | 0 |
| Mode M0 | |||
|---|---|---|---|
| Quadrant | BADHDUFLAG | Total packets | Discarded packets |
| A | 0 | 40549 | 0 |
| B | 0 | 42141 | 0 |
| C | 0 | 38496 | 0 |
| D | 0 | 44462 | 0 |
| Quadrant | Total seconds | Saturated seconds | Saturation percentage |
|---|---|---|---|
| A | 18684 | 251 | 1.343395% |
| B | 18684 | 409 | 2.189039% |
| C | 18685 | 305 | 1.632325% |
| D | 18685 | 323 | 1.728659% |
Noise dominated data is calculated using 1-second bins in cleaned event files. If a bin has >2000 counts, and if more than 50% of those come from <1% of pixels, then it is considered to be noise-dominated and hence unusable.
| Quadrant | # 1 sec bins | Bins with >0 counts | Bins with >2000 counts | High rate bins dominated by noise | Noise dominated (total time) | Noise dominated (detector-on time) | Marked lightcurve |
|---|---|---|---|---|---|---|---|
| A | 21009 | 18687 | 85 | 85 | 0.40% | 0.45% | 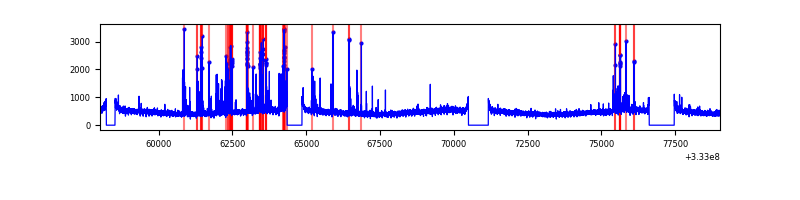 |
| B | 21009 | 18686 | 157 | 157 | 0.75% | 0.84% | 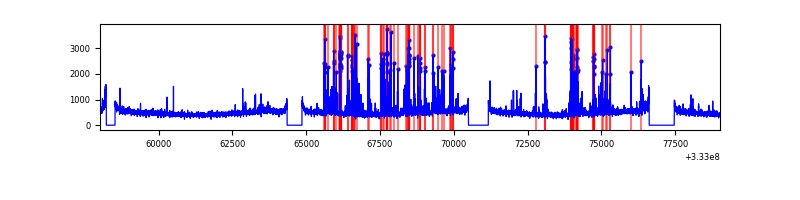 |
| C | 21010 | 18687 | 0 | 0 | 0.00% | 0.00% | 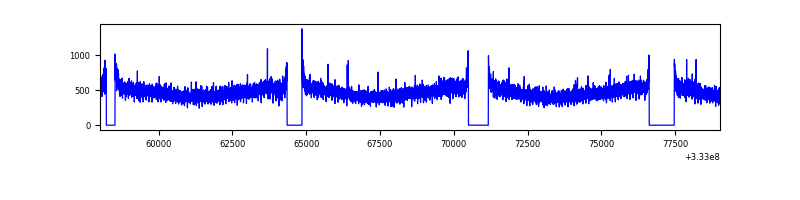 |
| D | 21010 | 18688 | 127 | 127 | 0.60% | 0.68% | 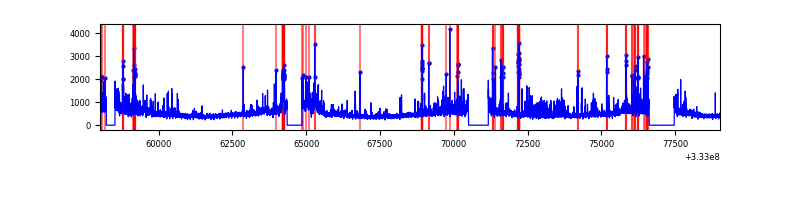 |
Top three noisy pixels from each quadrant. If the there are fewer than three noisy pixels in the level2.evt file, extra rows are filled as -1
| Pixel properties | Quadrant properties | ||||||
|---|---|---|---|---|---|---|---|
| Quadrant | DetID | PixID | Counts | Sigma | Mean | Median | Sigma |
| A | 0 | 13 | 742842 | 1640.19 | 2255 | 2207 | 451.6 |
| A | 13 | 254 | 23493 | 47.14 | 2255 | 2207 | 451.6 |
| A | 3 | 137 | 21376 | 42.45 | 2255 | 2207 | 451.6 |
| B | 10 | 245 | 1145787 | 2696.85 | 2236 | 2176 | 424.1 |
| B | 0 | 190 | 60264 | 136.98 | 2236 | 2176 | 424.1 |
| B | 12 | 111 | 53636 | 121.35 | 2236 | 2176 | 424.1 |
| C | 14 | 238 | 345606 | 677.8 | 2165 | 2178 | 506.7 |
| C | 3 | 233 | 56864 | 107.93 | 2165 | 2178 | 506.7 |
| C | 8 | 128 | 16282 | 27.83 | 2165 | 2178 | 506.7 |
| D | 1 | 52 | 1395457 | 2564.49 | 2182 | 2130 | 543.3 |
| D | 7 | 80 | 381776 | 698.76 | 2182 | 2130 | 543.3 |
| D | 7 | 223 | 217559 | 396.51 | 2182 | 2130 | 543.3 |
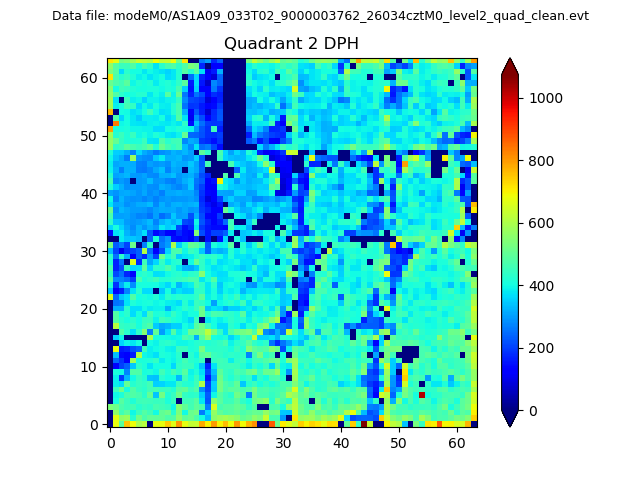
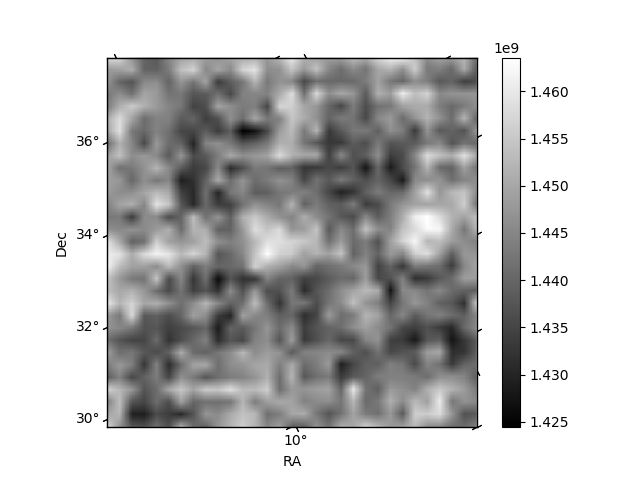
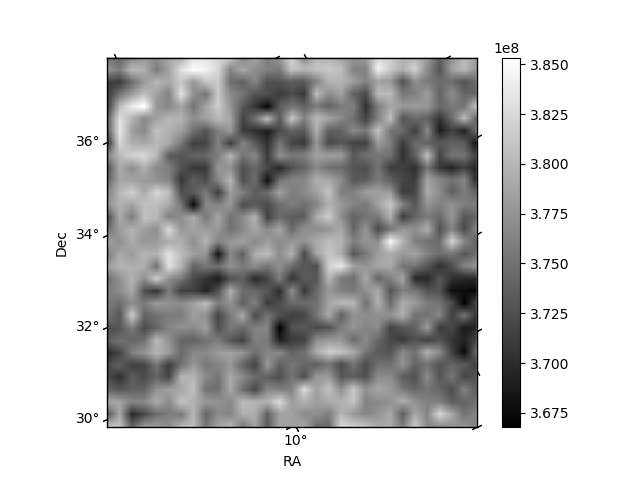
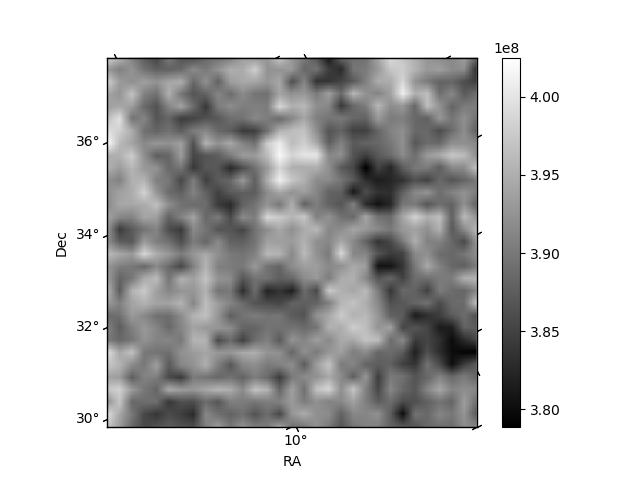
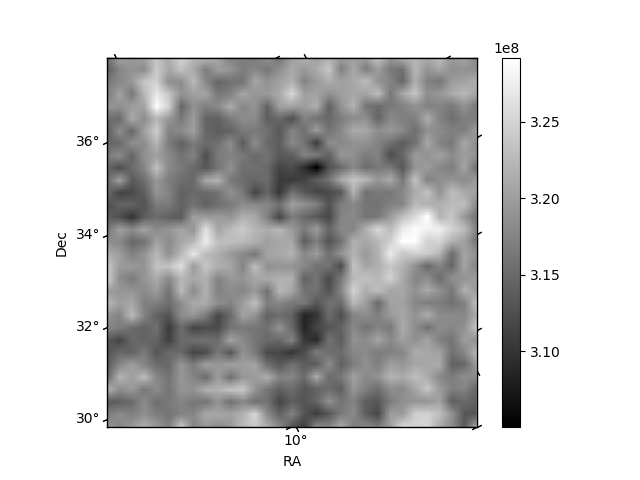
Histogram calculated using DETX and DETY for each event in the final _common_clean file
| Quadrant A | 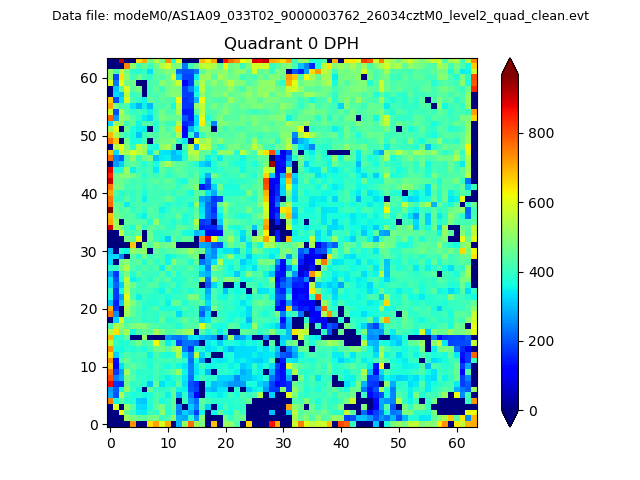 |
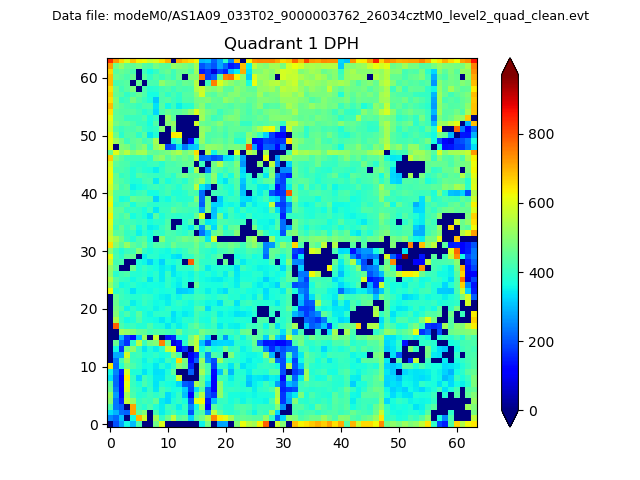 |
Quadrant B |
|---|---|---|---|
| Quadrant D | 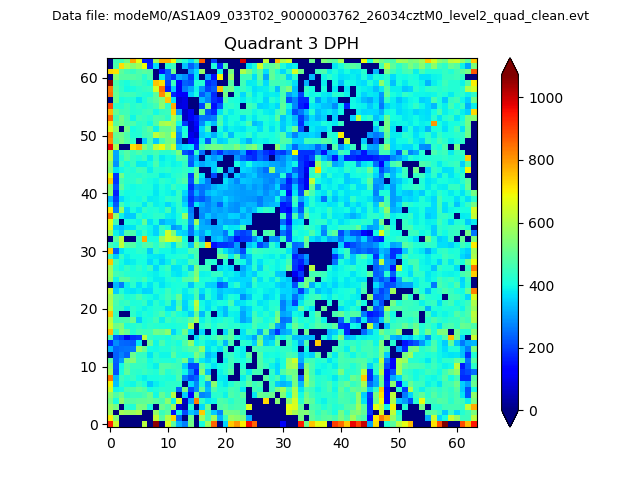 |
 |
Quadrant C |
| Plot type | Count rate plots | Images |
|---|---|---|
| Comparison with Poisson distribution Blue bars denote a histogram of data divided into 1 sec bins. Red curve is a Poisson curve with rate = median count rate of data. |
 |
 |
| Quadrant-wise count rates Data is divided into 100 sec bins |
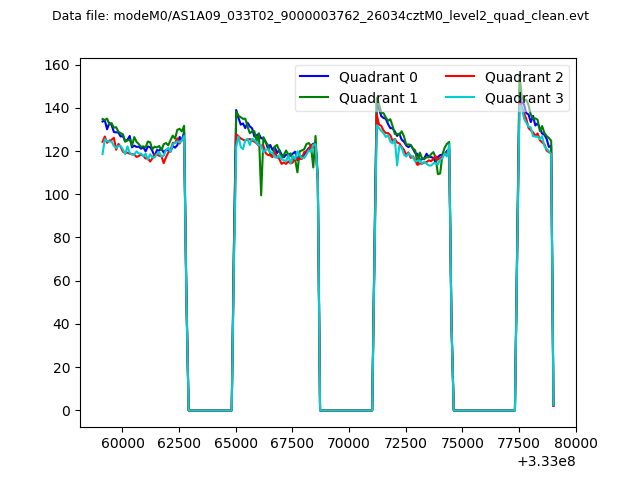 |
|
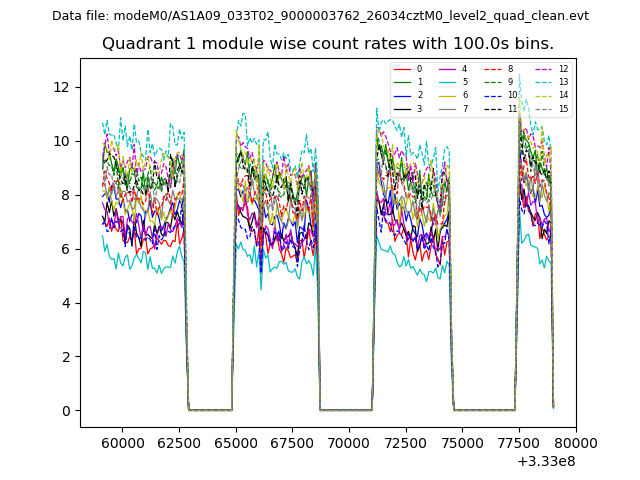
| Module-wise count rates for Quadrant A Data is divided into 100 sec bins |
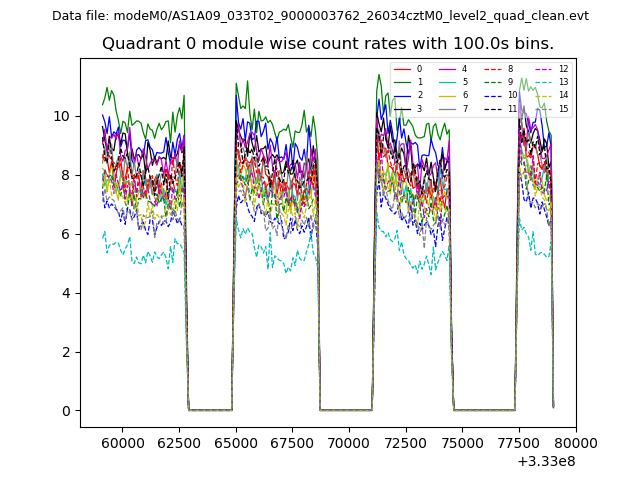 |
 |
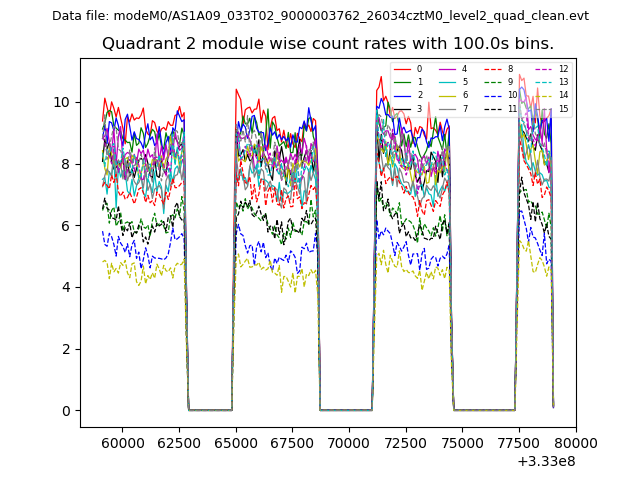
| Module-wise count rates for Quadrant B Data is divided into 100 sec bins |
 |
 |
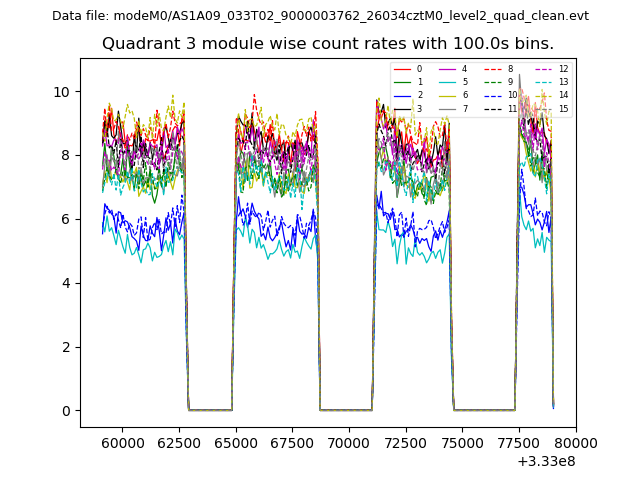
| Module-wise count rates for Quadrant C Data is divided into 100 sec bins |
 |
 |
| Module-wise count rates for Quadrant D Data is divided into 100 sec bins |
 |
 |
| Parameter | Plot |
|---|---|
| CZT HV Monitor | 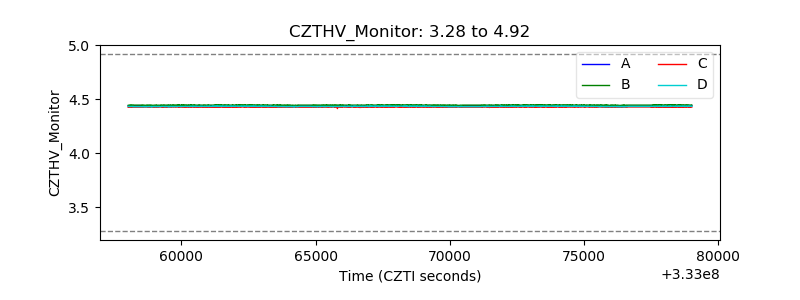 |
| D_VDD | 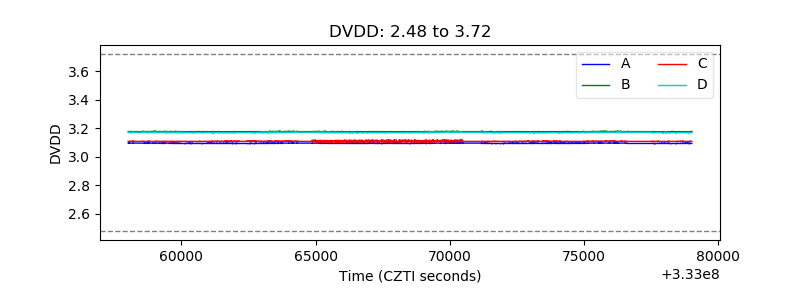 |
| Temperature 1 | 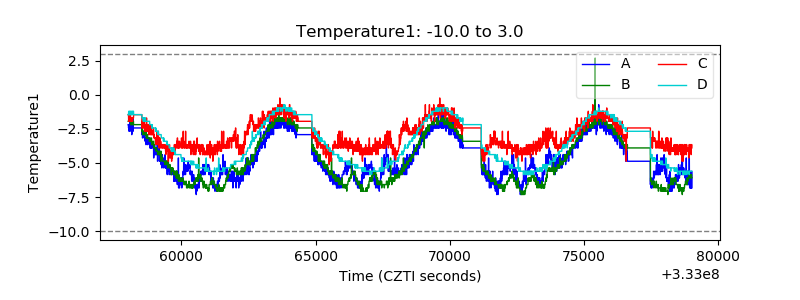 |
| Veto HV Monitor | 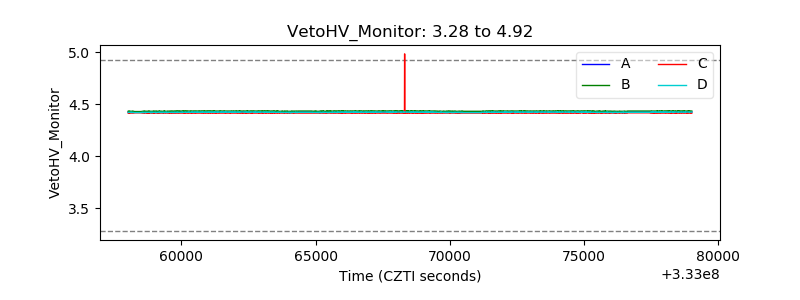 |
| Veto LLD | 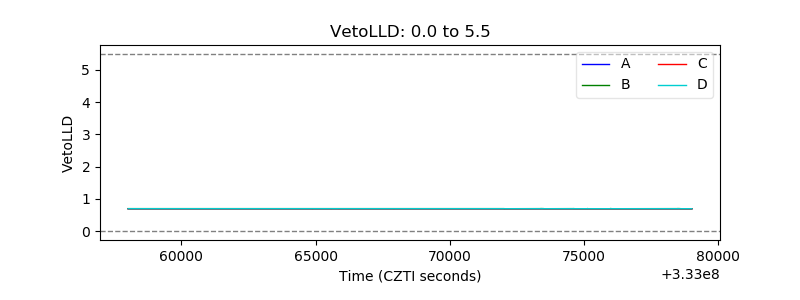 |
| Alpha Counter | 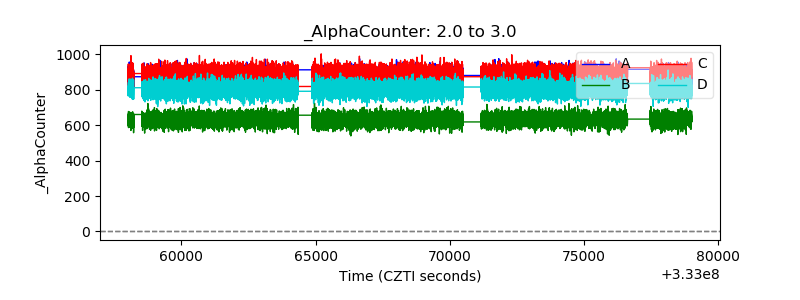 |
| _CPM_Rate | 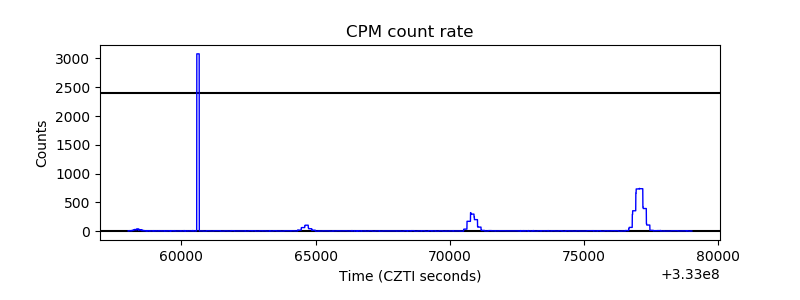 |
| CZT Counter |  |
| +2.5 Volts monitor |  |
| +5 Volts monitor |  |
| _ROLL_ROT |  |
| _Roll_DEC | 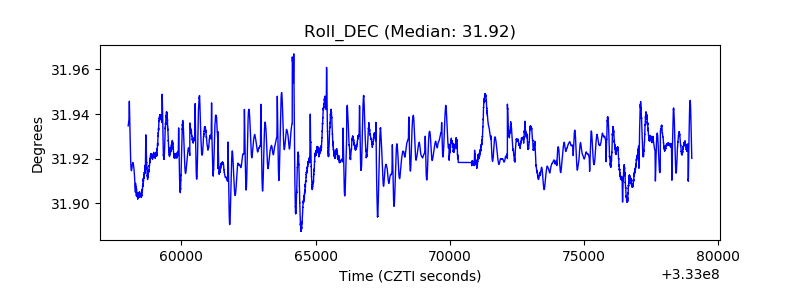 |
| _Roll_RA | 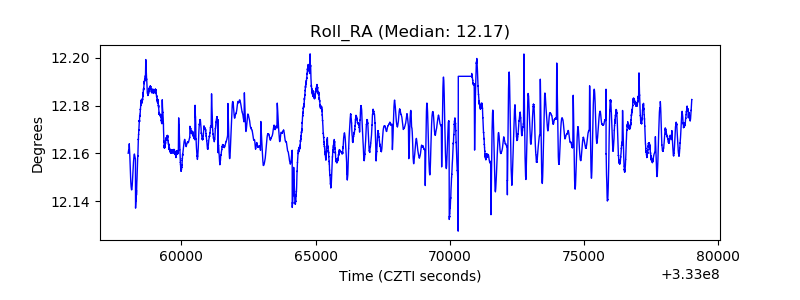 |
| Veto Counter | 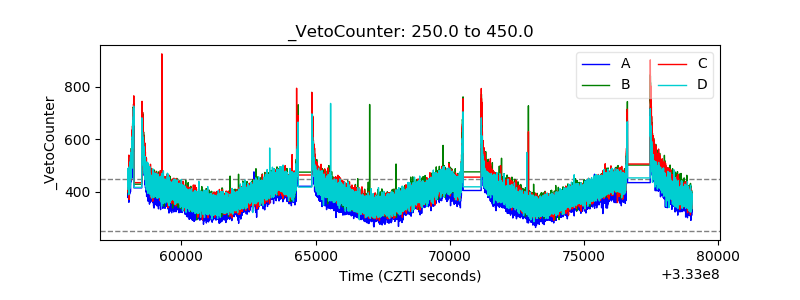 |