| Param | Original file | Final file |
|---|---|---|
| Filename | modeM0/AS1A09_033T02_9000003762_26035cztM0_level2.evt | modeM0/AS1A09_033T02_9000003762_26035cztM0_level2_quad_clean.evt |
| Size (bytes) | 464,564,160 | 95,264,640 |
| Size | 443.0 MB | 90.9 MB |
| Events in quadrant A | 3,389,626 | 610,505 |
| Events in quadrant B | 3,299,722 | 625,732 |
| Events in quadrant C | 3,184,446 | 594,212 |
| Events in quadrant D | 3,739,430 | 586,772 |
| Mode M9 | |||
|---|---|---|---|
| Quadrant | BADHDUFLAG | Total packets | Discarded packets |
| A | 0 | 10 | 0 |
| B | 0 | 11 | 0 |
| C | 0 | 11 | 0 |
| D | 0 | 11 | 0 |
| Mode M0 | |||
|---|---|---|---|
| Quadrant | BADHDUFLAG | Total packets | Discarded packets |
| A | 0 | 14497 | 0 |
| B | 0 | 14140 | 0 |
| C | 0 | 13829 | 0 |
| D | 0 | 15689 | 0 |
| Quadrant | Total seconds | Saturated seconds | Saturation percentage |
|---|---|---|---|
| A | 6706 | 55 | 0.820161% |
| B | 6706 | 57 | 0.849985% |
| C | 6706 | 81 | 1.207874% |
| D | 6705 | 179 | 2.669650% |
Noise dominated data is calculated using 1-second bins in cleaned event files. If a bin has >2000 counts, and if more than 50% of those come from <1% of pixels, then it is considered to be noise-dominated and hence unusable.
| Quadrant | # 1 sec bins | Bins with >0 counts | Bins with >2000 counts | High rate bins dominated by noise | Noise dominated (total time) | Noise dominated (detector-on time) | Marked lightcurve |
|---|---|---|---|---|---|---|---|
| A | 7706 | 6706 | 21 | 21 | 0.27% | 0.31% | 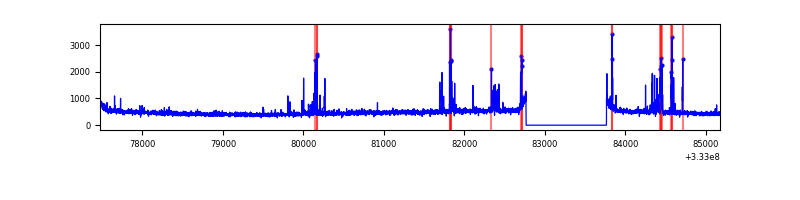 |
| B | 7706 | 6706 | 5 | 5 | 0.06% | 0.07% | 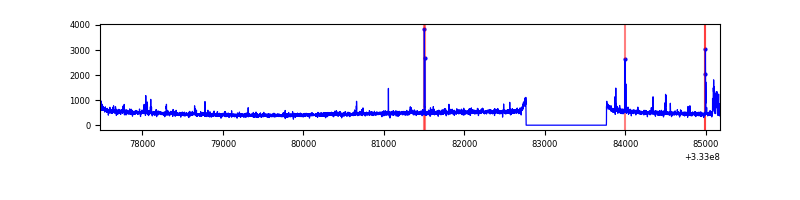 |
| C | 7706 | 6706 | 0 | 0 | 0.00% | 0.00% | 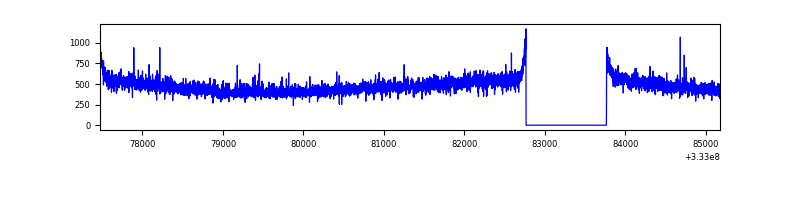 |
| D | 7705 | 6706 | 166 | 166 | 2.15% | 2.48% | 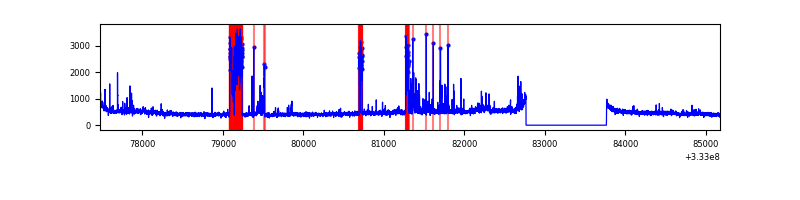 |
Top three noisy pixels from each quadrant. If the there are fewer than three noisy pixels in the level2.evt file, extra rows are filled as -1
| Pixel properties | Quadrant properties | ||||||
|---|---|---|---|---|---|---|---|
| Quadrant | DetID | PixID | Counts | Sigma | Mean | Median | Sigma |
| A | 0 | 13 | 257536 | 1580.75 | 813 | 797 | 162.4 |
| A | 13 | 254 | 9793 | 55.39 | 813 | 797 | 162.4 |
| A | 3 | 137 | 7639 | 42.13 | 813 | 797 | 162.4 |
| B | 10 | 245 | 98191 | 630.95 | 810 | 790 | 154.4 |
| B | 0 | 229 | 19572 | 121.67 | 810 | 790 | 154.4 |
| B | 12 | 111 | 19000 | 117.96 | 810 | 790 | 154.4 |
| C | 14 | 238 | 126285 | 690.07 | 779 | 785 | 181.9 |
| C | 3 | 233 | 22815 | 121.13 | 779 | 785 | 181.9 |
| C | 13 | 61 | 5309 | 24.88 | 779 | 785 | 181.9 |
| D | 1 | 52 | 572050 | 3052.27 | 778 | 760 | 187.2 |
| D | 12 | 233 | 124484 | 661.03 | 778 | 760 | 187.2 |
| D | 7 | 223 | 41340 | 216.81 | 778 | 760 | 187.2 |
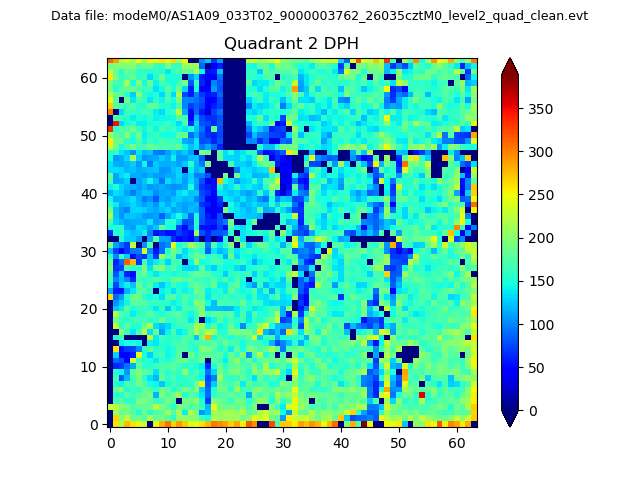
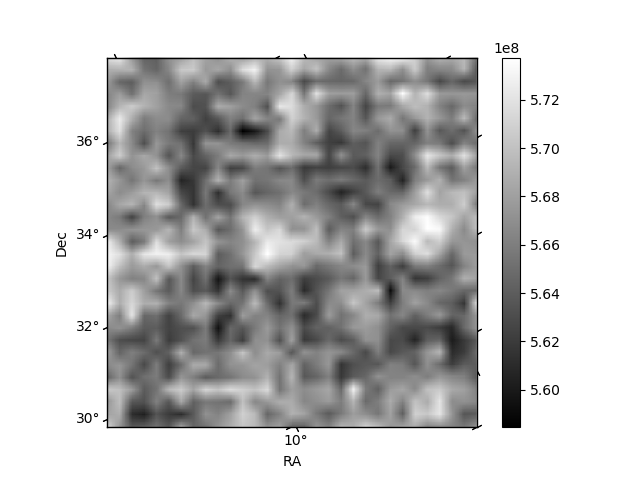
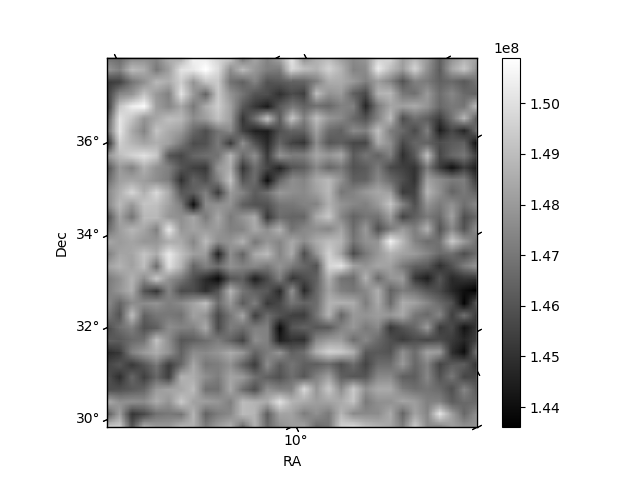
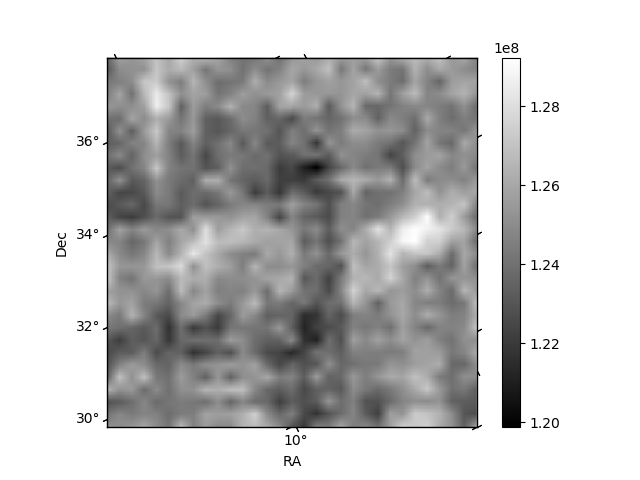
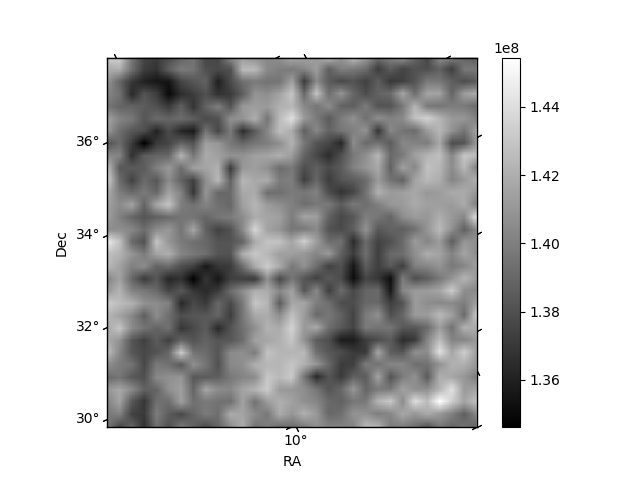
Histogram calculated using DETX and DETY for each event in the final _common_clean file
| Quadrant A | 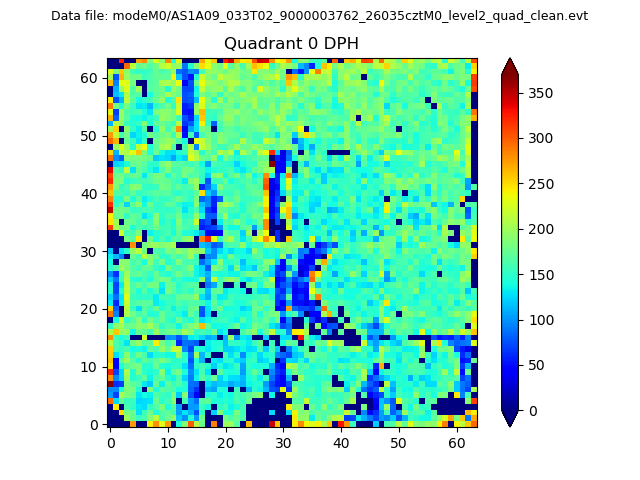 |
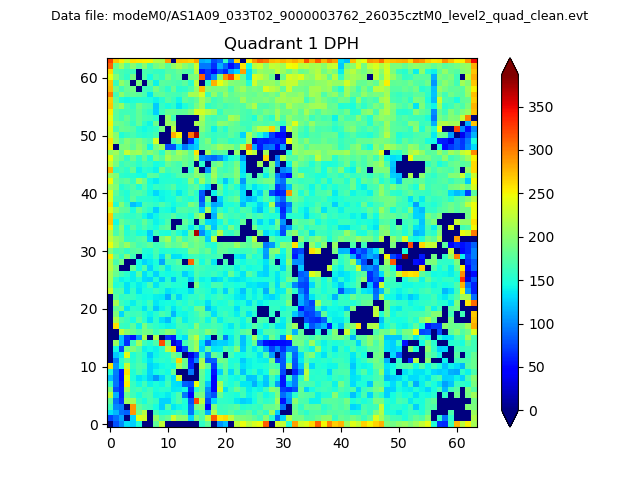 |
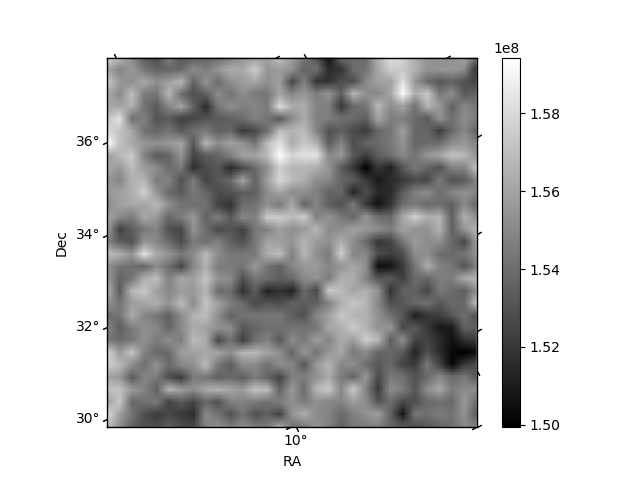
Quadrant B |
|---|---|---|---|
| Quadrant D | 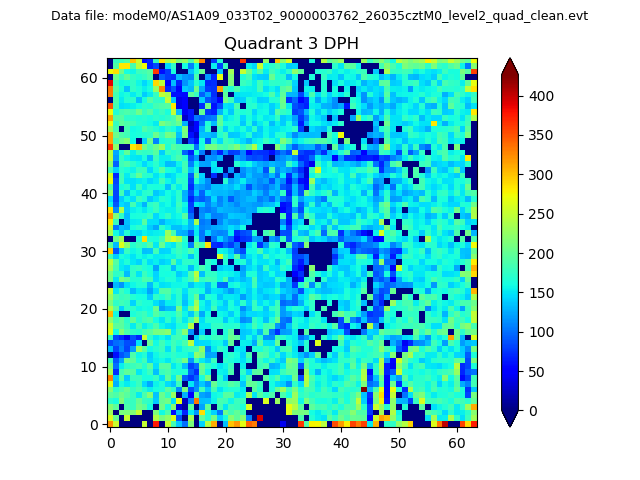 |
 |
Quadrant C |
| Plot type | Count rate plots | Images |
|---|---|---|
| Comparison with Poisson distribution Blue bars denote a histogram of data divided into 1 sec bins. Red curve is a Poisson curve with rate = median count rate of data. |
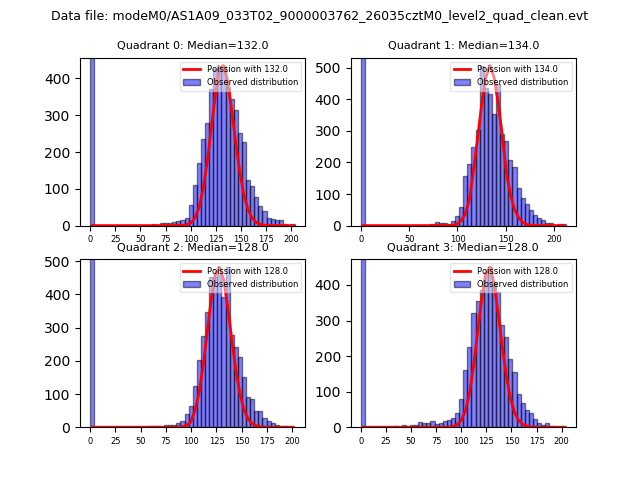 |
 |
| Quadrant-wise count rates Data is divided into 100 sec bins |
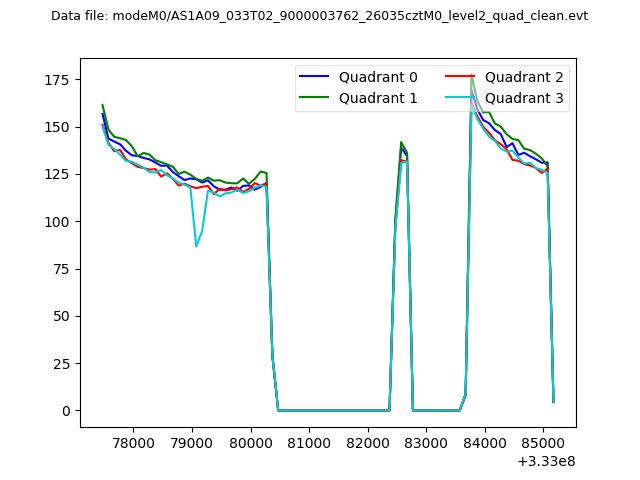 |
|
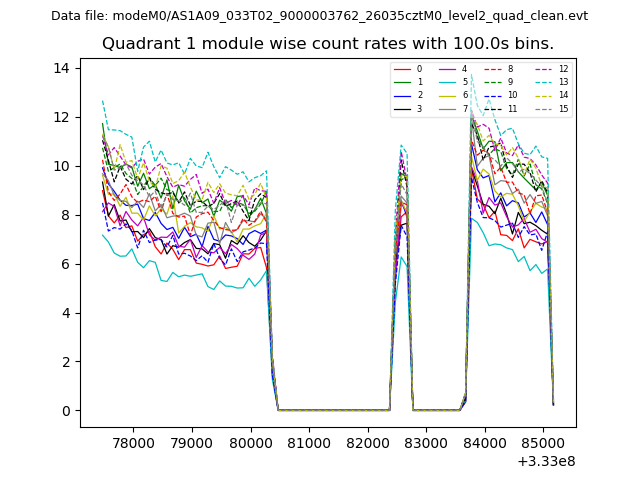
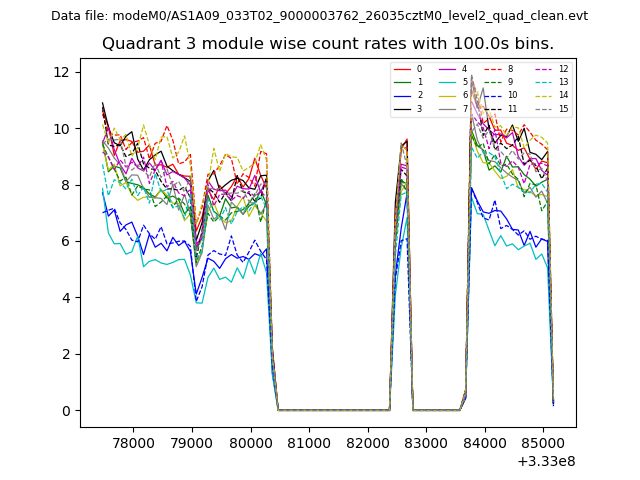
| Module-wise count rates for Quadrant A Data is divided into 100 sec bins |
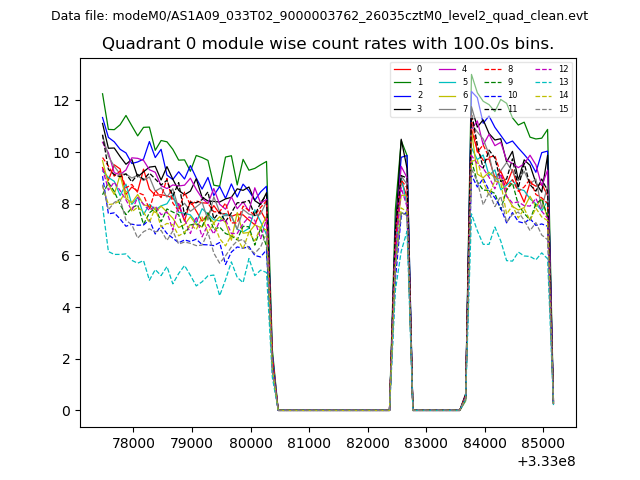 |
 |
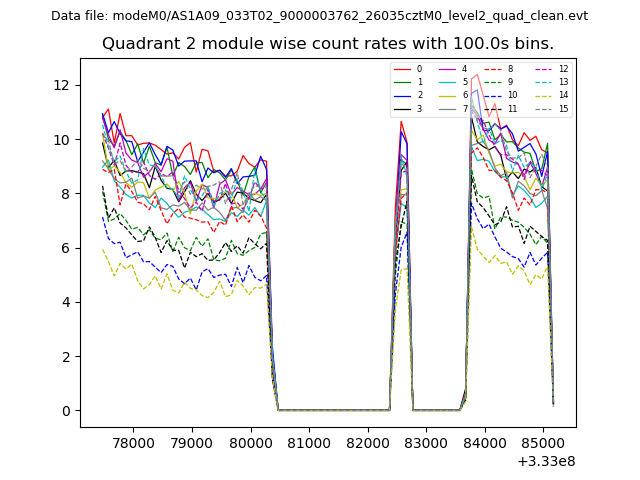
| Module-wise count rates for Quadrant B Data is divided into 100 sec bins |
 |
 |
| Module-wise count rates for Quadrant C Data is divided into 100 sec bins |
 |
 |
| Module-wise count rates for Quadrant D Data is divided into 100 sec bins |
 |
 |
| Parameter | Plot |
|---|---|
| CZT HV Monitor | 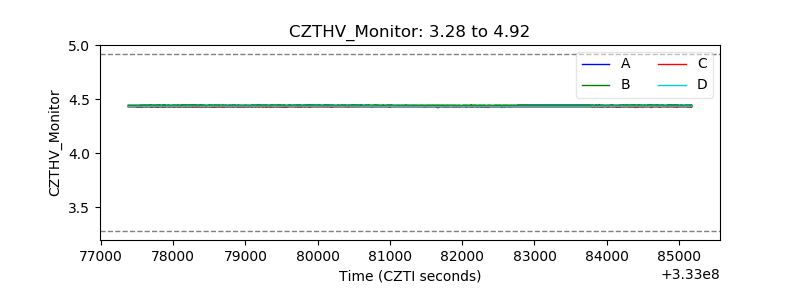 |
| D_VDD | 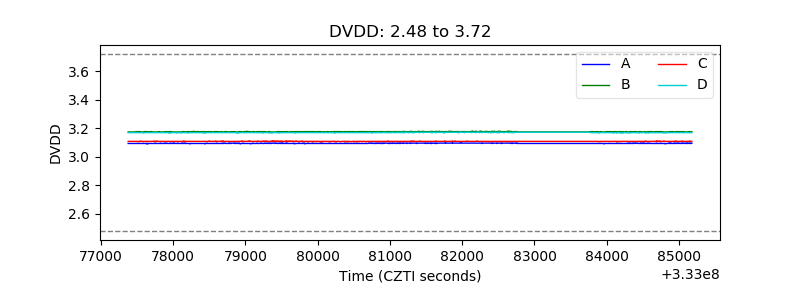 |
| Temperature 1 | 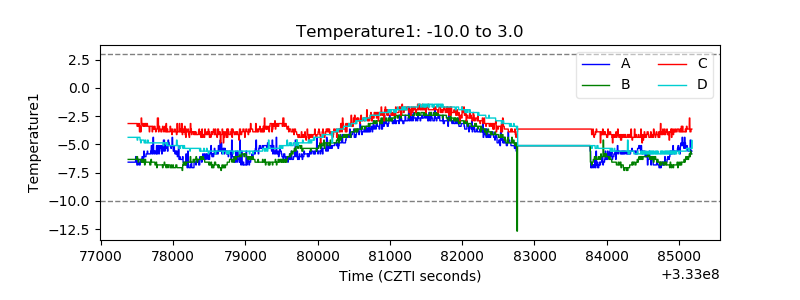 |
| Veto HV Monitor |  |
| Veto LLD | 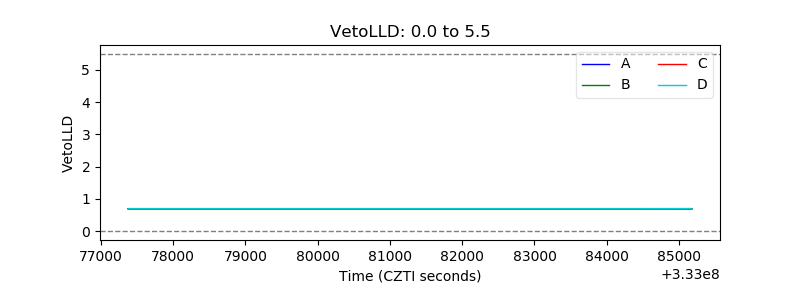 |
| Alpha Counter | 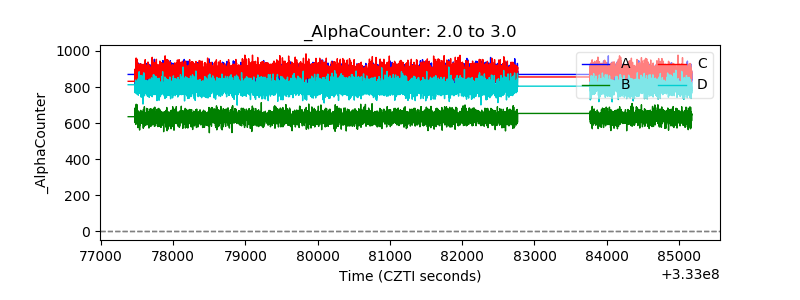 |
| _CPM_Rate | 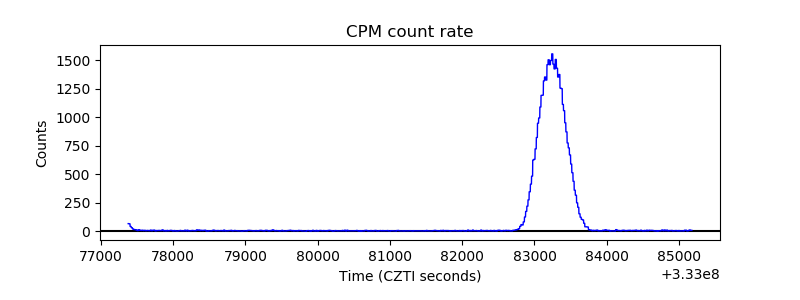 |
| CZT Counter | 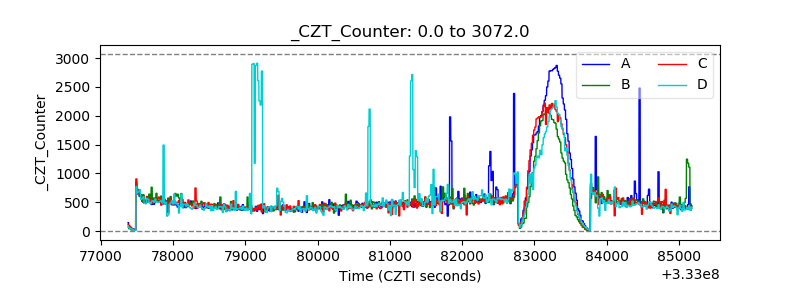 |
| +2.5 Volts monitor |  |
| +5 Volts monitor |  |
| _ROLL_ROT | 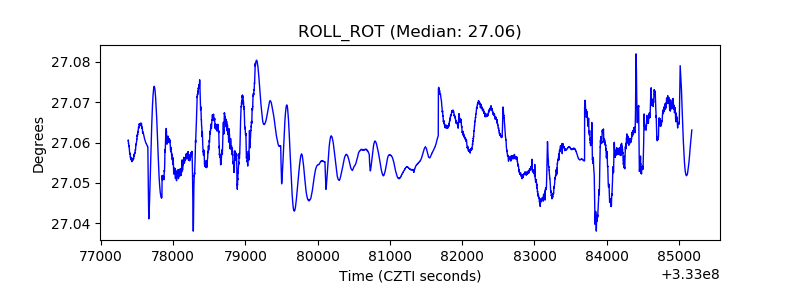 |
| _Roll_DEC | 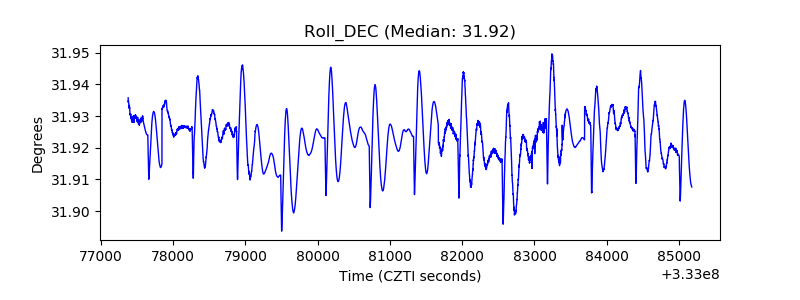 |
| _Roll_RA | 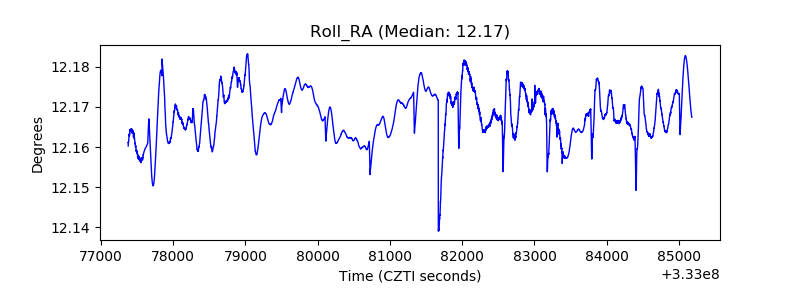 |
| Veto Counter | 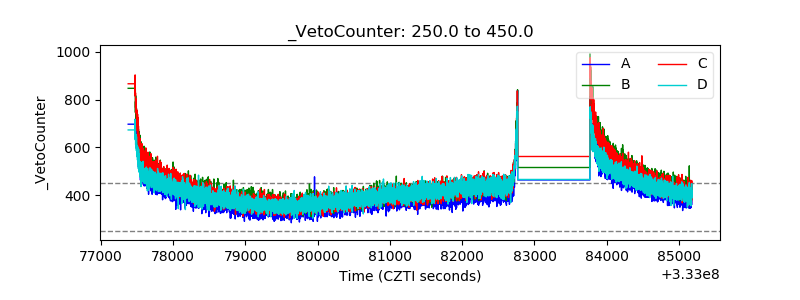 |