| Param | Original file | Final file |
|---|---|---|
| Filename | modeM0/AS1A09_033T02_9000003762_26037cztM0_level2.evt | modeM0/AS1A09_033T02_9000003762_26037cztM0_level2_quad_clean.evt |
| Size (bytes) | 435,185,280 | 91,512,000 |
| Size | 415.0 MB | 87.3 MB |
| Events in quadrant A | 3,201,200 | 593,806 |
| Events in quadrant B | 3,311,074 | 600,769 |
| Events in quadrant C | 3,040,964 | 569,574 |
| Events in quadrant D | 3,199,260 | 568,728 |
| Mode M9 | |||
|---|---|---|---|
| Quadrant | BADHDUFLAG | Total packets | Discarded packets |
| A | 0 | 11 | 0 |
| B | 0 | 11 | 0 |
| C | 0 | 11 | 0 |
| D | 0 | 11 | 0 |
| Mode M0 | |||
|---|---|---|---|
| Quadrant | BADHDUFLAG | Total packets | Discarded packets |
| A | 0 | 13427 | 0 |
| B | 0 | 13749 | 0 |
| C | 0 | 12986 | 0 |
| D | 0 | 13593 | 0 |
| Quadrant | Total seconds | Saturated seconds | Saturation percentage |
|---|---|---|---|
| A | 6280 | 47 | 0.748408% |
| B | 6281 | 80 | 1.273683% |
| C | 6281 | 55 | 0.875657% |
| D | 6281 | 24 | 0.382105% |
Noise dominated data is calculated using 1-second bins in cleaned event files. If a bin has >2000 counts, and if more than 50% of those come from <1% of pixels, then it is considered to be noise-dominated and hence unusable.
| Quadrant | # 1 sec bins | Bins with >0 counts | Bins with >2000 counts | High rate bins dominated by noise | Noise dominated (total time) | Noise dominated (detector-on time) | Marked lightcurve |
|---|---|---|---|---|---|---|---|
| A | 7430 | 6280 | 21 | 21 | 0.28% | 0.33% | 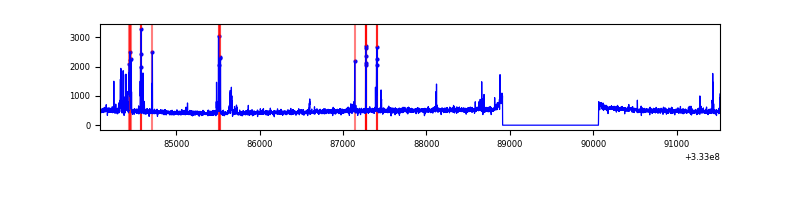 |
| B | 7431 | 6282 | 31 | 31 | 0.42% | 0.49% | 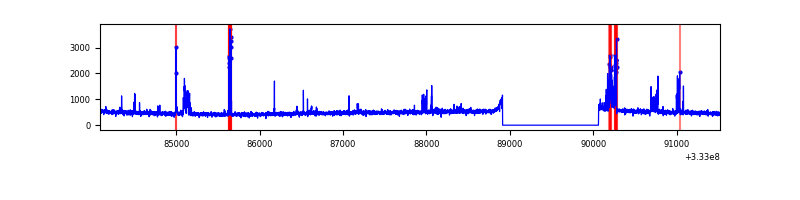 |
| C | 7431 | 6281 | 1 | 1 | 0.01% | 0.02% | 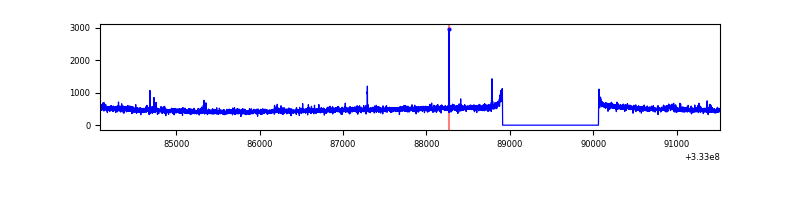 |
| D | 7431 | 6282 | 11 | 11 | 0.15% | 0.18% | 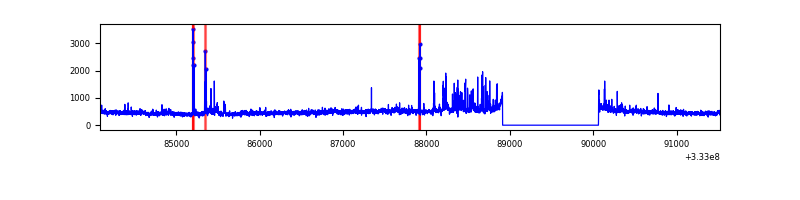 |
Top three noisy pixels from each quadrant. If the there are fewer than three noisy pixels in the level2.evt file, extra rows are filled as -1
| Pixel properties | Quadrant properties | ||||||
|---|---|---|---|---|---|---|---|
| Quadrant | DetID | PixID | Counts | Sigma | Mean | Median | Sigma |
| A | 0 | 13 | 201514 | 1299.92 | 778 | 765 | 154.4 |
| A | 13 | 254 | 9741 | 58.12 | 778 | 765 | 154.4 |
| A | 3 | 137 | 7047 | 40.68 | 778 | 765 | 154.4 |
| B | 10 | 245 | 150047 | 1020.42 | 771 | 753 | 146.3 |
| B | 0 | 229 | 119335 | 810.5 | 771 | 753 | 146.3 |
| B | 0 | 190 | 28940 | 192.66 | 771 | 753 | 146.3 |
| C | 14 | 238 | 121691 | 704.22 | 738 | 742 | 171.7 |
| C | 3 | 233 | 39003 | 222.77 | 738 | 742 | 171.7 |
| C | 2 | 16 | 7266 | 37.99 | 738 | 742 | 171.7 |
| D | 1 | 52 | 170622 | 944.09 | 747 | 729 | 180.0 |
| D | 7 | 80 | 111729 | 616.82 | 747 | 729 | 180.0 |
| D | 7 | 223 | 52101 | 285.47 | 747 | 729 | 180.0 |
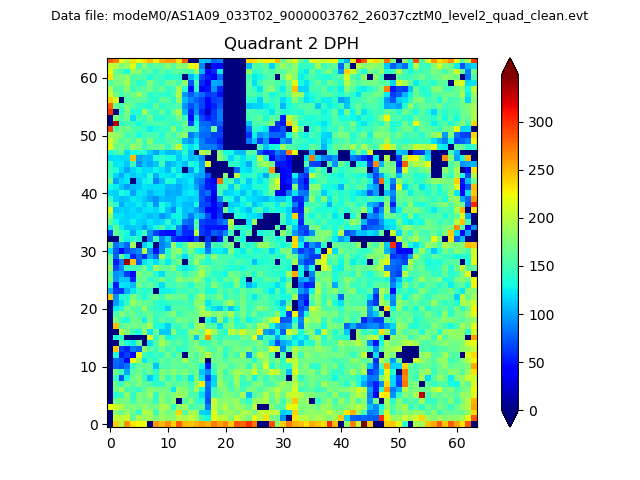
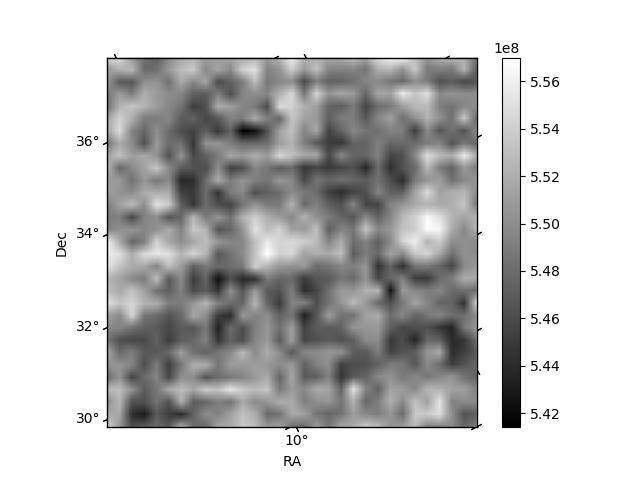
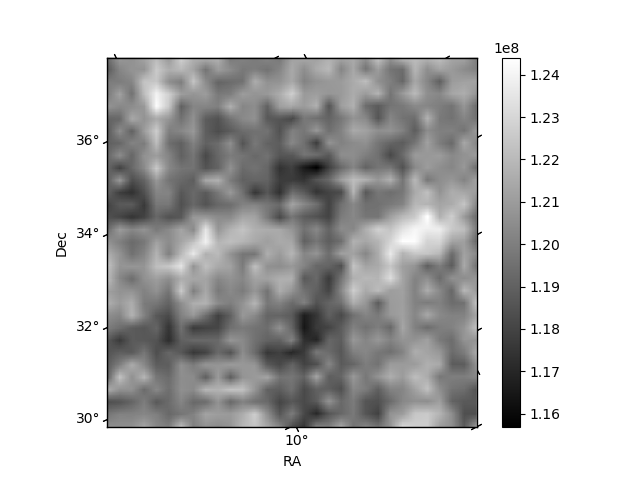
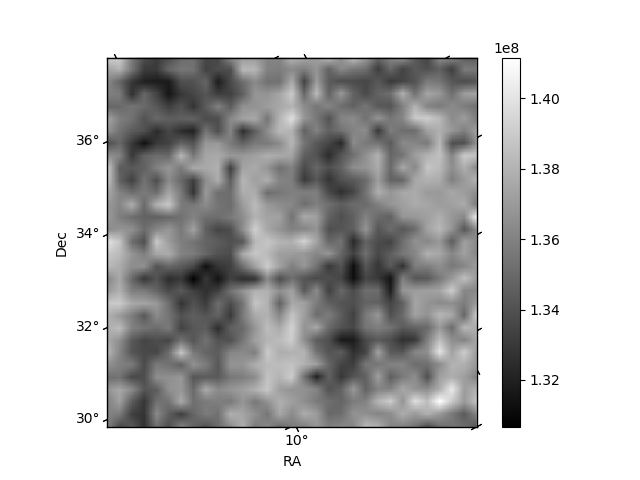
Histogram calculated using DETX and DETY for each event in the final _common_clean file
| Quadrant A | 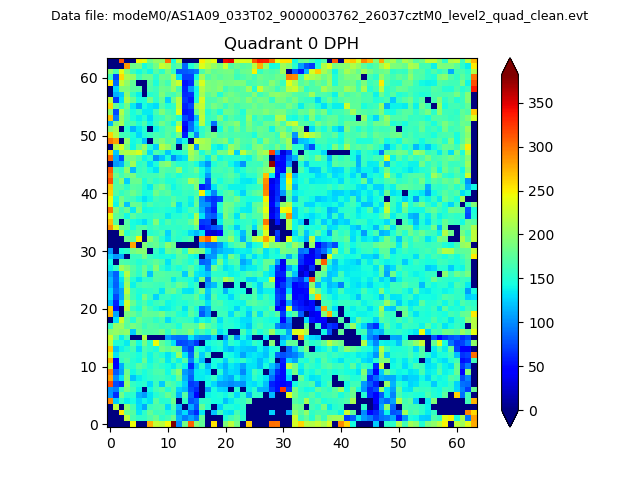 |
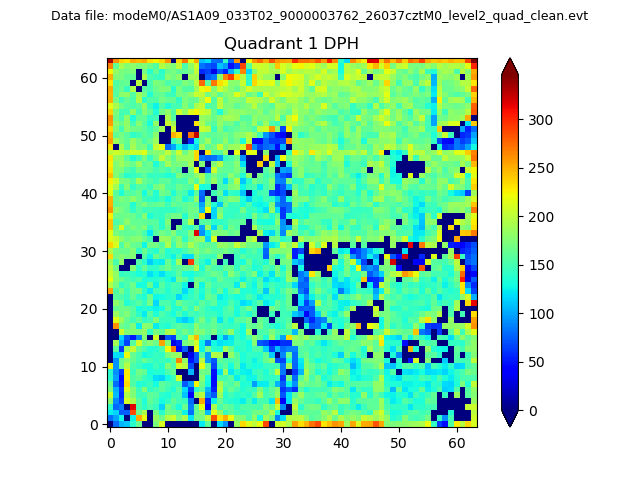 |
Quadrant B |
|---|---|---|---|
| Quadrant D | 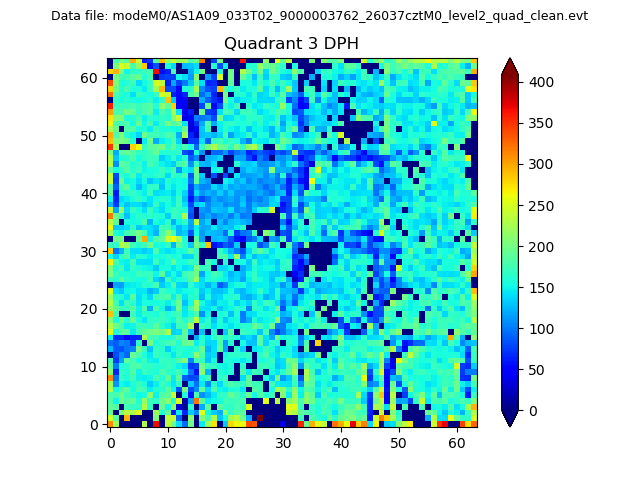 |
 |
Quadrant C |
| Plot type | Count rate plots | Images |
|---|---|---|
| Comparison with Poisson distribution Blue bars denote a histogram of data divided into 1 sec bins. Red curve is a Poisson curve with rate = median count rate of data. |
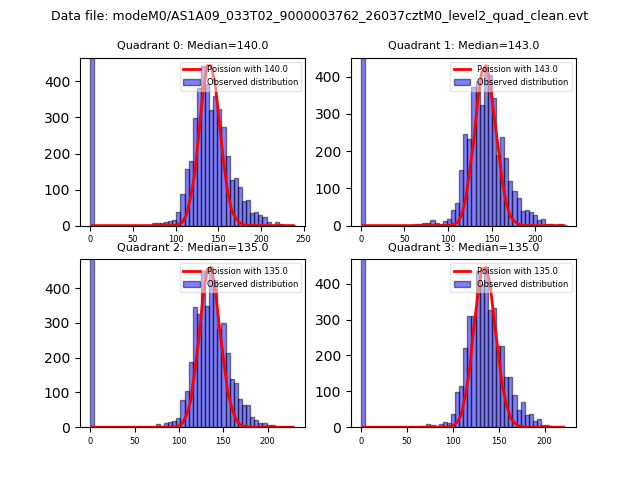 |
 |
| Quadrant-wise count rates Data is divided into 100 sec bins |
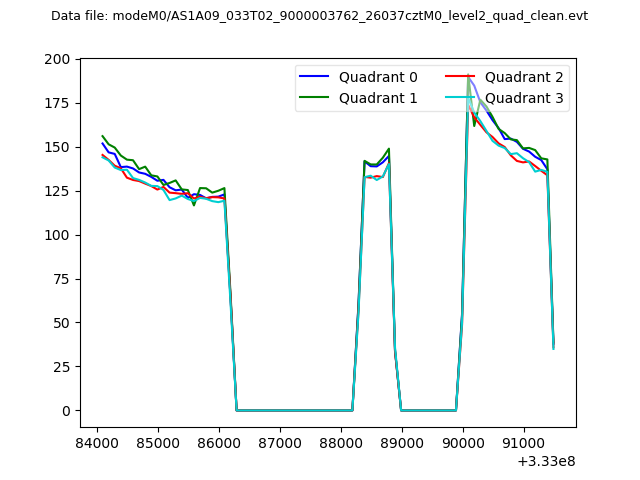 |
|
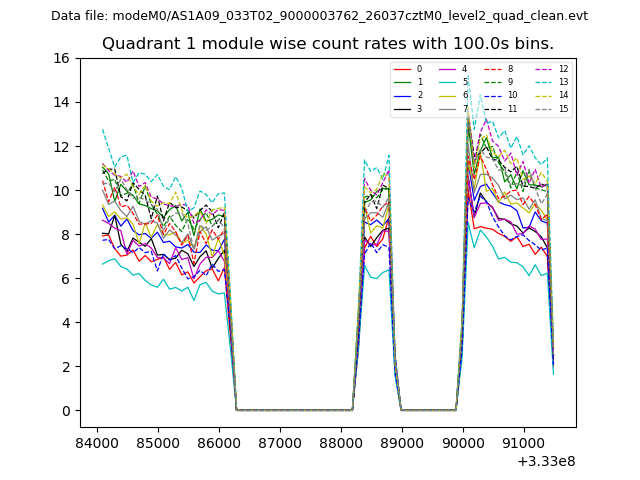
| Module-wise count rates for Quadrant A Data is divided into 100 sec bins |
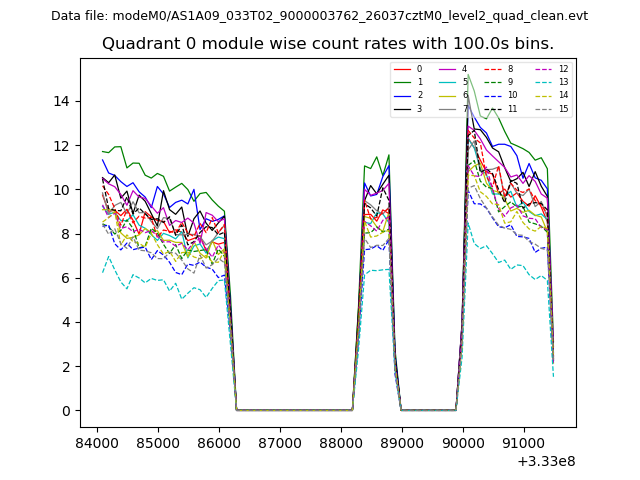 |
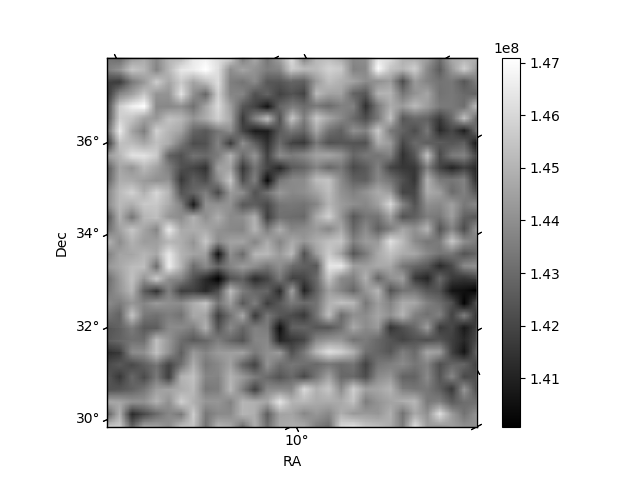 |
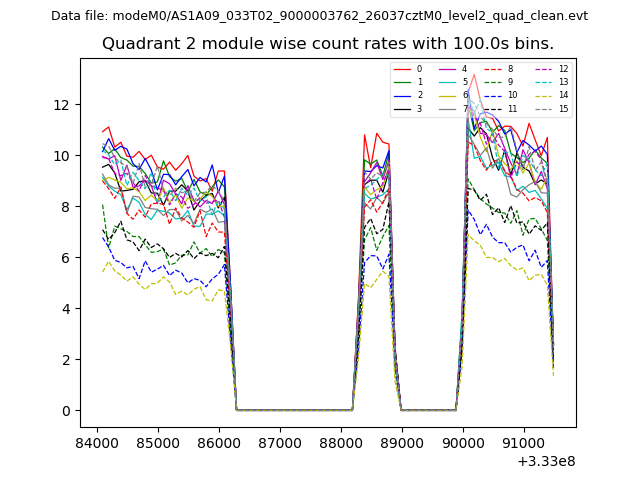
| Module-wise count rates for Quadrant B Data is divided into 100 sec bins |
 |
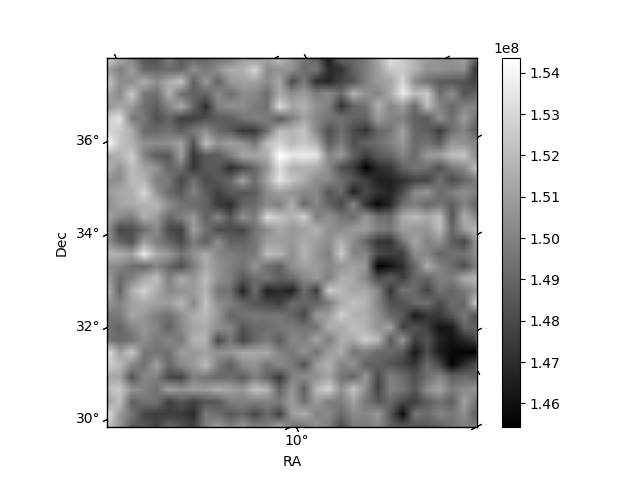 |
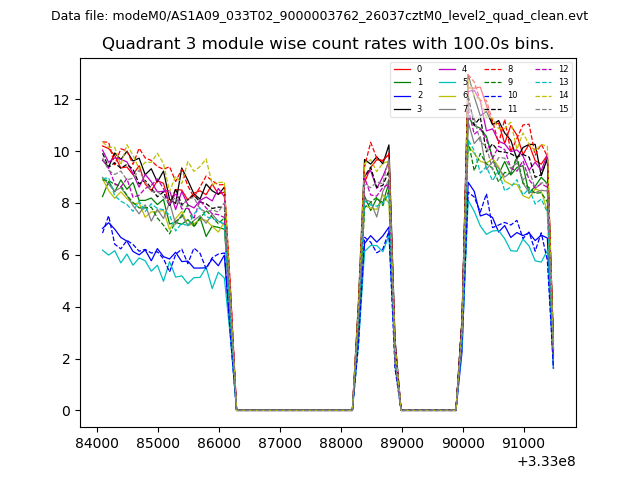
| Module-wise count rates for Quadrant C Data is divided into 100 sec bins |
 |
 |
| Module-wise count rates for Quadrant D Data is divided into 100 sec bins |
 |
 |
| Parameter | Plot |
|---|---|
| CZT HV Monitor | 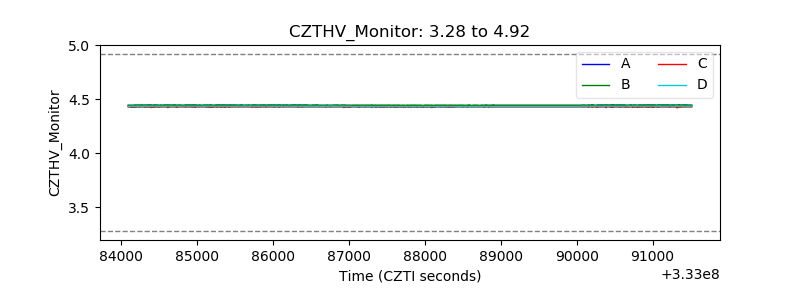 |
| D_VDD | 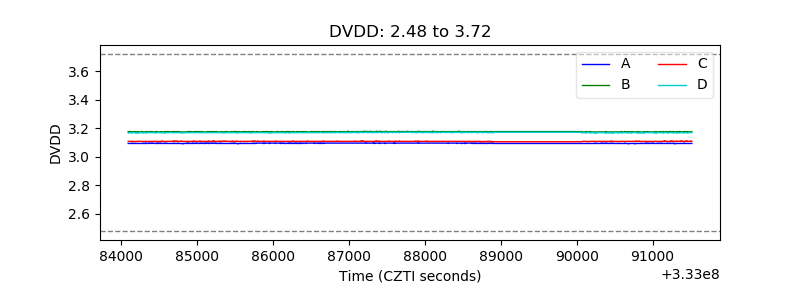 |
| Temperature 1 | 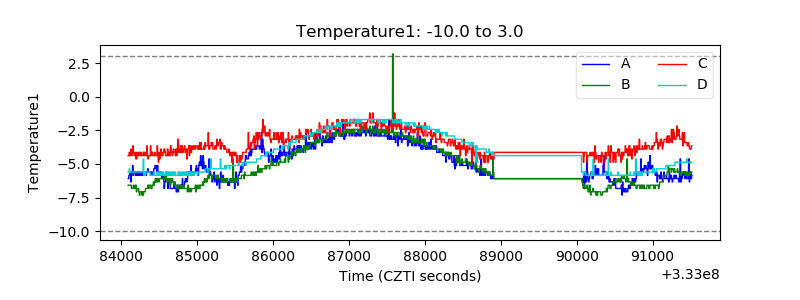 |
| Veto HV Monitor | 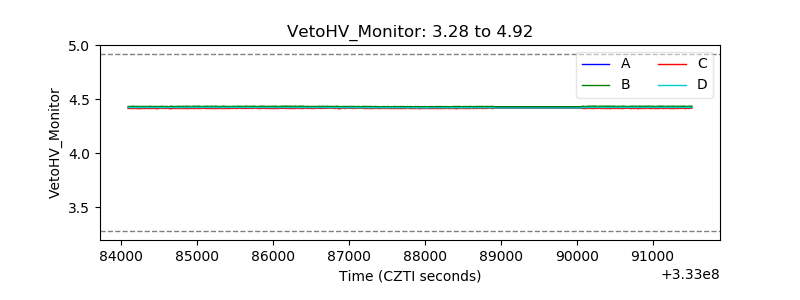 |
| Veto LLD | 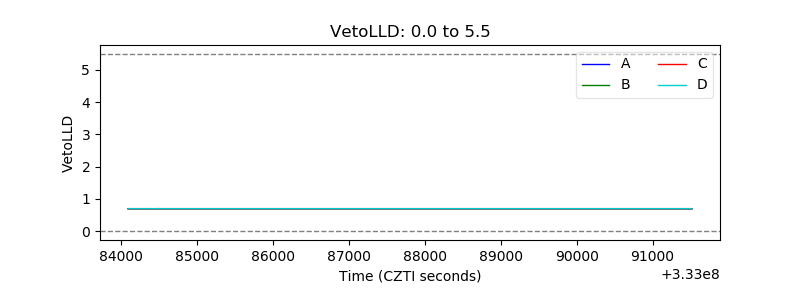 |
| Alpha Counter | 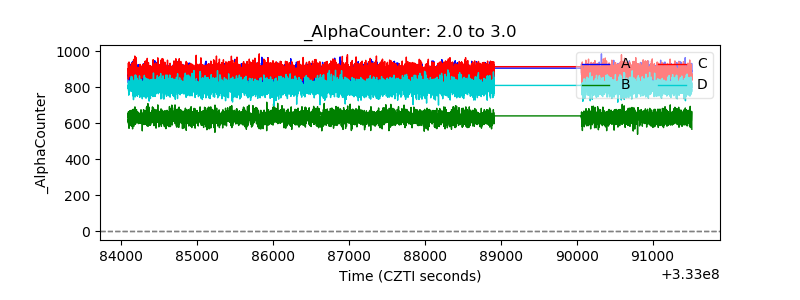 |
| _CPM_Rate | 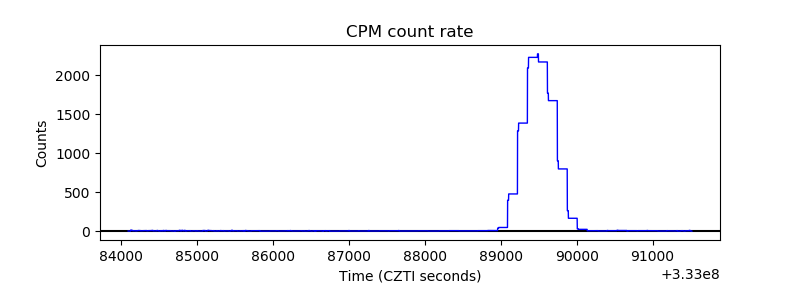 |
| CZT Counter | 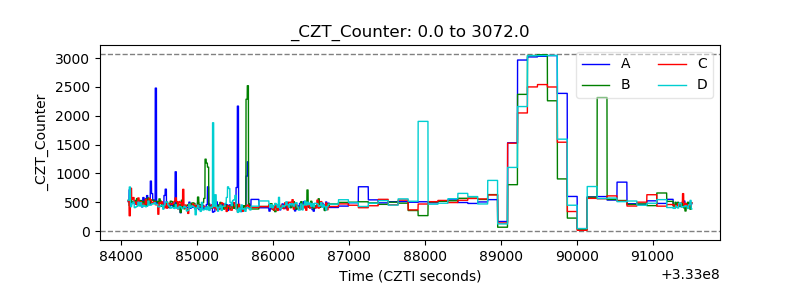 |
| +2.5 Volts monitor |  |
| +5 Volts monitor | 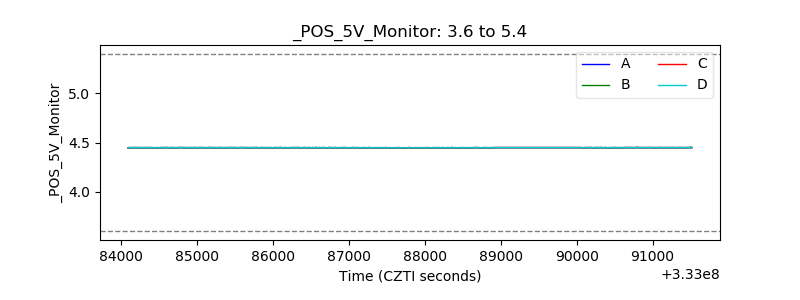 |
| _ROLL_ROT | 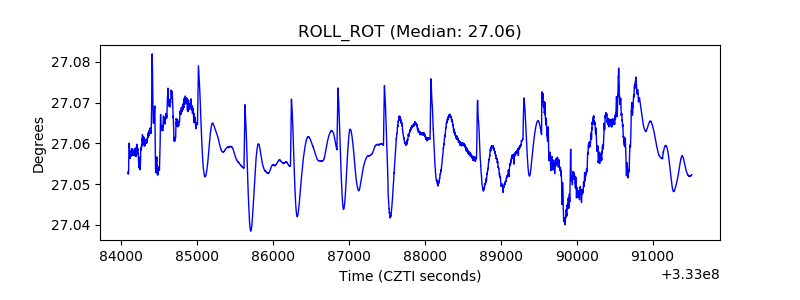 |
| _Roll_DEC | 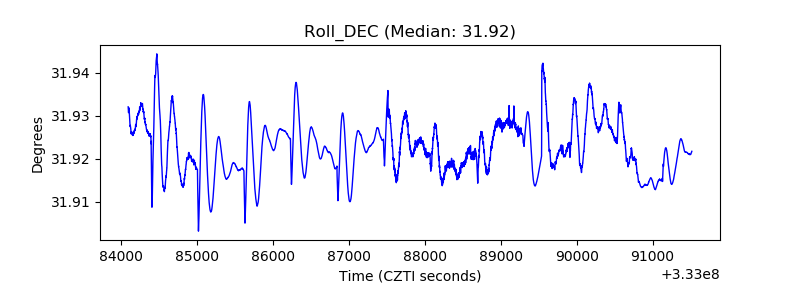 |
| _Roll_RA | 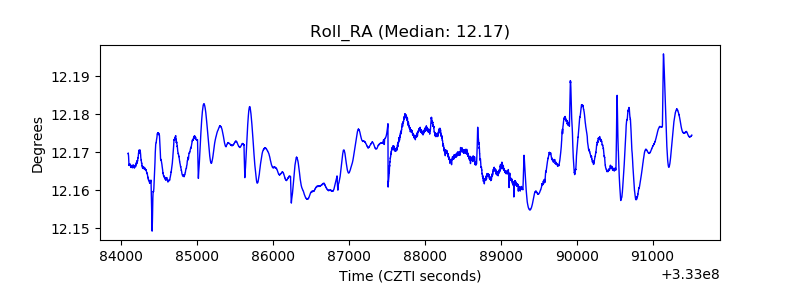 |
| Veto Counter | 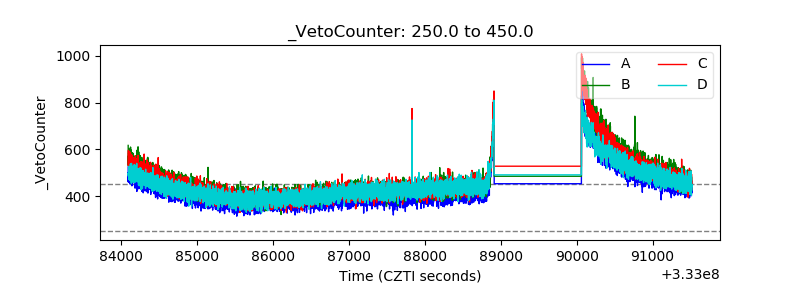 |