| Param | Original file | Final file |
|---|---|---|
| Filename | modeM0/AS1A09_033T02_9000003762_26039cztM0_level2.evt | modeM0/AS1A09_033T02_9000003762_26039cztM0_level2_quad_clean.evt |
| Size (bytes) | 452,753,280 | 89,017,920 |
| Size | 431.8 MB | 84.9 MB |
| Events in quadrant A | 3,255,918 | 585,064 |
| Events in quadrant B | 3,405,918 | 587,807 |
| Events in quadrant C | 3,147,081 | 550,375 |
| Events in quadrant D | 3,494,949 | 553,105 |
| Mode M9 | |||
|---|---|---|---|
| Quadrant | BADHDUFLAG | Total packets | Discarded packets |
| A | 0 | 13 | 0 |
| B | 0 | 13 | 0 |
| C | 0 | 13 | 0 |
| D | 0 | 13 | 0 |
| Mode M0 | |||
|---|---|---|---|
| Quadrant | BADHDUFLAG | Total packets | Discarded packets |
| A | 0 | 13039 | 0 |
| B | 0 | 13547 | 0 |
| C | 0 | 12738 | 0 |
| D | 0 | 13992 | 0 |
| Quadrant | Total seconds | Saturated seconds | Saturation percentage |
|---|---|---|---|
| A | 6005 | 61 | 1.015820% |
| B | 6006 | 119 | 1.981352% |
| C | 6006 | 83 | 1.381951% |
| D | 6006 | 88 | 1.465201% |
Noise dominated data is calculated using 1-second bins in cleaned event files. If a bin has >2000 counts, and if more than 50% of those come from <1% of pixels, then it is considered to be noise-dominated and hence unusable.
| Quadrant | # 1 sec bins | Bins with >0 counts | Bins with >2000 counts | High rate bins dominated by noise | Noise dominated (total time) | Noise dominated (detector-on time) | Marked lightcurve |
|---|---|---|---|---|---|---|---|
| A | 7310 | 6005 | 1 | 1 | 0.01% | 0.02% | 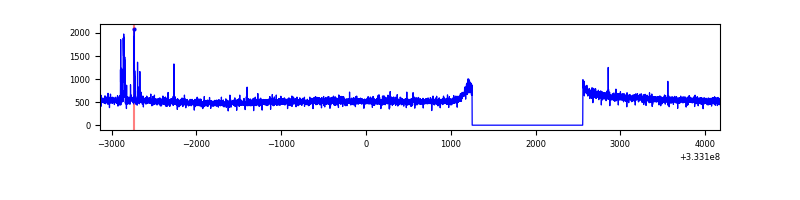 |
| B | 7311 | 6006 | 39 | 39 | 0.53% | 0.65% | 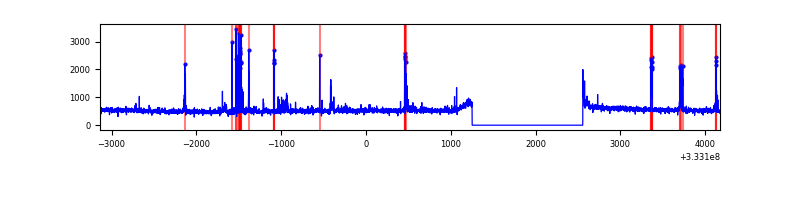 |
| C | 7311 | 6007 | 0 | 0 | 0.00% | 0.00% | 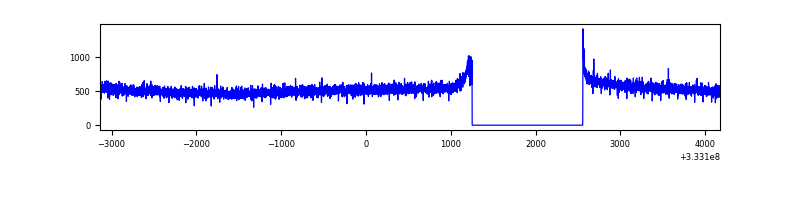 |
| D | 7311 | 6006 | 34 | 34 | 0.47% | 0.57% | 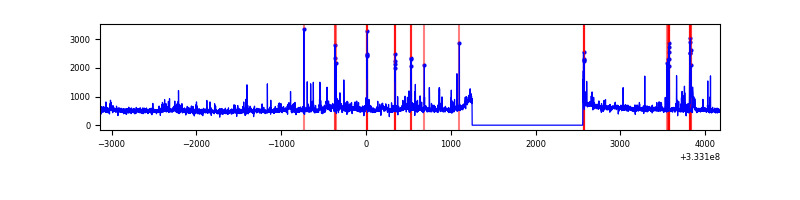 |
Top three noisy pixels from each quadrant. If the there are fewer than three noisy pixels in the level2.evt file, extra rows are filled as -1
| Pixel properties | Quadrant properties | ||||||
|---|---|---|---|---|---|---|---|
| Quadrant | DetID | PixID | Counts | Sigma | Mean | Median | Sigma |
| A | 0 | 13 | 50633 | 303.92 | 832 | 819 | 163.9 |
| A | 13 | 254 | 8400 | 46.25 | 832 | 819 | 163.9 |
| A | 0 | 226 | 7204 | 38.96 | 832 | 819 | 163.9 |
| B | 10 | 245 | 163530 | 1068.43 | 807 | 789 | 152.3 |
| B | 0 | 229 | 40763 | 262.44 | 807 | 789 | 152.3 |
| B | 0 | 230 | 26457 | 168.52 | 807 | 789 | 152.3 |
| C | 14 | 238 | 127039 | 710.53 | 772 | 779 | 177.7 |
| C | 0 | 10 | 6149 | 30.22 | 772 | 779 | 177.7 |
| C | 3 | 233 | 5359 | 25.77 | 772 | 779 | 177.7 |
| D | 1 | 52 | 383183 | 2006.39 | 794 | 777 | 190.6 |
| D | 7 | 223 | 63966 | 331.54 | 794 | 777 | 190.6 |
| D | 2 | 234 | 19585 | 98.68 | 794 | 777 | 190.6 |
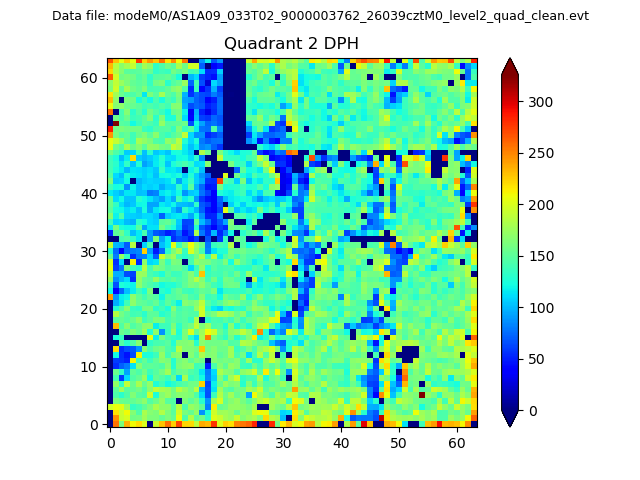
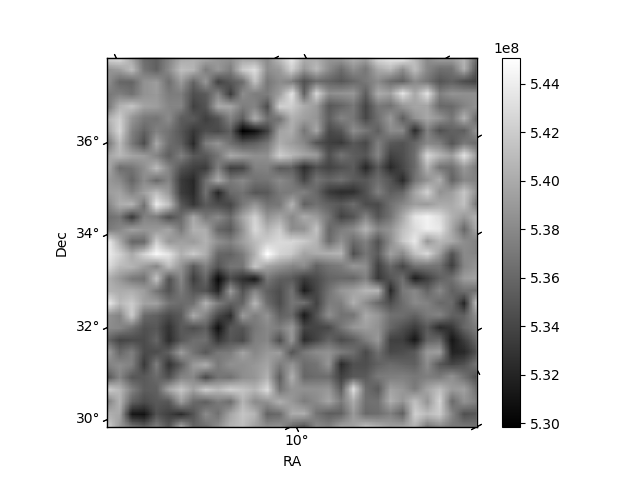
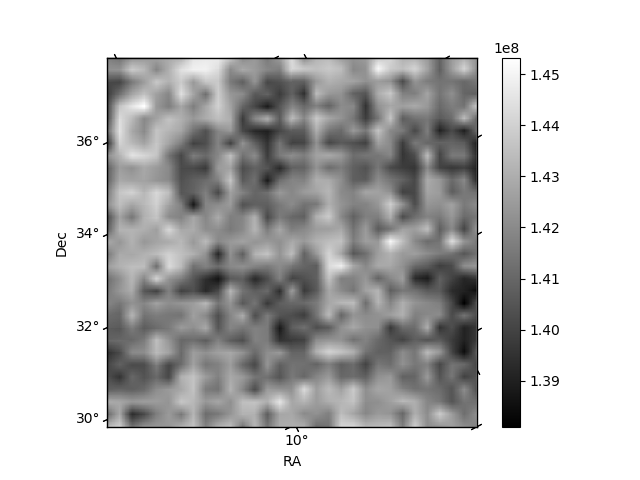
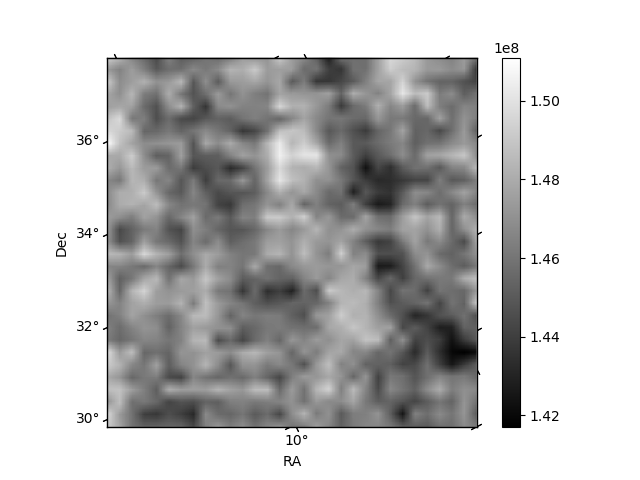
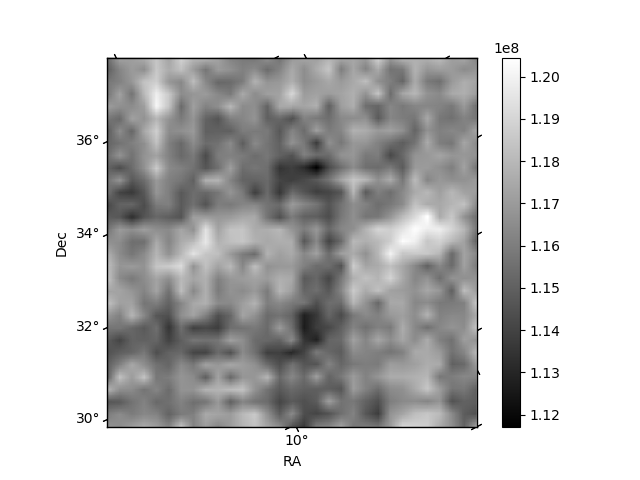
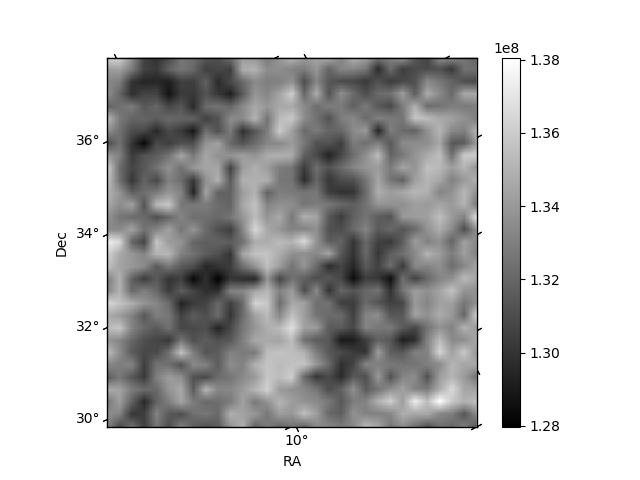
Histogram calculated using DETX and DETY for each event in the final _common_clean file
| Quadrant A | 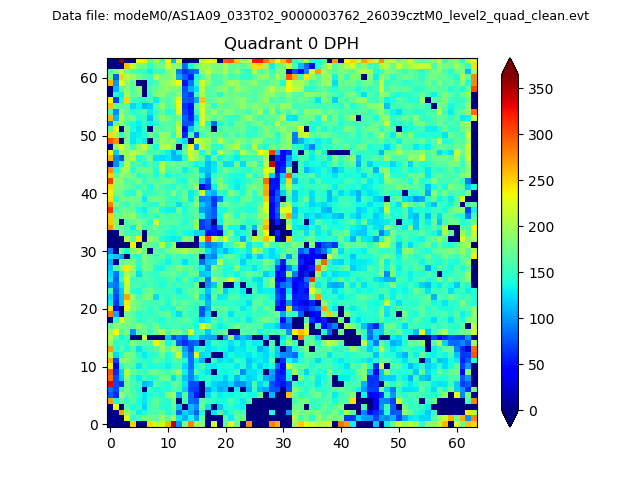 |
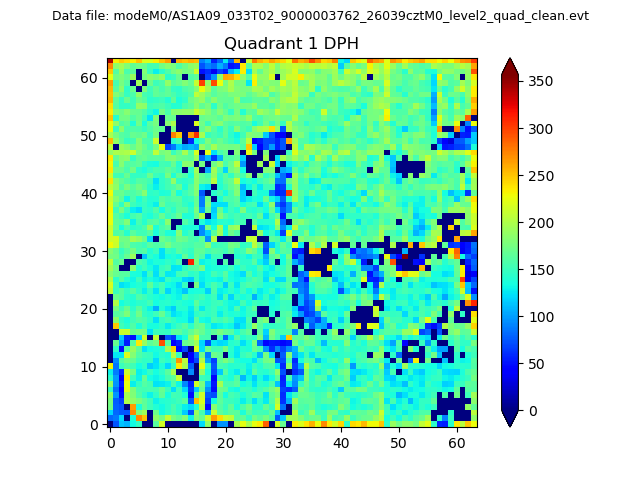 |
Quadrant B |
|---|---|---|---|
| Quadrant D | 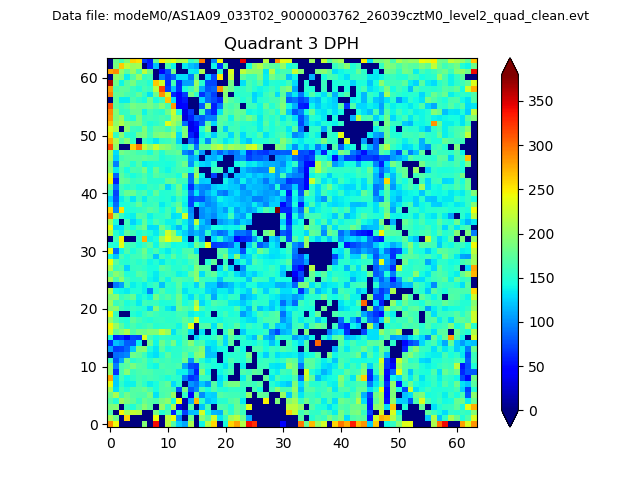 |
 |
Quadrant C |
| Plot type | Count rate plots | Images |
|---|---|---|
| Comparison with Poisson distribution Blue bars denote a histogram of data divided into 1 sec bins. Red curve is a Poisson curve with rate = median count rate of data. |
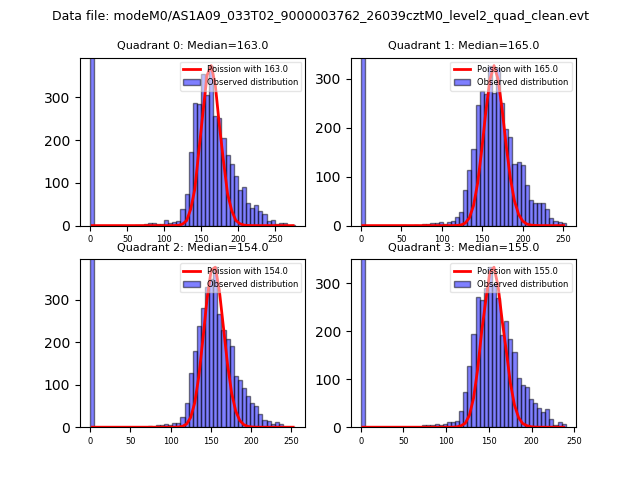 |
 |
| Quadrant-wise count rates Data is divided into 100 sec bins |
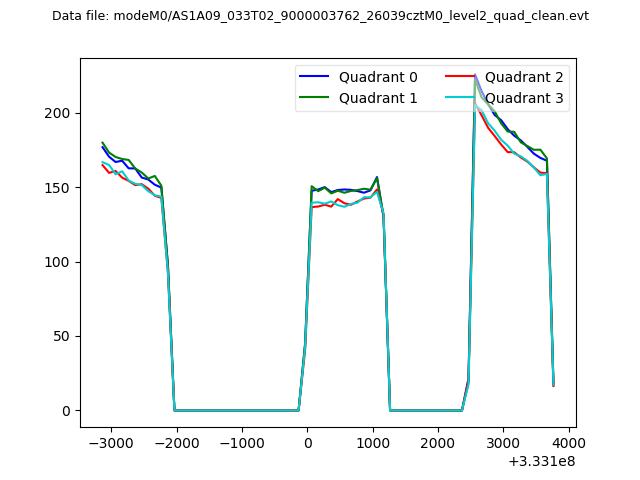 |
|
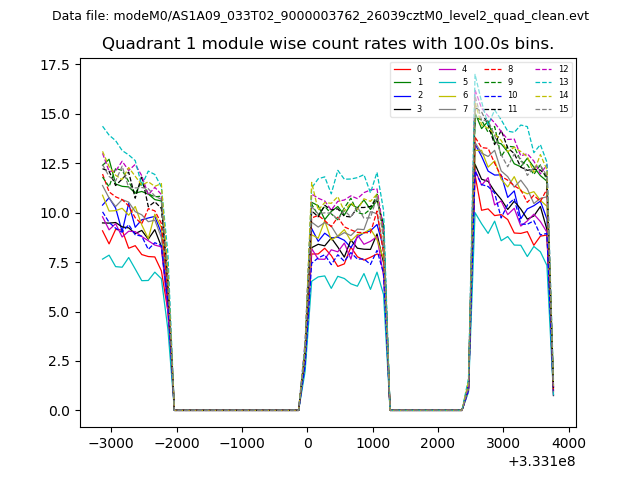
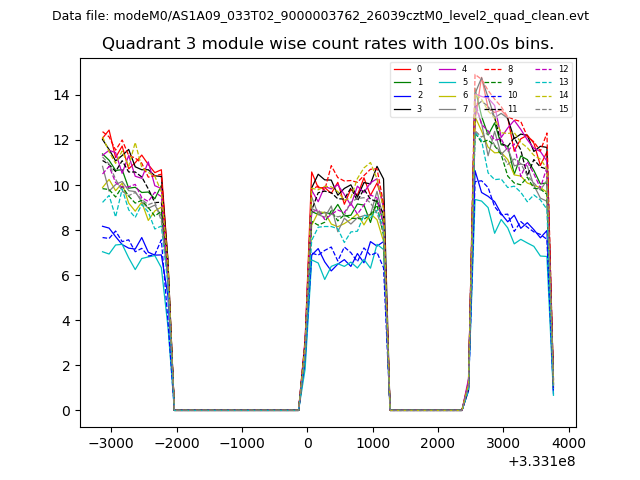
| Module-wise count rates for Quadrant A Data is divided into 100 sec bins |
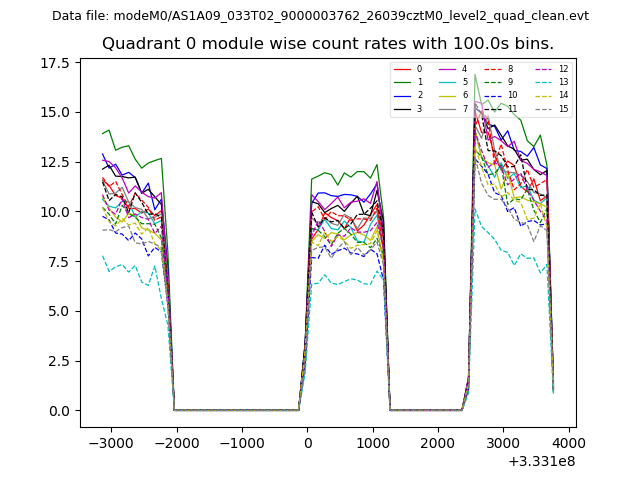 |
 |
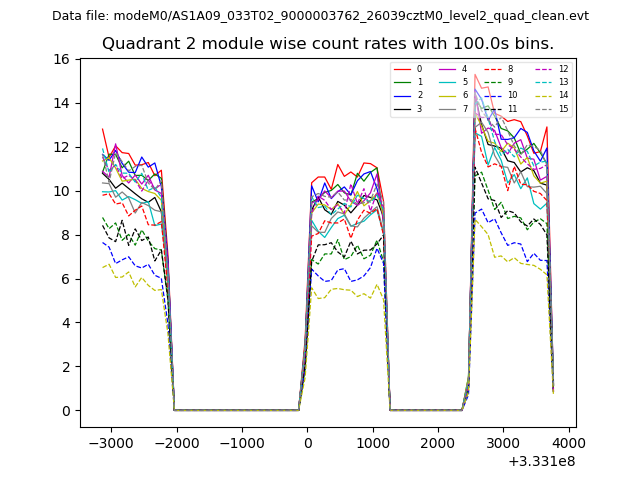
| Module-wise count rates for Quadrant B Data is divided into 100 sec bins |
 |
 |
| Module-wise count rates for Quadrant C Data is divided into 100 sec bins |
 |
 |
| Module-wise count rates for Quadrant D Data is divided into 100 sec bins |
 |
 |
| Parameter | Plot |
|---|---|
| CZT HV Monitor | 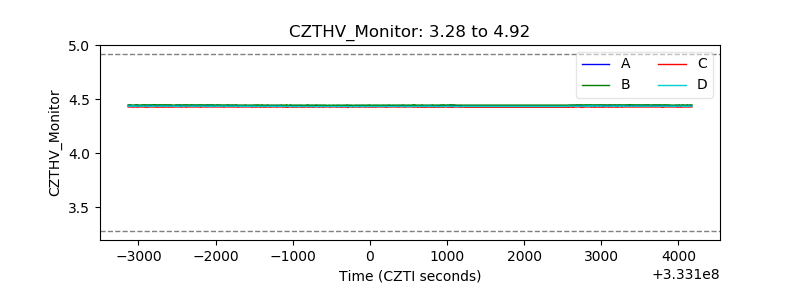 |
| D_VDD | 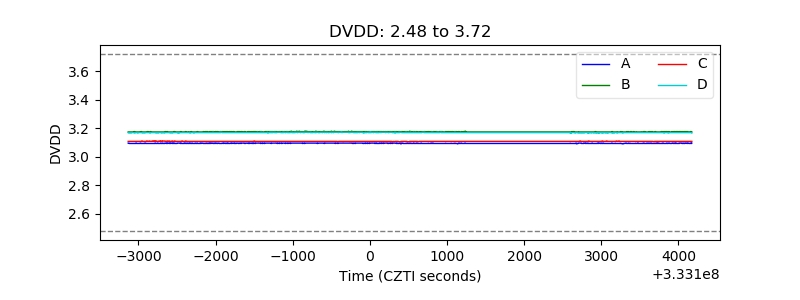 |
| Temperature 1 | 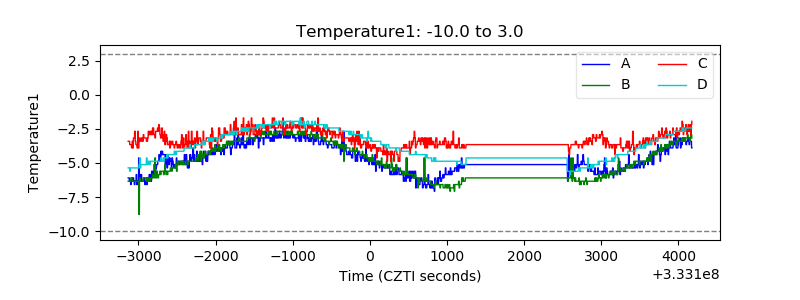 |
| Veto HV Monitor | 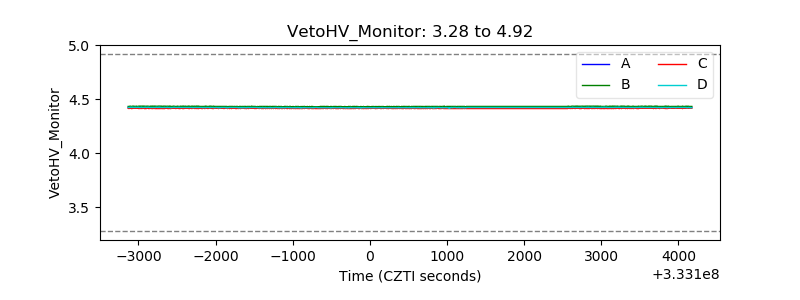 |
| Veto LLD | 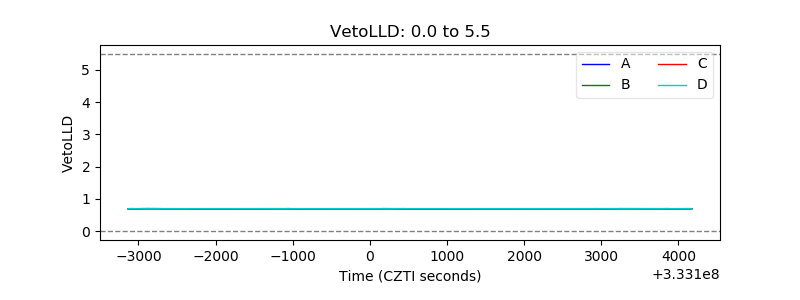 |
| Alpha Counter | 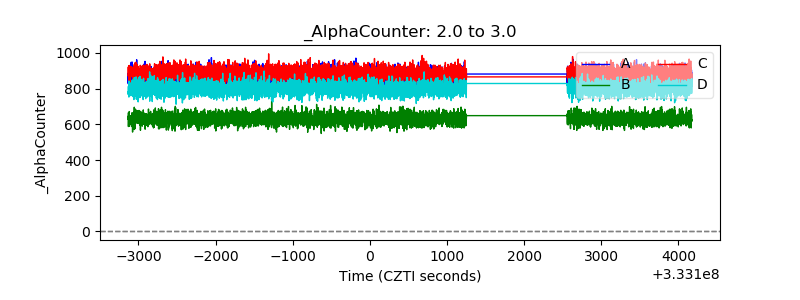 |
| _CPM_Rate | 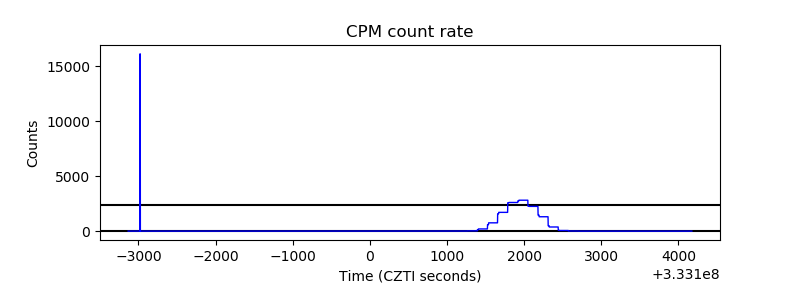 |
| CZT Counter | 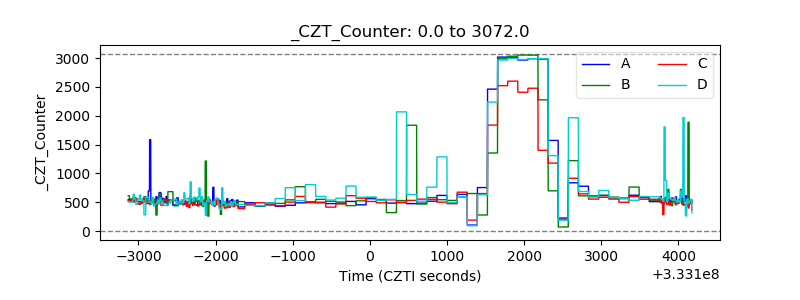 |
| +2.5 Volts monitor |  |
| +5 Volts monitor | 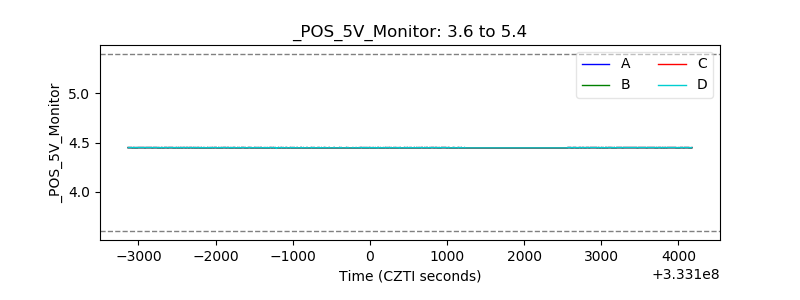 |
| _ROLL_ROT | 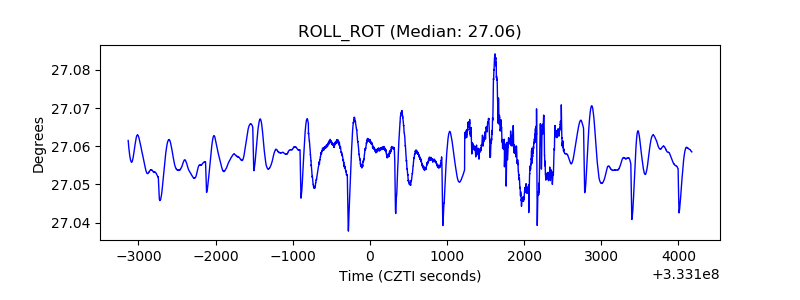 |
| _Roll_DEC | 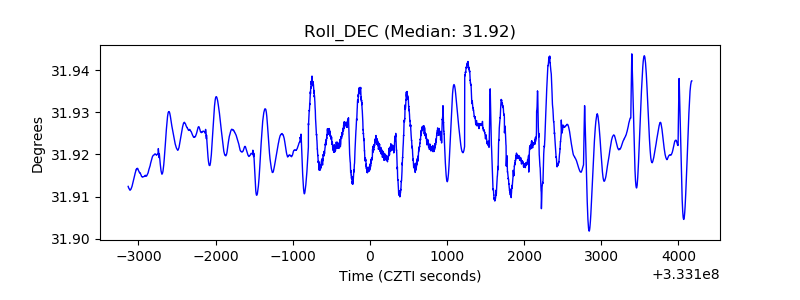 |
| _Roll_RA | 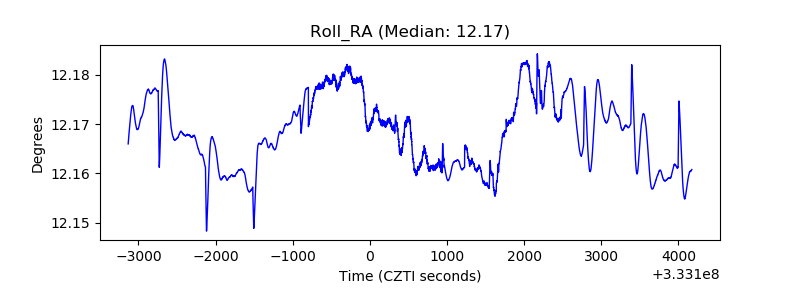 |
| Veto Counter | 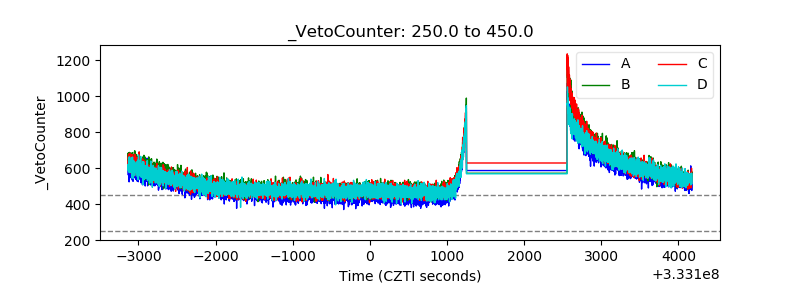 |