| Param | Original file | Final file |
|---|---|---|
| Filename | modeM0/AS1A09_033T02_9000003762_26040cztM0_level2.evt | modeM0/AS1A09_033T02_9000003762_26040cztM0_level2_quad_clean.evt |
| Size (bytes) | 499,210,560 | 76,377,600 |
| Size | 476.1 MB | 72.8 MB |
| Events in quadrant A | 2,992,617 | 497,425 |
| Events in quadrant B | 3,095,243 | 501,100 |
| Events in quadrant C | 2,969,990 | 468,756 |
| Events in quadrant D | 5,688,448 | 461,186 |
| Mode M9 | |||
|---|---|---|---|
| Quadrant | BADHDUFLAG | Total packets | Discarded packets |
| A | 0 | 14 | 0 |
| B | 0 | 14 | 0 |
| C | 0 | 14 | 0 |
| D | 0 | 14 | 0 |
| Mode M0 | |||
|---|---|---|---|
| Quadrant | BADHDUFLAG | Total packets | Discarded packets |
| A | 0 | 11947 | 0 |
| B | 0 | 12257 | 0 |
| C | 0 | 11855 | 0 |
| D | 0 | 20309 | 0 |
| Quadrant | Total seconds | Saturated seconds | Saturation percentage |
|---|---|---|---|
| A | 5497 | 57 | 1.036929% |
| B | 5497 | 94 | 1.710024% |
| C | 5497 | 88 | 1.600873% |
| D | 5497 | 716 | 13.025287% |
Noise dominated data is calculated using 1-second bins in cleaned event files. If a bin has >2000 counts, and if more than 50% of those come from <1% of pixels, then it is considered to be noise-dominated and hence unusable.
| Quadrant | # 1 sec bins | Bins with >0 counts | Bins with >2000 counts | High rate bins dominated by noise | Noise dominated (total time) | Noise dominated (detector-on time) | Marked lightcurve |
|---|---|---|---|---|---|---|---|
| A | 6862 | 5497 | 0 | 0 | 0.00% | 0.00% | 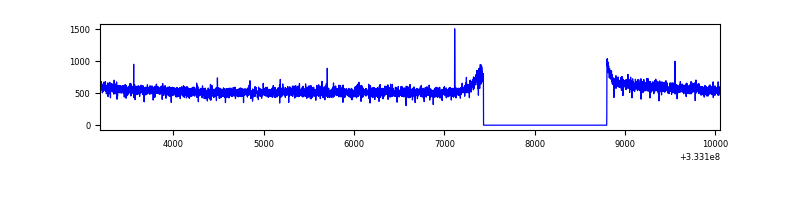 |
| B | 6862 | 5497 | 25 | 25 | 0.36% | 0.45% | 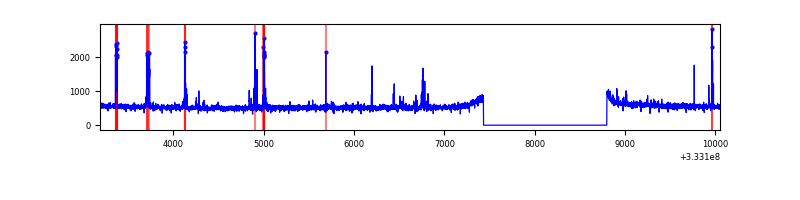 |
| C | 6862 | 5498 | 0 | 0 | 0.00% | 0.00% | 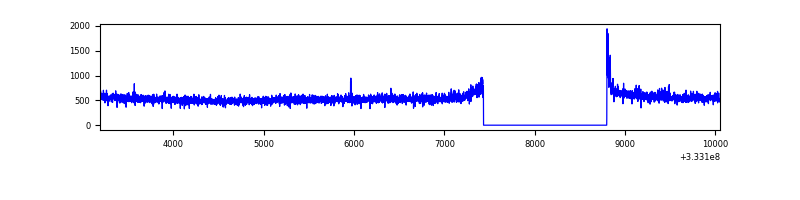 |
| D | 6862 | 5497 | 744 | 744 | 10.84% | 13.53% | 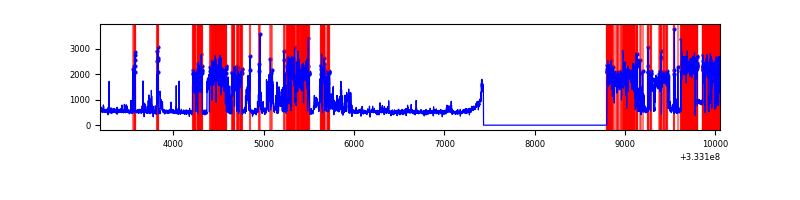 |
Top three noisy pixels from each quadrant. If the there are fewer than three noisy pixels in the level2.evt file, extra rows are filled as -1
| Pixel properties | Quadrant properties | ||||||
|---|---|---|---|---|---|---|---|
| Quadrant | DetID | PixID | Counts | Sigma | Mean | Median | Sigma |
| A | 13 | 254 | 7289 | 42.42 | 776 | 763 | 153.8 |
| A | 0 | 226 | 6673 | 38.42 | 776 | 763 | 153.8 |
| A | 3 | 137 | 6597 | 37.92 | 776 | 763 | 153.8 |
| B | 10 | 245 | 72439 | 504.82 | 754 | 736 | 142.0 |
| B | 0 | 229 | 40608 | 280.72 | 754 | 736 | 142.0 |
| B | 0 | 230 | 35638 | 245.72 | 754 | 736 | 142.0 |
| C | 14 | 238 | 120265 | 721.48 | 721 | 726 | 165.7 |
| C | 3 | 233 | 36950 | 218.63 | 721 | 726 | 165.7 |
| C | 13 | 61 | 4871 | 25.02 | 721 | 726 | 165.7 |
| D | 1 | 52 | 2890245 | 16650.63 | 724 | 708 | 173.5 |
| D | 7 | 223 | 36892 | 208.51 | 724 | 708 | 173.5 |
| D | 2 | 234 | 18907 | 104.87 | 724 | 708 | 173.5 |
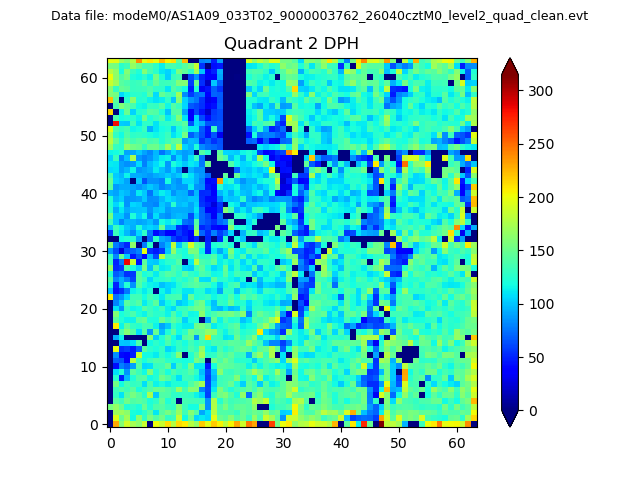
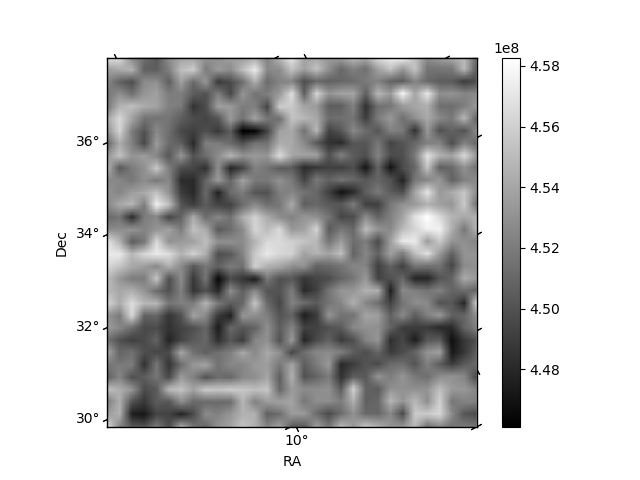
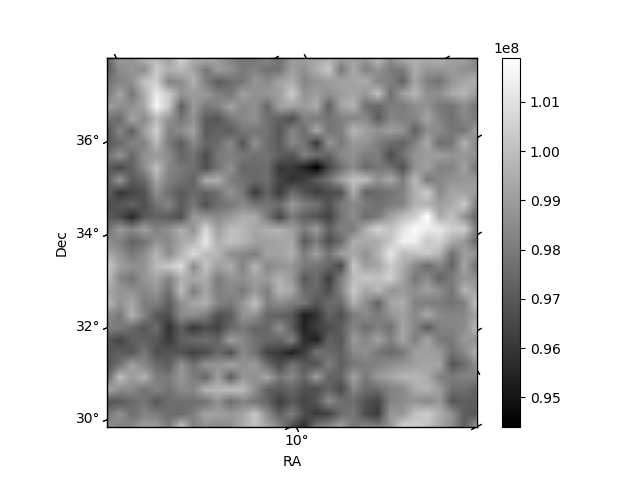
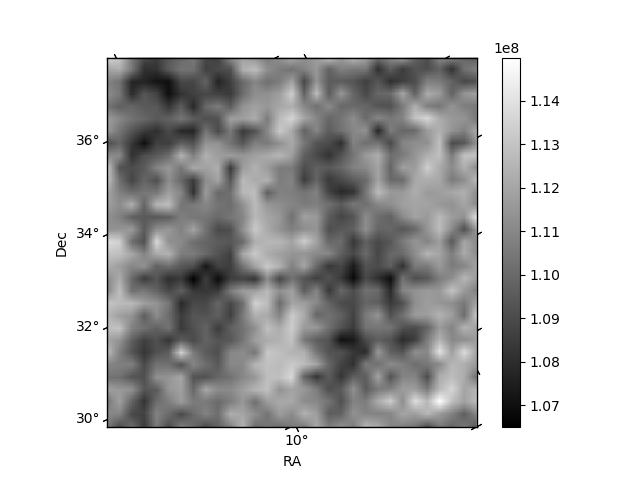
Histogram calculated using DETX and DETY for each event in the final _common_clean file
| Quadrant A | 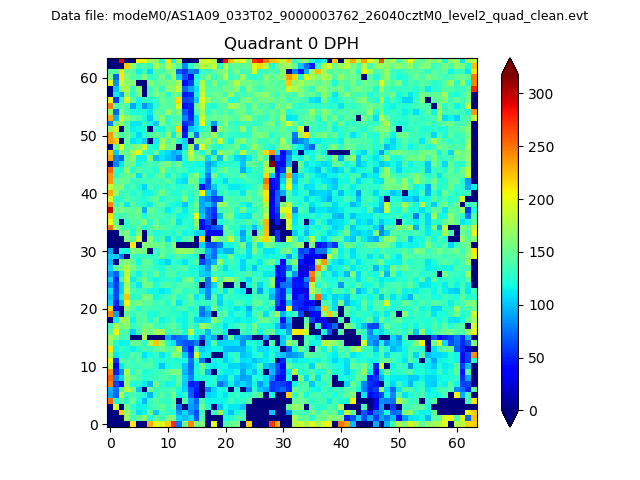 |
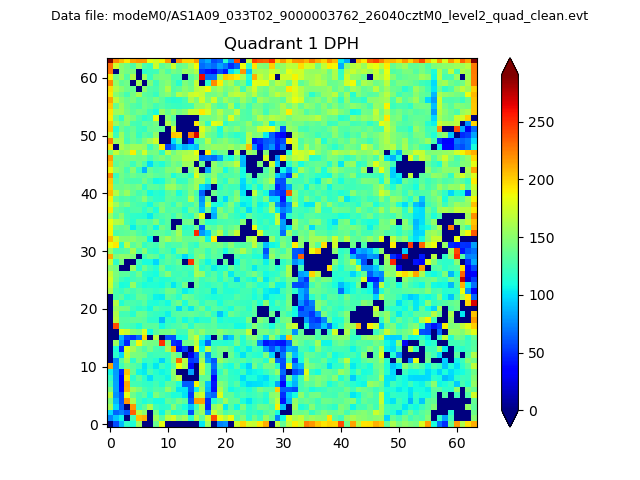 |
Quadrant B |
|---|---|---|---|
| Quadrant D | 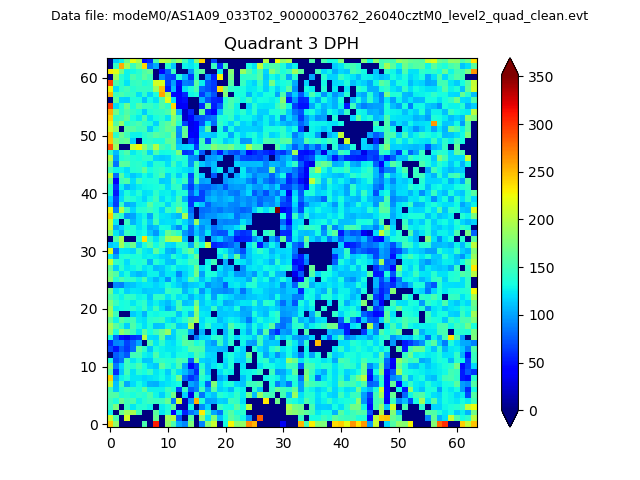 |
 |
Quadrant C |
| Plot type | Count rate plots | Images |
|---|---|---|
| Comparison with Poisson distribution Blue bars denote a histogram of data divided into 1 sec bins. Red curve is a Poisson curve with rate = median count rate of data. |
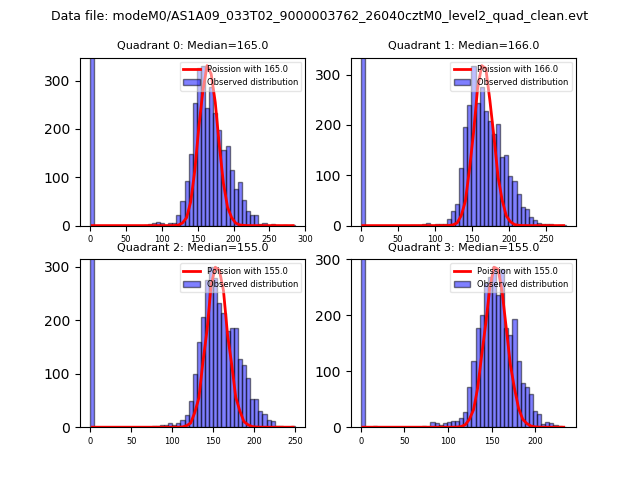 |
 |
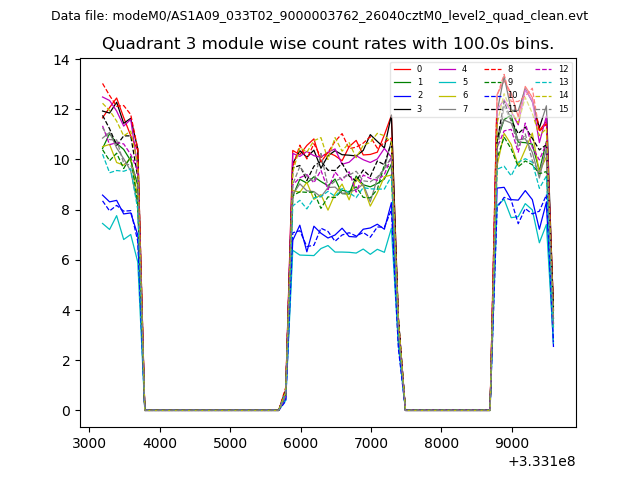
| Quadrant-wise count rates Data is divided into 100 sec bins |
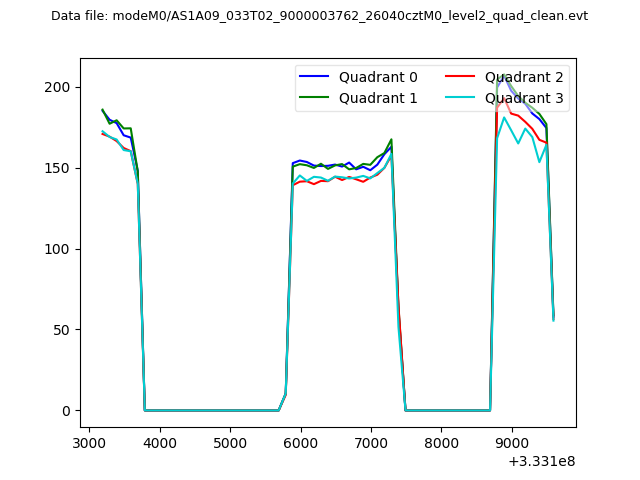 |
|
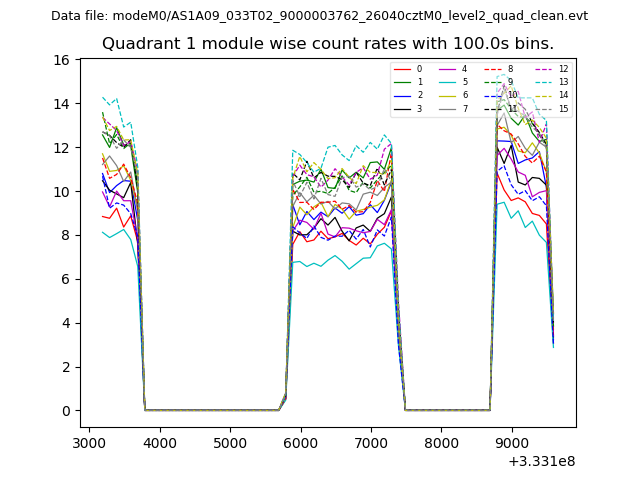
| Module-wise count rates for Quadrant A Data is divided into 100 sec bins |
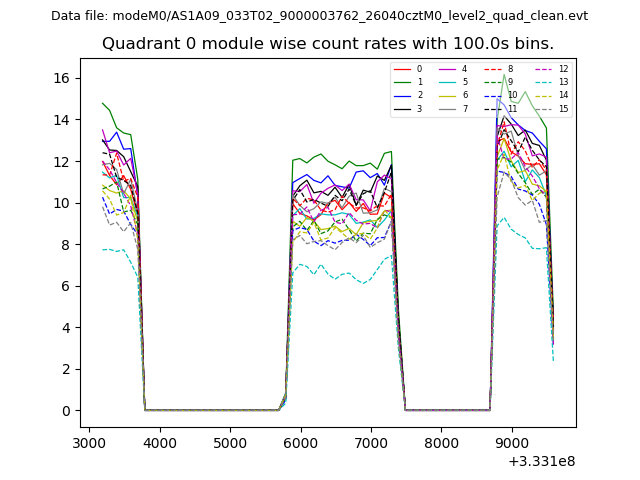 |
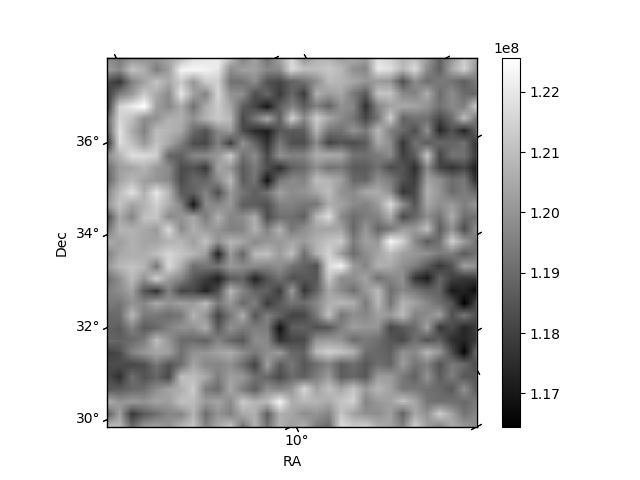 |
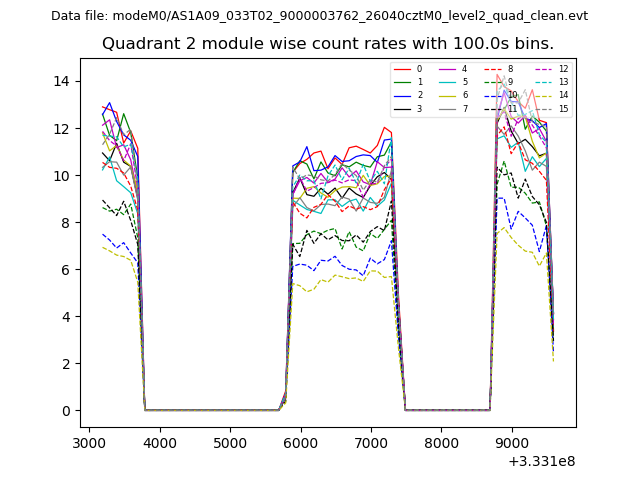
| Module-wise count rates for Quadrant B Data is divided into 100 sec bins |
 |
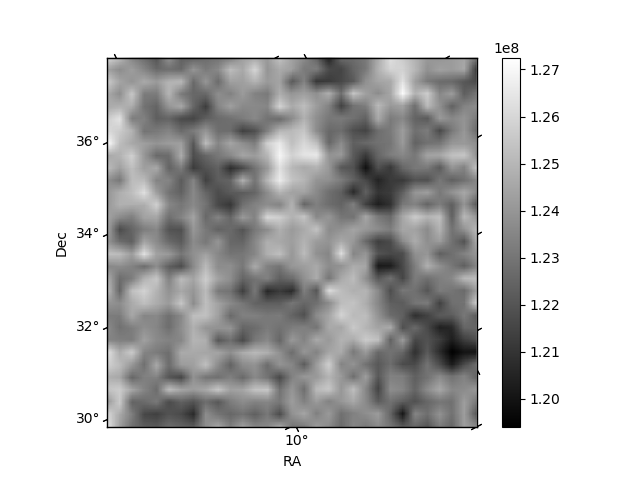 |
| Module-wise count rates for Quadrant C Data is divided into 100 sec bins |
 |
 |
| Module-wise count rates for Quadrant D Data is divided into 100 sec bins |
 |
 |
| Parameter | Plot |
|---|---|
| CZT HV Monitor | 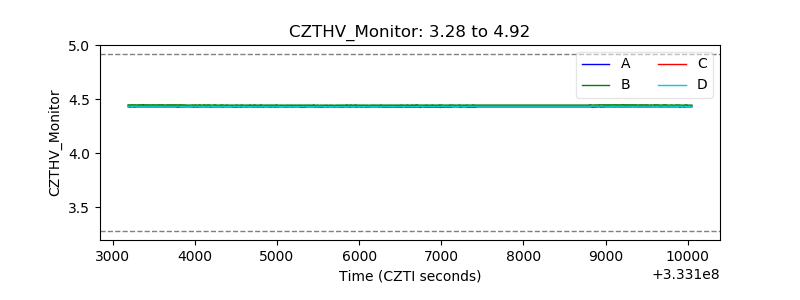 |
| D_VDD | 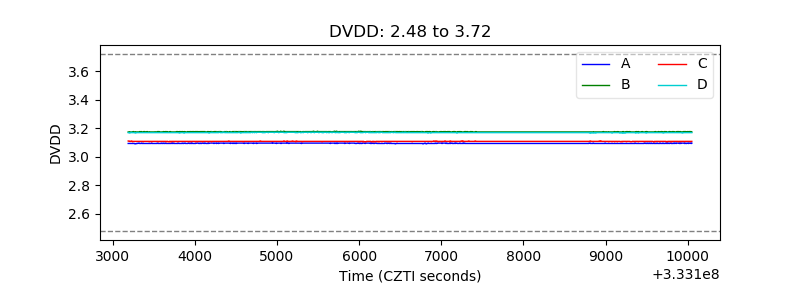 |
| Temperature 1 | 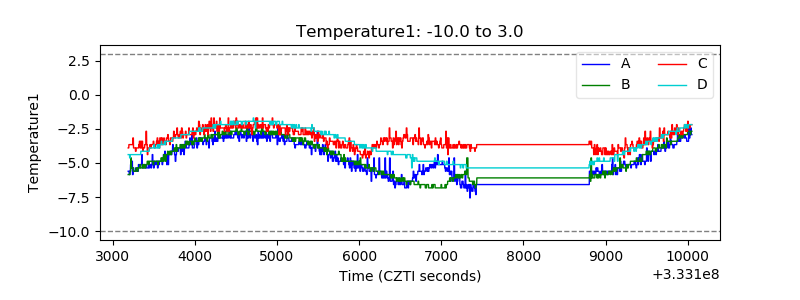 |
| Veto HV Monitor | 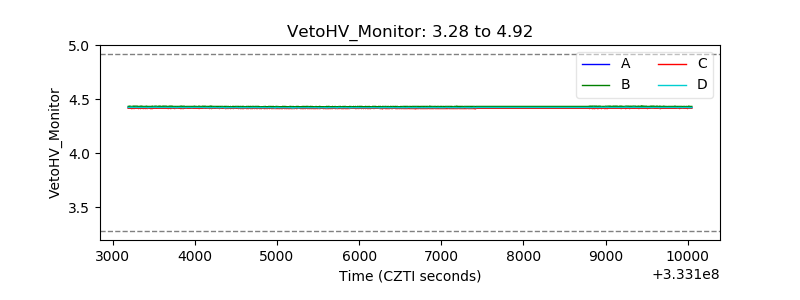 |
| Veto LLD | 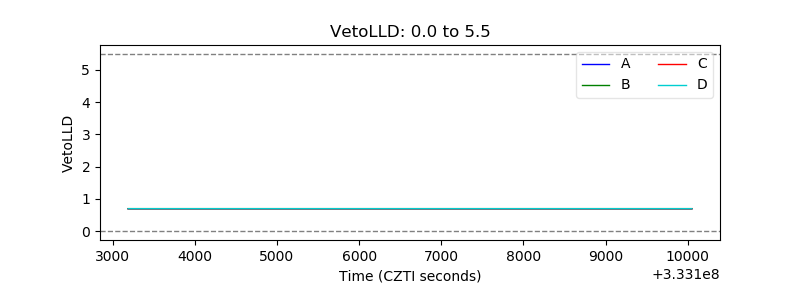 |
| Alpha Counter | 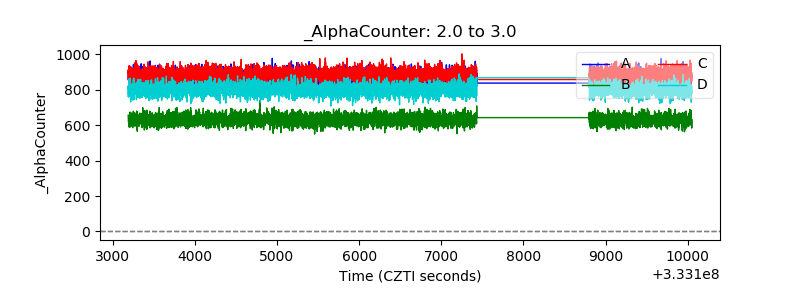 |
| _CPM_Rate | 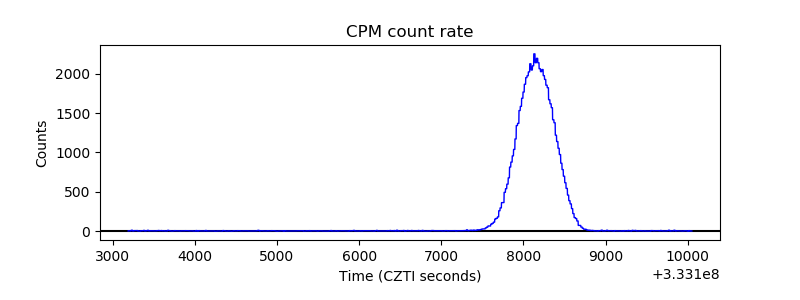 |
| CZT Counter | 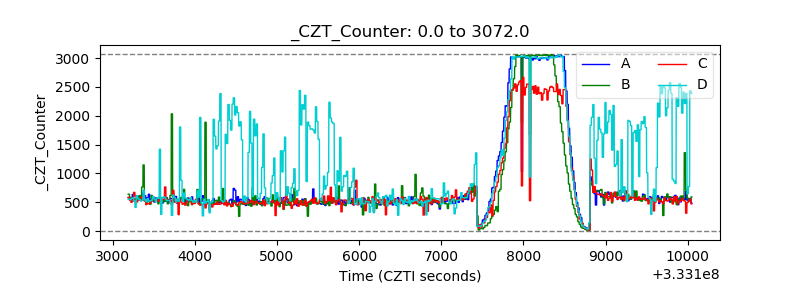 |
| +2.5 Volts monitor | 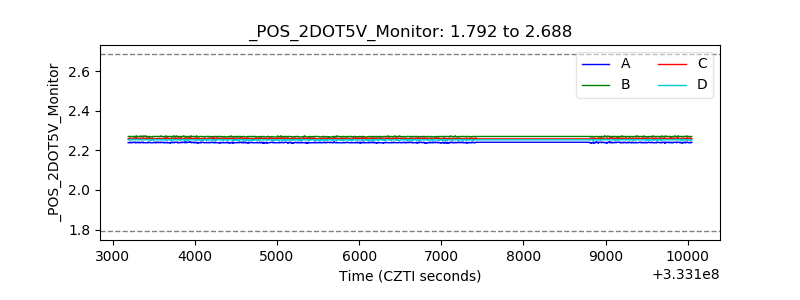 |
| +5 Volts monitor |  |
| _ROLL_ROT | 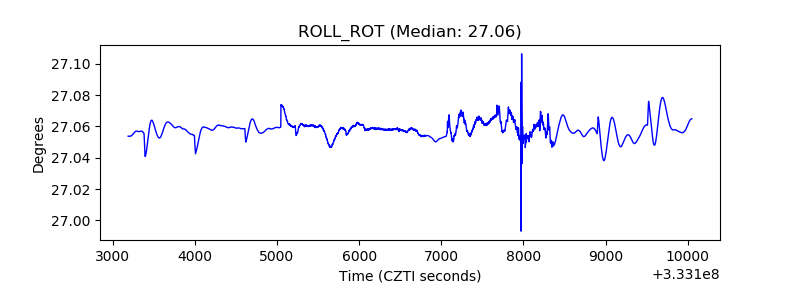 |
| _Roll_DEC |  |
| _Roll_RA | 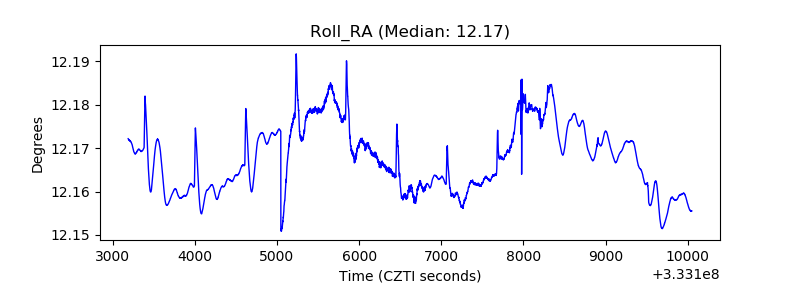 |
| Veto Counter | 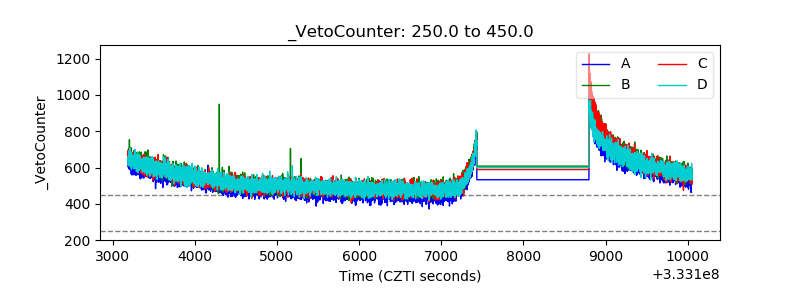 |