| Param | Original file | Final file |
|---|---|---|
| Filename | modeM0/AS1A09_033T02_9000003762_26041cztM0_level2.evt | modeM0/AS1A09_033T02_9000003762_26041cztM0_level2_quad_clean.evt |
| Size (bytes) | 1,605,723,840 | 264,136,320 |
| Size | 1.5 GB | 251.9 MB |
| Events in quadrant A | 10,861,784 | 1,695,838 |
| Events in quadrant B | 11,121,723 | 1,709,958 |
| Events in quadrant C | 10,716,958 | 1,602,478 |
| Events in quadrant D | 14,569,758 | 1,603,644 |
| Mode M9 | |||
|---|---|---|---|
| Quadrant | BADHDUFLAG | Total packets | Discarded packets |
| A | 0 | 53 | 0 |
| B | 0 | 53 | 0 |
| C | 0 | 53 | 0 |
| D | 0 | 53 | 0 |
| Mode M0 | |||
|---|---|---|---|
| Quadrant | BADHDUFLAG | Total packets | Discarded packets |
| A | 0 | 43709 | 0 |
| B | 0 | 44644 | 0 |
| C | 0 | 43362 | 0 |
| D | 0 | 55887 | 0 |
| Quadrant | Total seconds | Saturated seconds | Saturation percentage |
|---|---|---|---|
| A | 20157 | 281 | 1.394057% |
| B | 20157 | 389 | 1.929851% |
| C | 20155 | 349 | 1.731580% |
| D | 20157 | 1067 | 5.293446% |
Noise dominated data is calculated using 1-second bins in cleaned event files. If a bin has >2000 counts, and if more than 50% of those come from <1% of pixels, then it is considered to be noise-dominated and hence unusable.
| Quadrant | # 1 sec bins | Bins with >0 counts | Bins with >2000 counts | High rate bins dominated by noise | Noise dominated (total time) | Noise dominated (detector-on time) | Marked lightcurve |
|---|---|---|---|---|---|---|---|
| A | 25362 | 20157 | 21 | 21 | 0.08% | 0.10% | 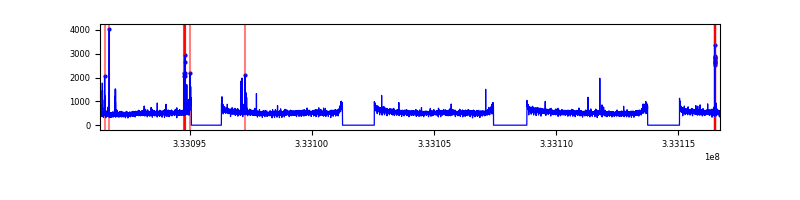 |
| B | 25362 | 20157 | 58 | 58 | 0.23% | 0.29% | 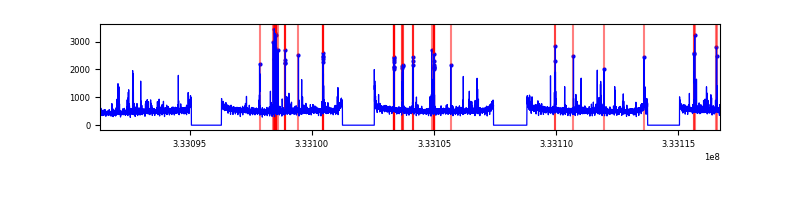 |
| C | 25361 | 20158 | 2 | 2 | 0.01% | 0.01% | 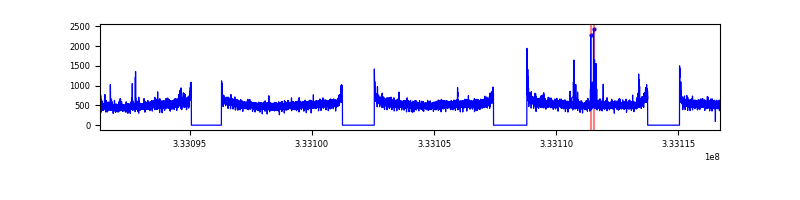 |
| D | 25362 | 20158 | 954 | 954 | 3.76% | 4.73% | 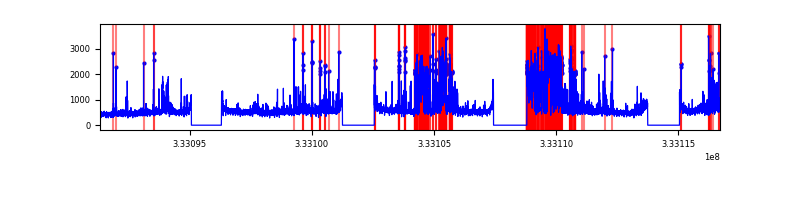 |
Top three noisy pixels from each quadrant. If the there are fewer than three noisy pixels in the level2.evt file, extra rows are filled as -1
| Pixel properties | Quadrant properties | ||||||
|---|---|---|---|---|---|---|---|
| Quadrant | DetID | PixID | Counts | Sigma | Mean | Median | Sigma |
| A | 0 | 13 | 184074 | 334.26 | 2771 | 2726 | 542.5 |
| A | 13 | 254 | 28023 | 46.63 | 2771 | 2726 | 542.5 |
| A | 3 | 137 | 24191 | 39.56 | 2771 | 2726 | 542.5 |
| B | 10 | 245 | 364494 | 720.94 | 2699 | 2642 | 501.9 |
| B | 0 | 230 | 70574 | 135.34 | 2699 | 2642 | 501.9 |
| B | 0 | 229 | 66786 | 127.8 | 2699 | 2642 | 501.9 |
| C | 14 | 238 | 426900 | 713.14 | 2591 | 2610 | 595.0 |
| C | 3 | 233 | 181100 | 300.0 | 2591 | 2610 | 595.0 |
| C | 13 | 61 | 17753 | 25.45 | 2591 | 2610 | 595.0 |
| D | 1 | 52 | 4276832 | 6699.53 | 2639 | 2580 | 638.0 |
| D | 7 | 223 | 153319 | 236.27 | 2639 | 2580 | 638.0 |
| D | 13 | 238 | 78033 | 118.27 | 2639 | 2580 | 638.0 |
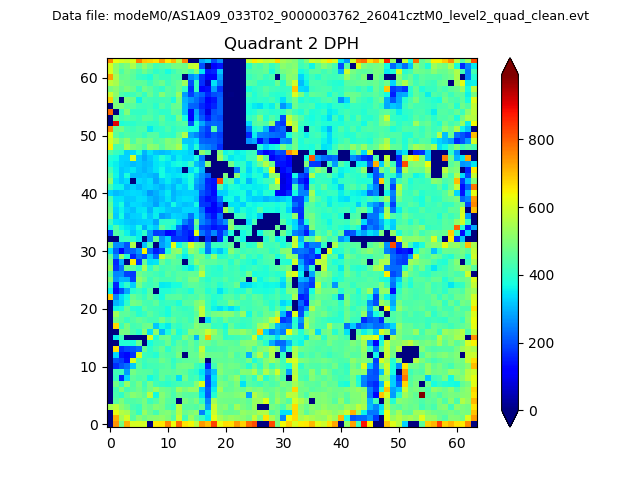
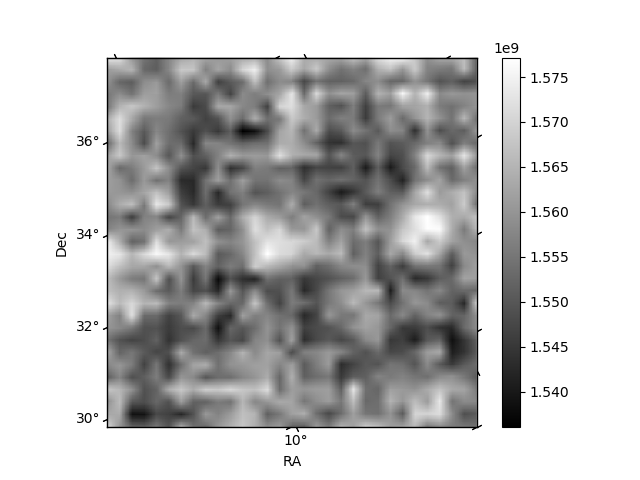
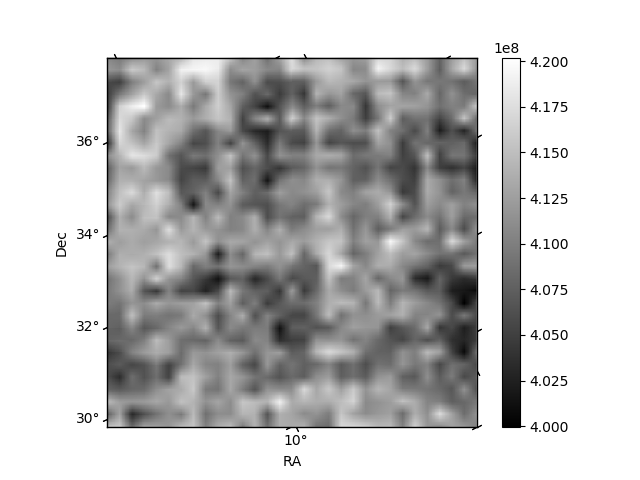
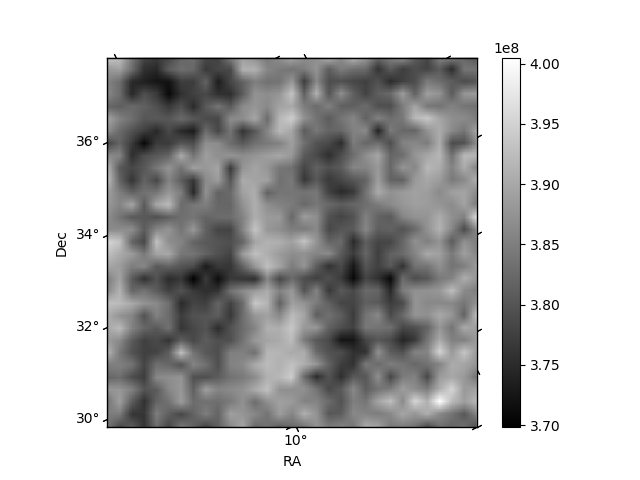
Histogram calculated using DETX and DETY for each event in the final _common_clean file
| Quadrant A | 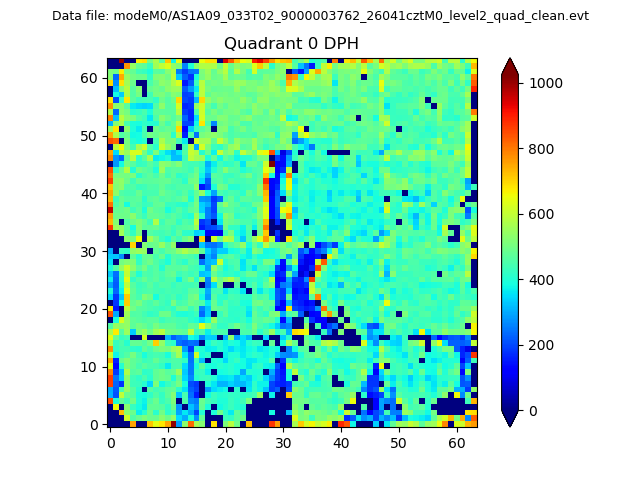 |
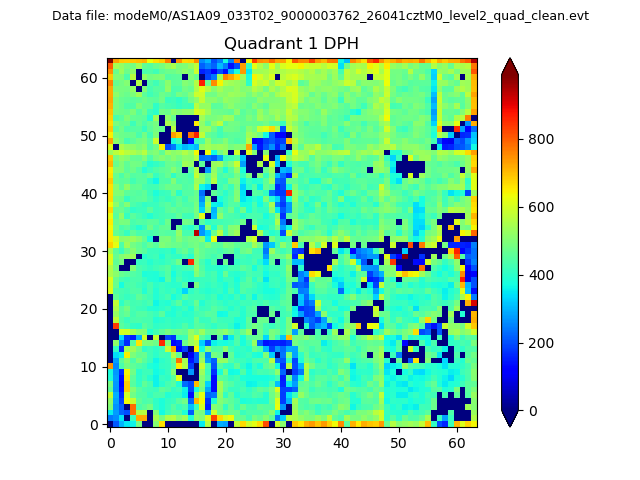 |
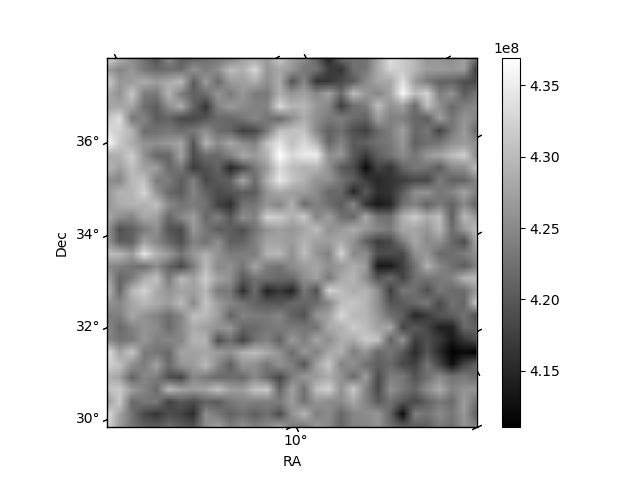
Quadrant B |
|---|---|---|---|
| Quadrant D | 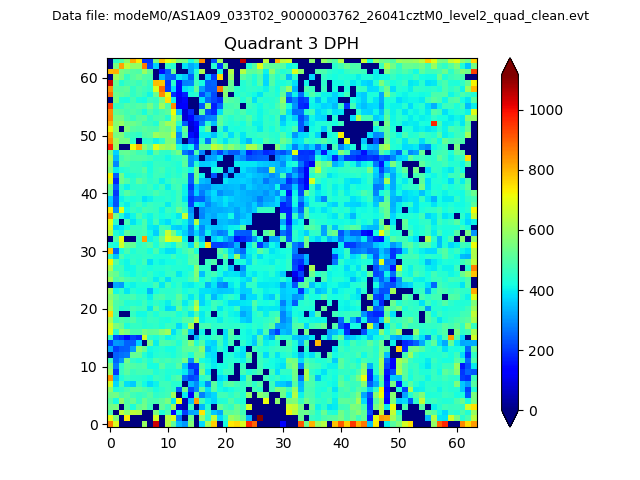 |
 |
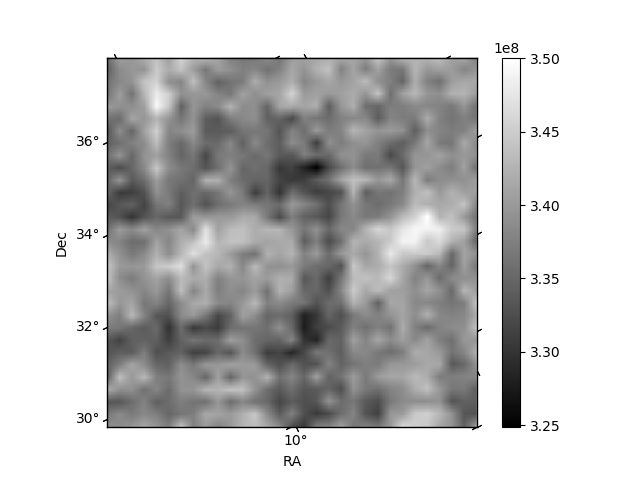
Quadrant C |
| Plot type | Count rate plots | Images |
|---|---|---|
| Comparison with Poisson distribution Blue bars denote a histogram of data divided into 1 sec bins. Red curve is a Poisson curve with rate = median count rate of data. |
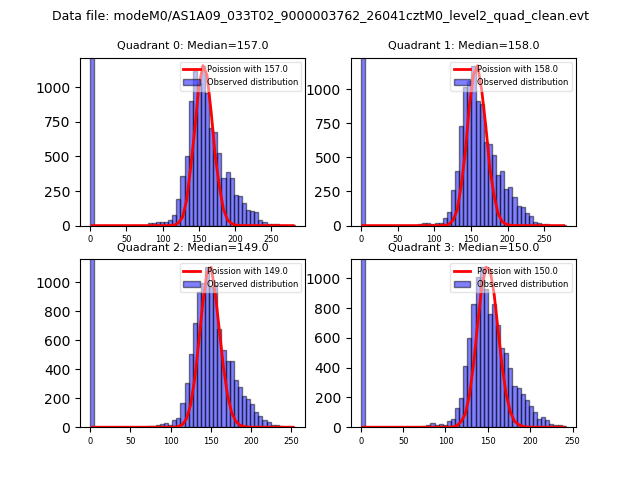 |
 |
| Quadrant-wise count rates Data is divided into 100 sec bins |
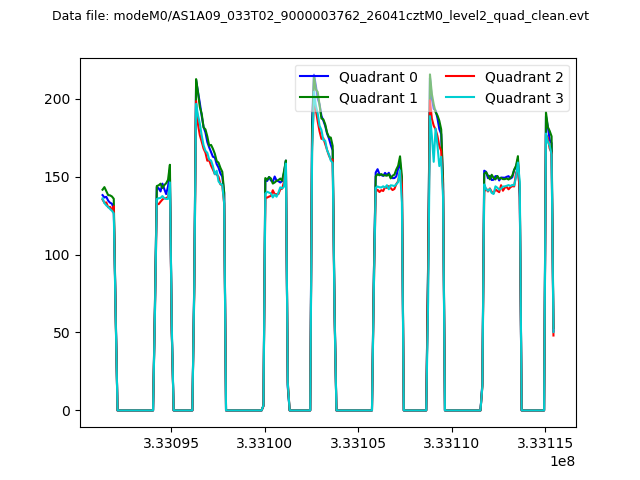 |
|
| Module-wise count rates for Quadrant A Data is divided into 100 sec bins |
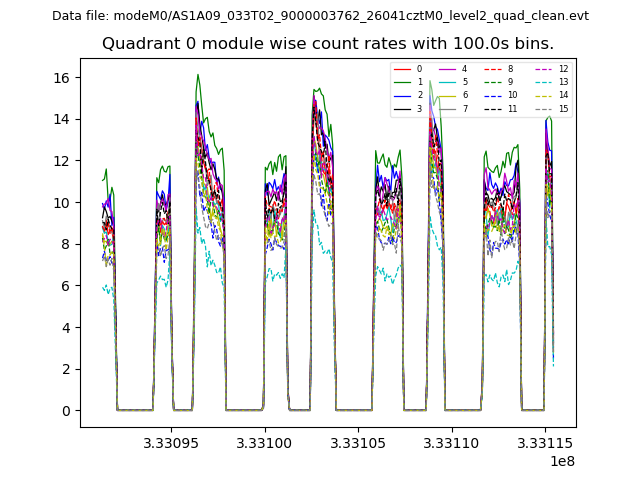 |
 |
| Module-wise count rates for Quadrant B Data is divided into 100 sec bins |
 |
 |
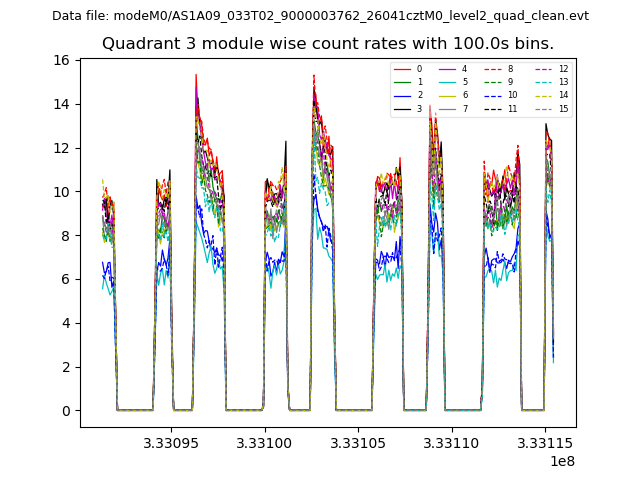
| Module-wise count rates for Quadrant C Data is divided into 100 sec bins |
 |
 |
| Module-wise count rates for Quadrant D Data is divided into 100 sec bins |
 |
 |
| Parameter | Plot |
|---|---|
| CZT HV Monitor |  |
| D_VDD | 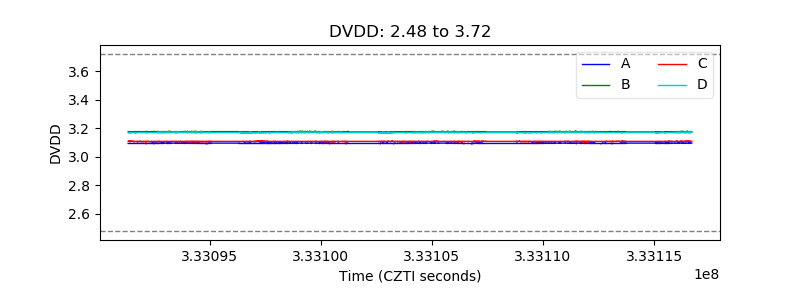 |
| Temperature 1 | 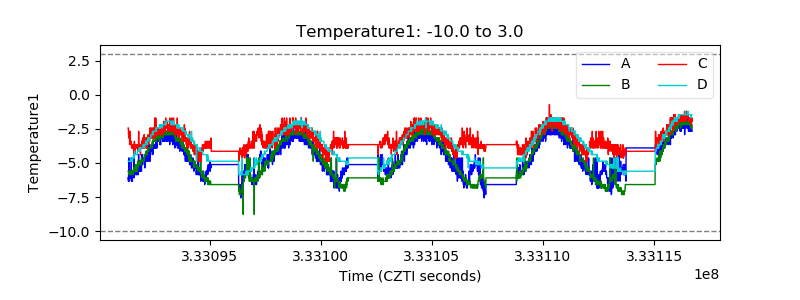 |
| Veto HV Monitor |  |
| Veto LLD | 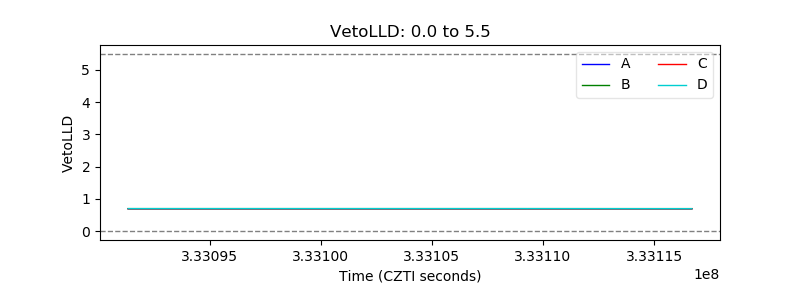 |
| Alpha Counter | 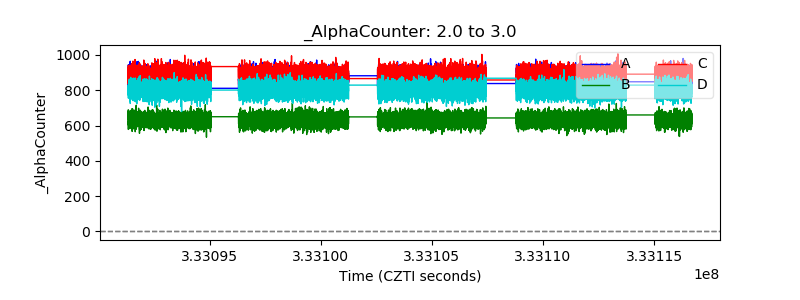 |
| _CPM_Rate | 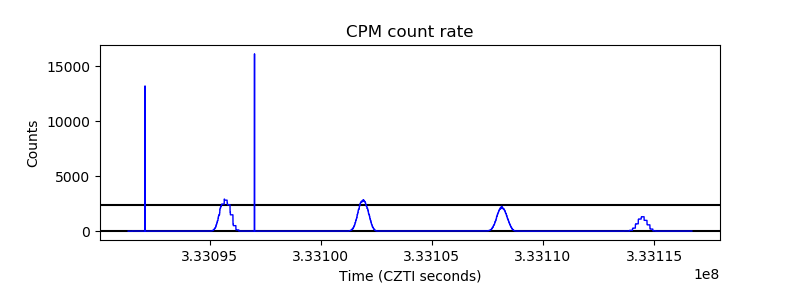 |
| CZT Counter | 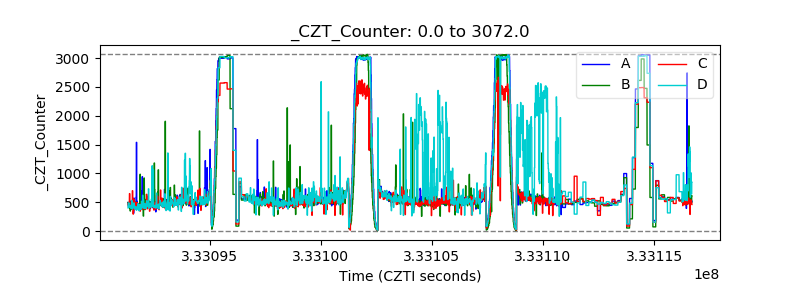 |
| +2.5 Volts monitor | 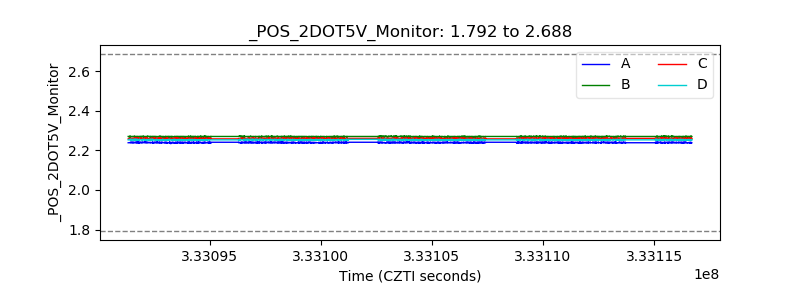 |
| +5 Volts monitor |  |
| _ROLL_ROT |  |
| _Roll_DEC | 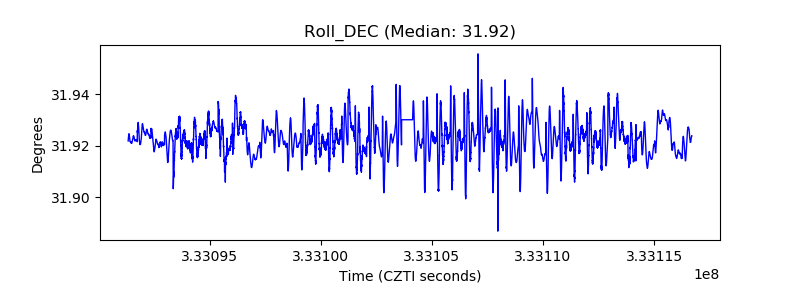 |
| _Roll_RA | 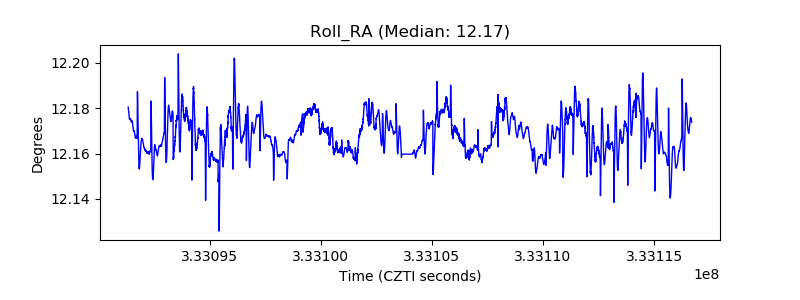 |
| Veto Counter |  |