| Param | Original file | Final file |
|---|---|---|
| Filename | modeM0/AS1A09_033T02_9000003762_26042cztM0_level2.evt | modeM0/AS1A09_033T02_9000003762_26042cztM0_level2_quad_clean.evt |
| Size (bytes) | 532,149,120 | 75,332,160 |
| Size | 507.5 MB | 71.8 MB |
| Events in quadrant A | 3,807,174 | 462,292 |
| Events in quadrant B | 3,869,401 | 464,164 |
| Events in quadrant C | 3,512,011 | 440,987 |
| Events in quadrant D | 4,472,833 | 445,998 |
| Mode M9 | |||
|---|---|---|---|
| Quadrant | BADHDUFLAG | Total packets | Discarded packets |
| A | 0 | 14 | 0 |
| B | 0 | 15 | 0 |
| C | 0 | 15 | 0 |
| D | 0 | 15 | 0 |
| Mode M0 | |||
|---|---|---|---|
| Quadrant | BADHDUFLAG | Total packets | Discarded packets |
| A | 0 | 15178 | 0 |
| B | 0 | 15383 | 0 |
| C | 0 | 14189 | 0 |
| D | 0 | 17512 | 0 |
| Quadrant | Total seconds | Saturated seconds | Saturation percentage |
|---|---|---|---|
| A | 6700 | 181 | 2.701493% |
| B | 6700 | 192 | 2.865672% |
| C | 6700 | 160 | 2.388060% |
| D | 6700 | 194 | 2.895522% |
Noise dominated data is calculated using 1-second bins in cleaned event files. If a bin has >2000 counts, and if more than 50% of those come from <1% of pixels, then it is considered to be noise-dominated and hence unusable.
| Quadrant | # 1 sec bins | Bins with >0 counts | Bins with >2000 counts | High rate bins dominated by noise | Noise dominated (total time) | Noise dominated (detector-on time) | Marked lightcurve |
|---|---|---|---|---|---|---|---|
| A | 7780 | 6700 | 50 | 50 | 0.64% | 0.75% | 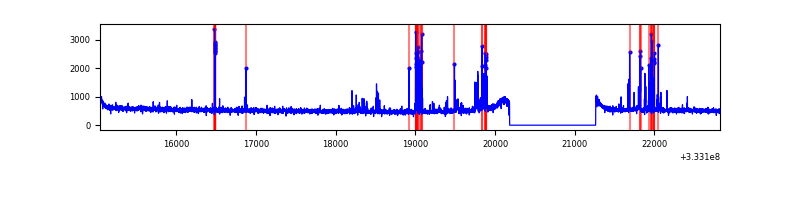 |
| B | 7780 | 6700 | 46 | 46 | 0.59% | 0.69% | 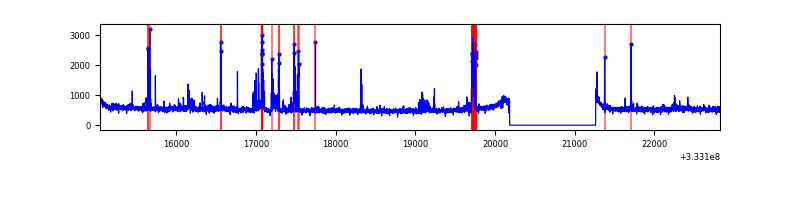 |
| C | 7780 | 6700 | 0 | 0 | 0.00% | 0.00% | 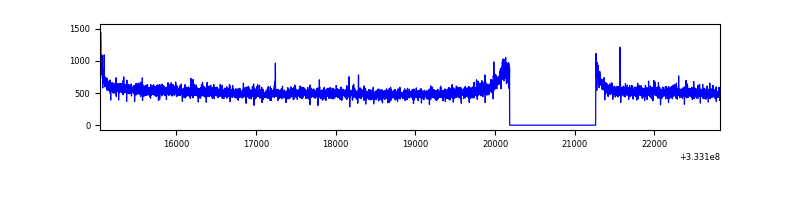 |
| D | 7780 | 6700 | 115 | 115 | 1.48% | 1.72% | 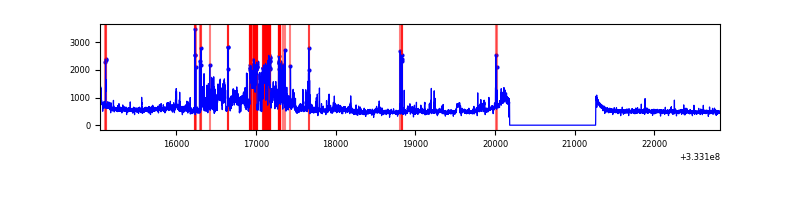 |
Top three noisy pixels from each quadrant. If the there are fewer than three noisy pixels in the level2.evt file, extra rows are filled as -1
| Pixel properties | Quadrant properties | ||||||
|---|---|---|---|---|---|---|---|
| Quadrant | DetID | PixID | Counts | Sigma | Mean | Median | Sigma |
| A | 0 | 13 | 295022 | 1620.54 | 911 | 894 | 181.5 |
| A | 13 | 254 | 9549 | 47.69 | 911 | 894 | 181.5 |
| A | 3 | 137 | 8079 | 39.59 | 911 | 894 | 181.5 |
| B | 10 | 245 | 295814 | 1740.97 | 889 | 866 | 169.4 |
| B | 0 | 190 | 37332 | 215.25 | 889 | 866 | 169.4 |
| B | 0 | 229 | 27347 | 156.31 | 889 | 866 | 169.4 |
| C | 14 | 238 | 140910 | 704.92 | 858 | 866 | 198.7 |
| C | 3 | 233 | 24393 | 118.42 | 858 | 866 | 198.7 |
| C | 13 | 61 | 5861 | 25.14 | 858 | 866 | 198.7 |
| D | 1 | 52 | 1064769 | 4979.67 | 880 | 859 | 213.7 |
| D | 7 | 223 | 47614 | 218.84 | 880 | 859 | 213.7 |
| D | 2 | 234 | 23315 | 105.11 | 880 | 859 | 213.7 |
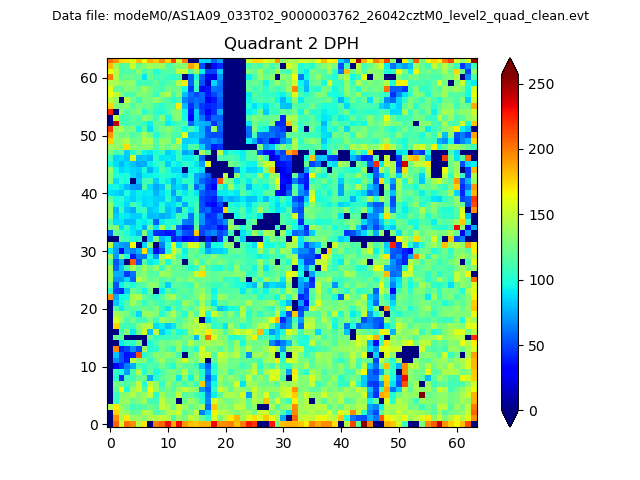
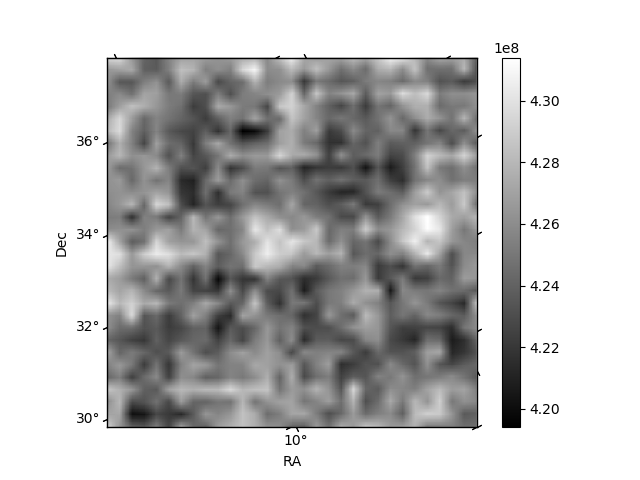
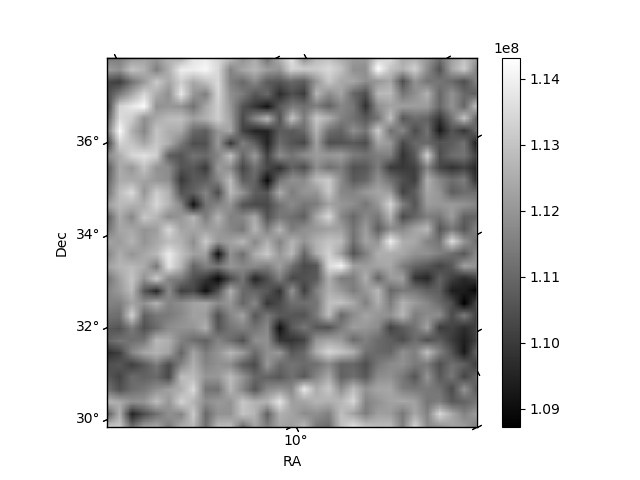
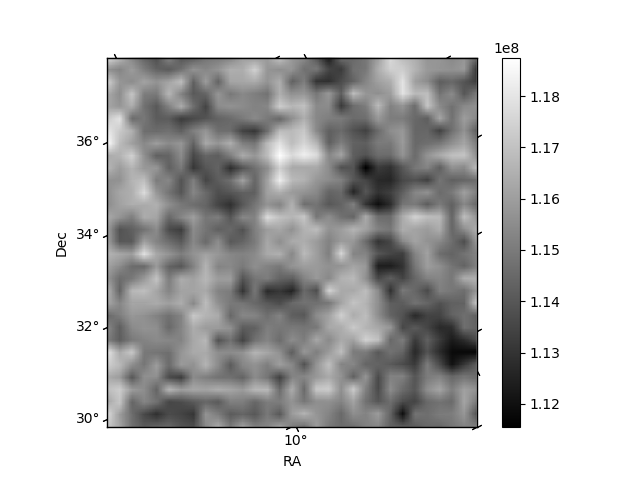
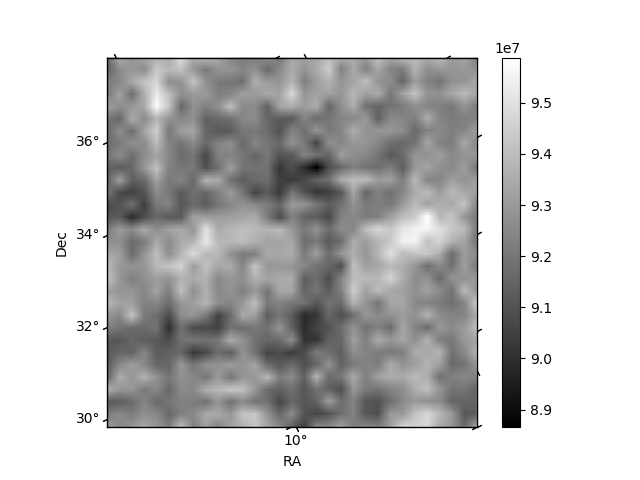
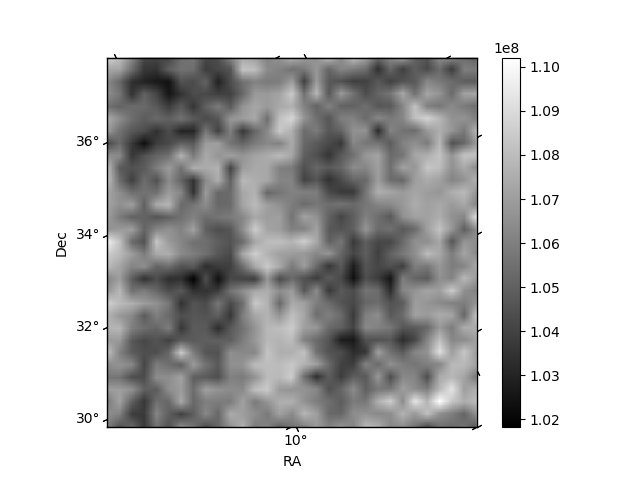
Histogram calculated using DETX and DETY for each event in the final _common_clean file
| Quadrant A | 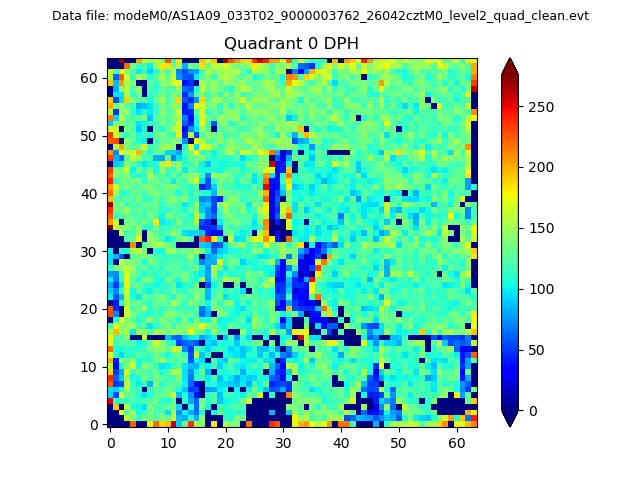 |
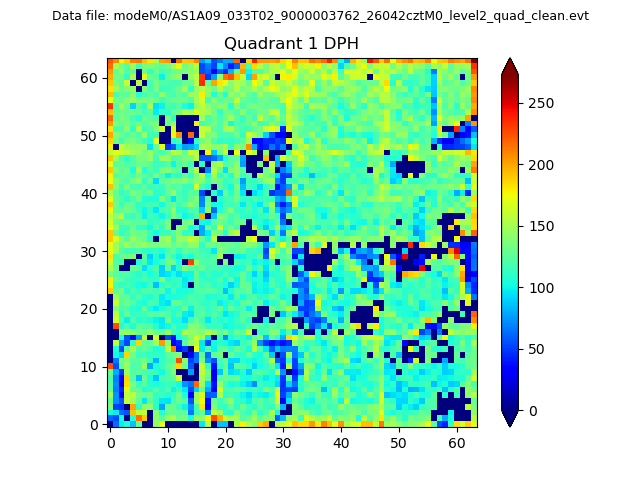 |
Quadrant B |
|---|---|---|---|
| Quadrant D | 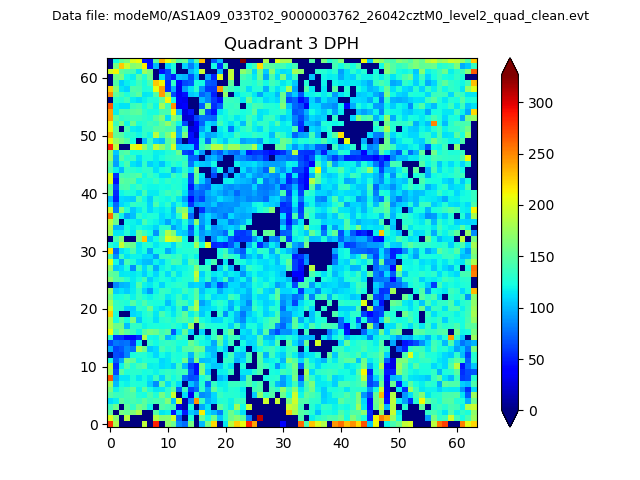 |
 |
Quadrant C |
| Plot type | Count rate plots | Images |
|---|---|---|
| Comparison with Poisson distribution Blue bars denote a histogram of data divided into 1 sec bins. Red curve is a Poisson curve with rate = median count rate of data. |
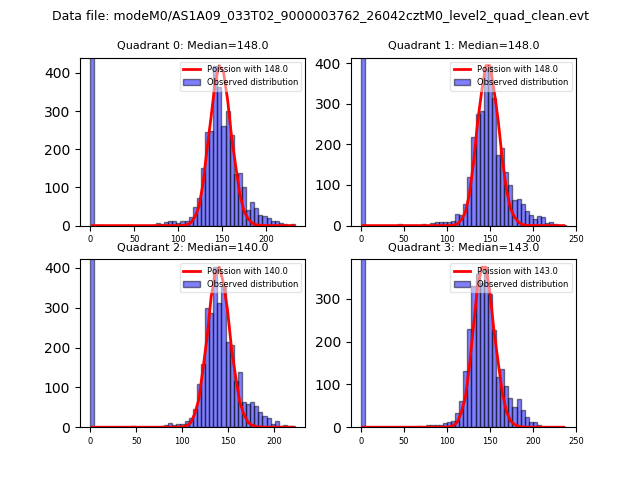 |
 |
| Quadrant-wise count rates Data is divided into 100 sec bins |
 |
|
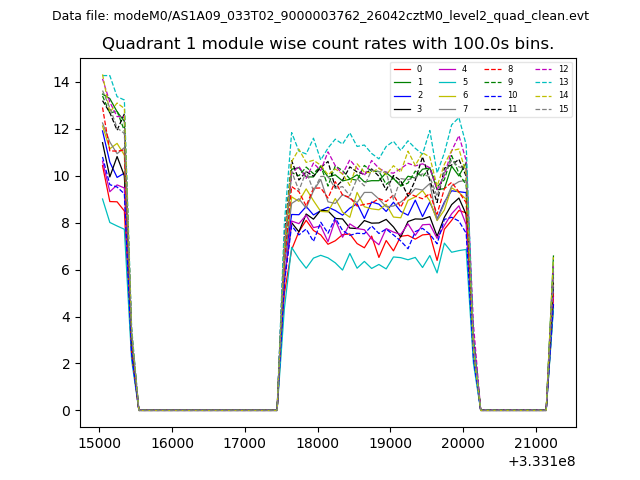
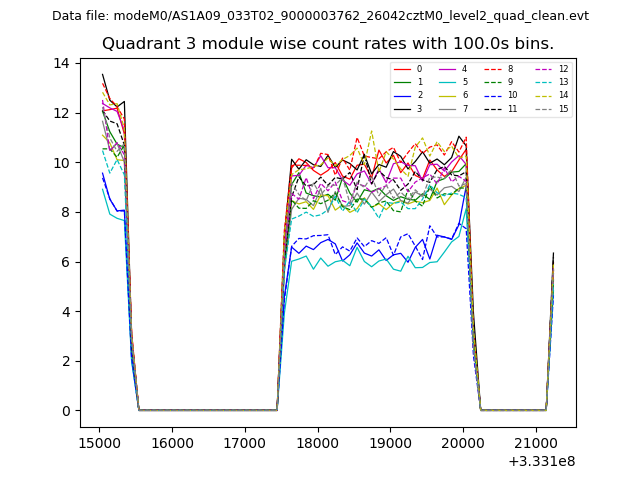
| Module-wise count rates for Quadrant A Data is divided into 100 sec bins |
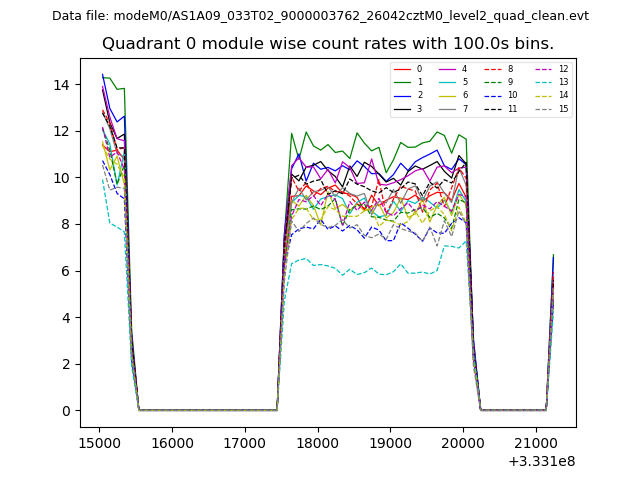 |
 |
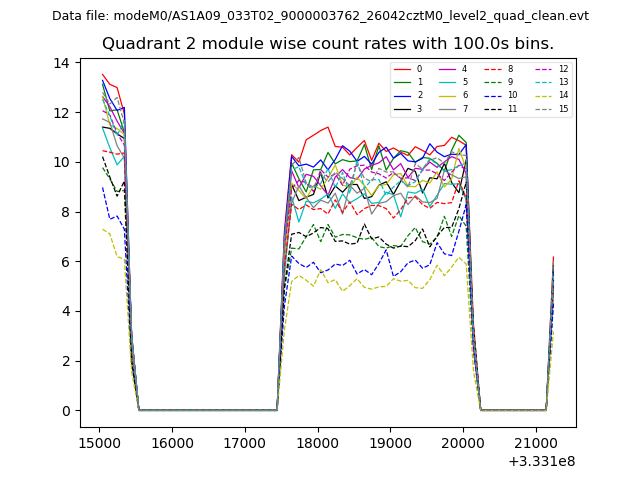
| Module-wise count rates for Quadrant B Data is divided into 100 sec bins |
 |
 |
| Module-wise count rates for Quadrant C Data is divided into 100 sec bins |
 |
 |
| Module-wise count rates for Quadrant D Data is divided into 100 sec bins |
 |
 |
| Parameter | Plot |
|---|---|
| CZT HV Monitor | 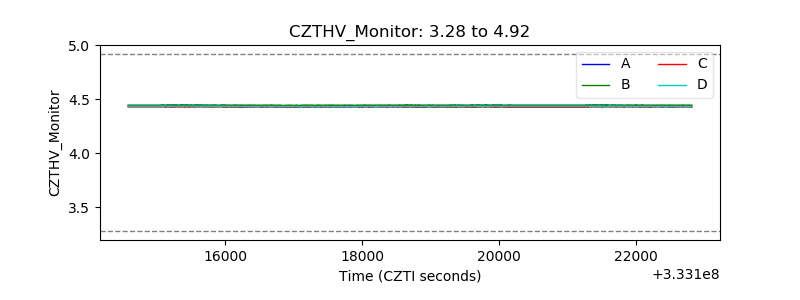 |
| D_VDD | 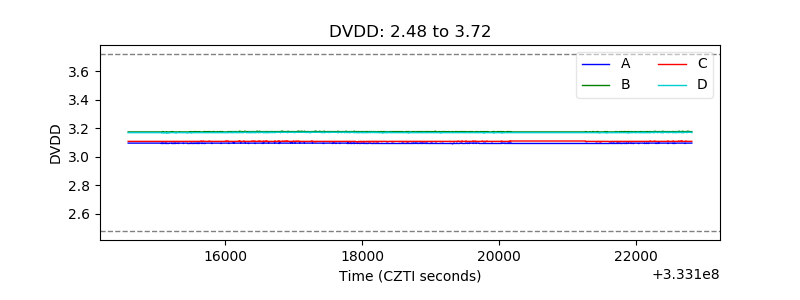 |
| Temperature 1 | 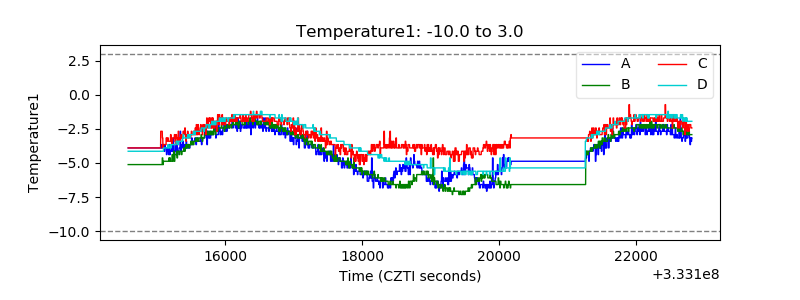 |
| Veto HV Monitor | 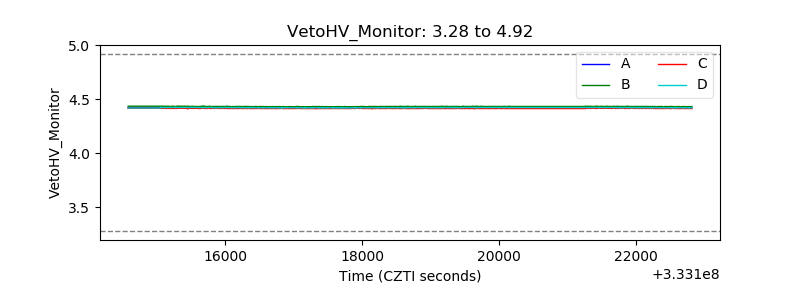 |
| Veto LLD | 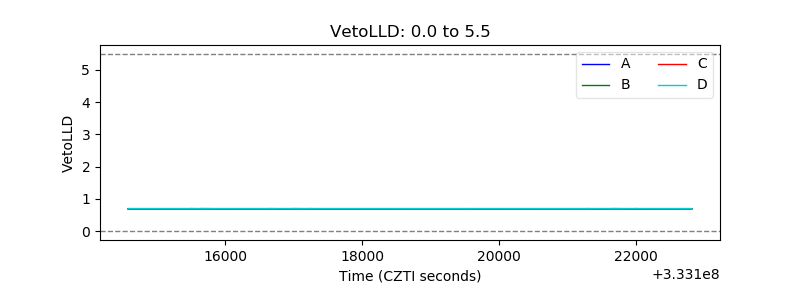 |
| Alpha Counter | 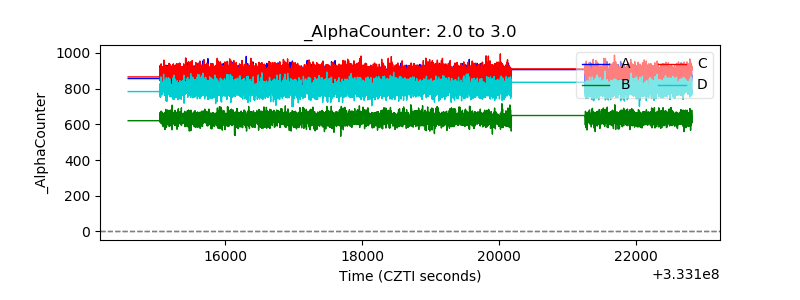 |
| _CPM_Rate | 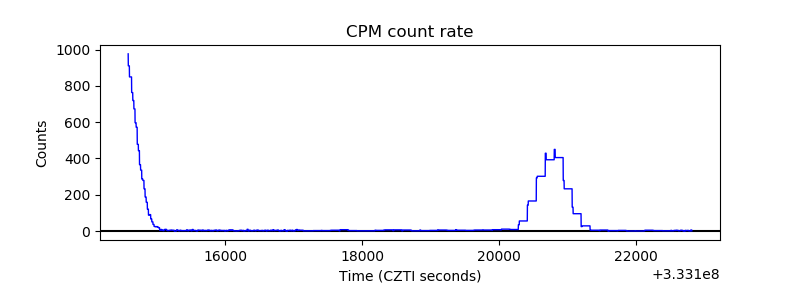 |
| CZT Counter | 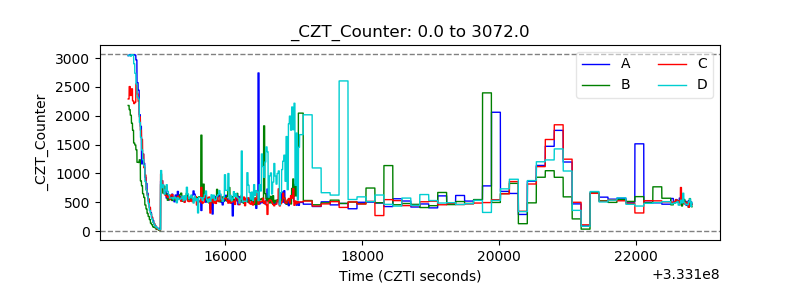 |
| +2.5 Volts monitor |  |
| +5 Volts monitor |  |
| _ROLL_ROT | 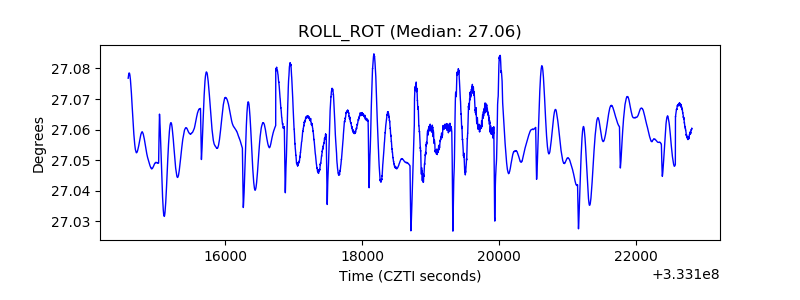 |
| _Roll_DEC | 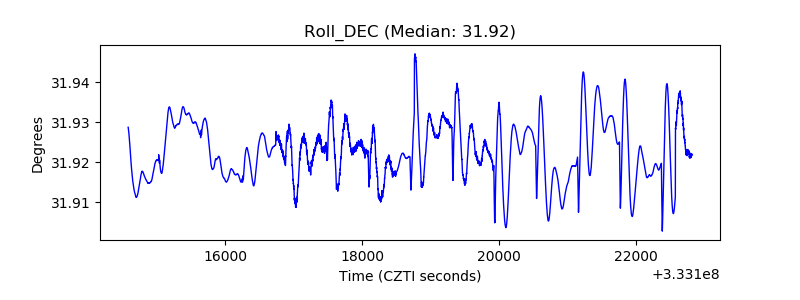 |
| _Roll_RA | 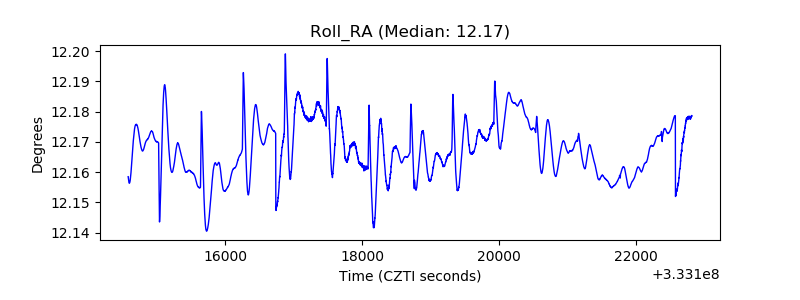 |
| Veto Counter | 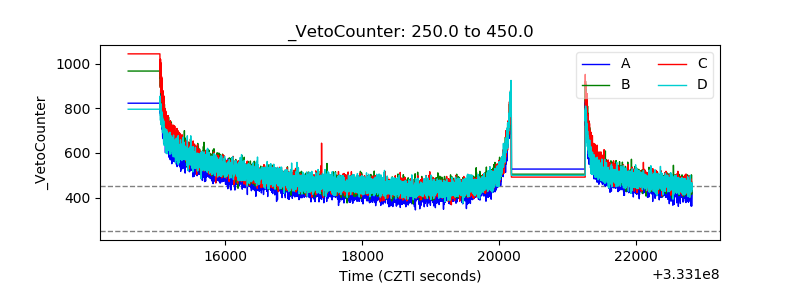 |