| Param | Original file | Final file |
|---|---|---|
| Filename | modeM0/AS1A09_033T02_9000003762_26043cztM0_level2.evt | modeM0/AS1A09_033T02_9000003762_26043cztM0_level2_quad_clean.evt |
| Size (bytes) | 502,110,720 | 75,329,280 |
| Size | 478.9 MB | 71.8 MB |
| Events in quadrant A | 3,530,969 | 459,101 |
| Events in quadrant B | 3,645,794 | 459,880 |
| Events in quadrant C | 3,454,304 | 438,908 |
| Events in quadrant D | 4,105,470 | 440,975 |
| Mode M9 | |||
|---|---|---|---|
| Quadrant | BADHDUFLAG | Total packets | Discarded packets |
| A | 0 | 7 | 0 |
| B | 0 | 7 | 0 |
| C | 0 | 7 | 0 |
| D | 0 | 7 | 0 |
| Mode M0 | |||
|---|---|---|---|
| Quadrant | BADHDUFLAG | Total packets | Discarded packets |
| A | 0 | 14613 | 0 |
| B | 0 | 14960 | 0 |
| C | 0 | 14324 | 0 |
| D | 0 | 16651 | 0 |
| Quadrant | Total seconds | Saturated seconds | Saturation percentage |
|---|---|---|---|
| A | 6919 | 114 | 1.647637% |
| B | 6920 | 154 | 2.225434% |
| C | 6920 | 129 | 1.864162% |
| D | 6920 | 211 | 3.049133% |
Noise dominated data is calculated using 1-second bins in cleaned event files. If a bin has >2000 counts, and if more than 50% of those come from <1% of pixels, then it is considered to be noise-dominated and hence unusable.
| Quadrant | # 1 sec bins | Bins with >0 counts | Bins with >2000 counts | High rate bins dominated by noise | Noise dominated (total time) | Noise dominated (detector-on time) | Marked lightcurve |
|---|---|---|---|---|---|---|---|
| A | 7664 | 6920 | 14 | 14 | 0.18% | 0.20% | 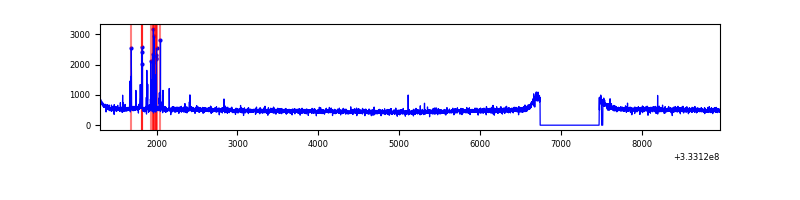 |
| B | 7665 | 6921 | 36 | 36 | 0.47% | 0.52% | 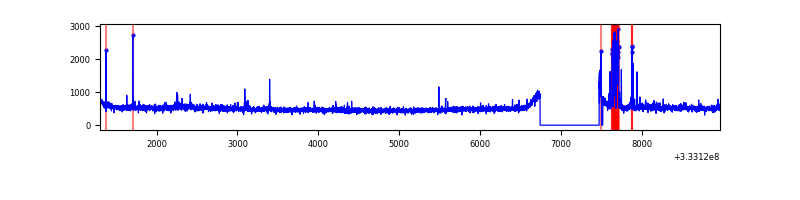 |
| C | 7665 | 6921 | 0 | 0 | 0.00% | 0.00% | 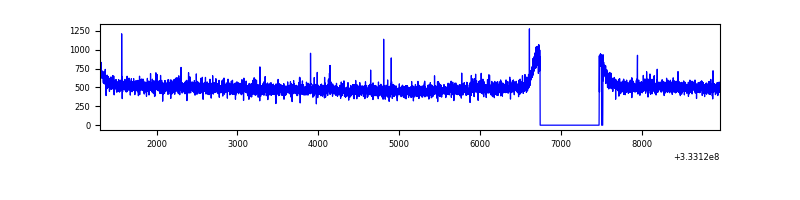 |
| D | 7665 | 6921 | 138 | 138 | 1.80% | 1.99% | 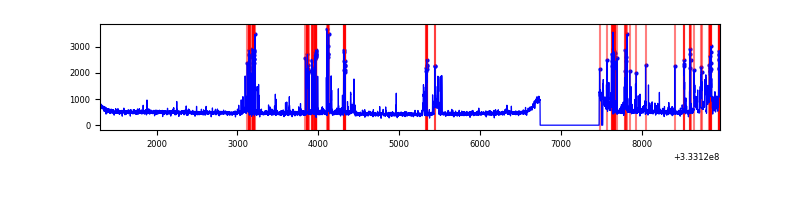 |
Top three noisy pixels from each quadrant. If the there are fewer than three noisy pixels in the level2.evt file, extra rows are filled as -1
| Pixel properties | Quadrant properties | ||||||
|---|---|---|---|---|---|---|---|
| Quadrant | DetID | PixID | Counts | Sigma | Mean | Median | Sigma |
| A | 0 | 13 | 92961 | 516.27 | 892 | 877 | 178.4 |
| A | 13 | 254 | 9527 | 48.5 | 892 | 877 | 178.4 |
| A | 3 | 137 | 8271 | 41.45 | 892 | 877 | 178.4 |
| B | 10 | 245 | 147533 | 884.25 | 873 | 853 | 165.9 |
| B | 0 | 190 | 49878 | 295.54 | 873 | 853 | 165.9 |
| B | 0 | 229 | 21447 | 124.15 | 873 | 853 | 165.9 |
| C | 14 | 238 | 137471 | 695.99 | 845 | 849 | 196.3 |
| C | 3 | 233 | 11693 | 55.24 | 845 | 849 | 196.3 |
| C | 14 | 225 | 6943 | 31.04 | 845 | 849 | 196.3 |
| D | 1 | 52 | 848092 | 3998.42 | 855 | 833 | 211.9 |
| D | 2 | 234 | 24948 | 113.8 | 855 | 833 | 211.9 |
| D | 14 | 226 | 8191 | 34.72 | 855 | 833 | 211.9 |
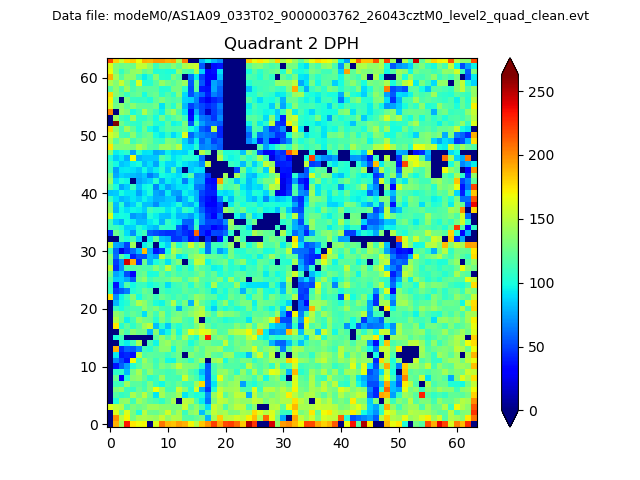
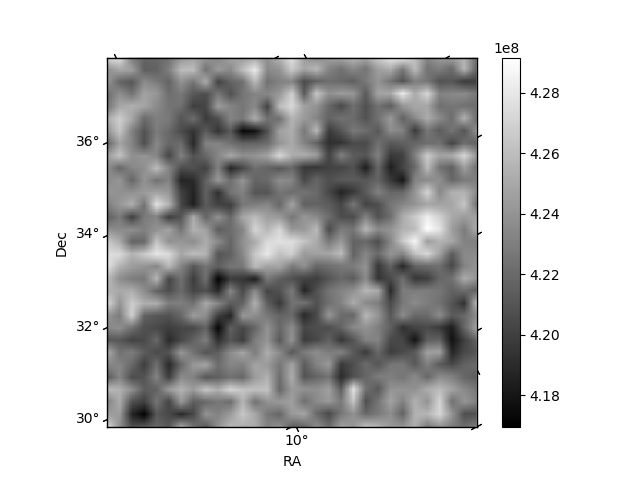
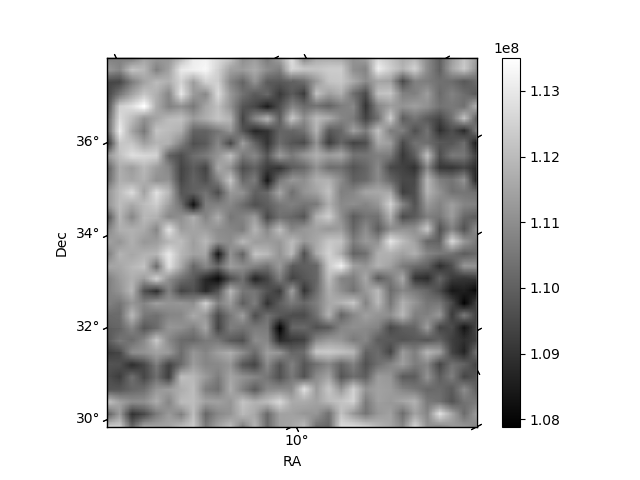
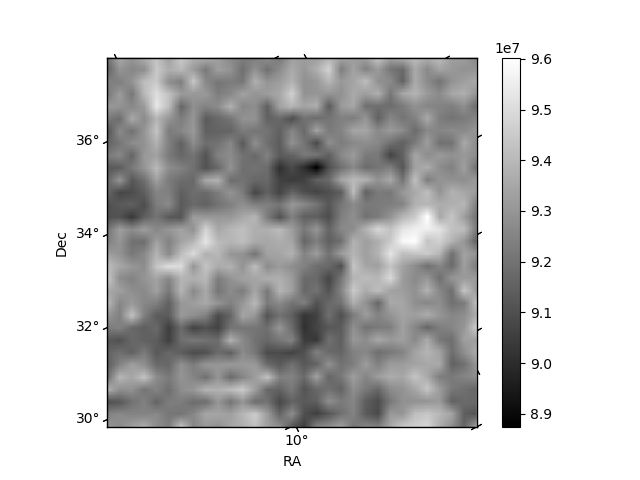
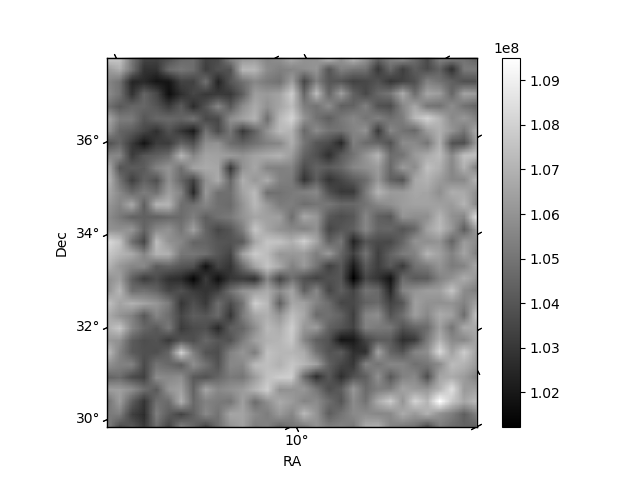
Histogram calculated using DETX and DETY for each event in the final _common_clean file
| Quadrant A | 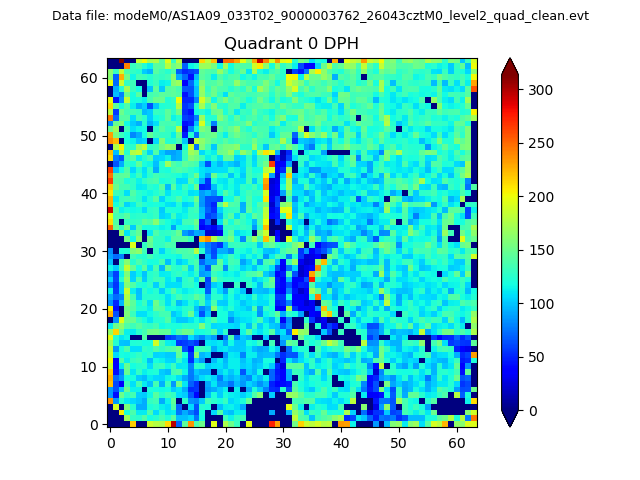 |
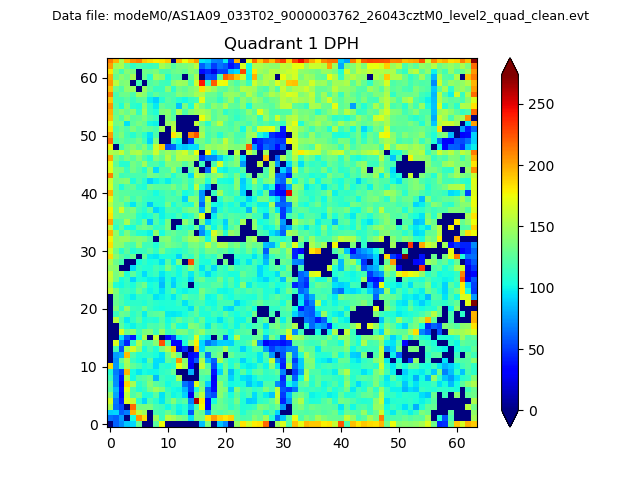 |
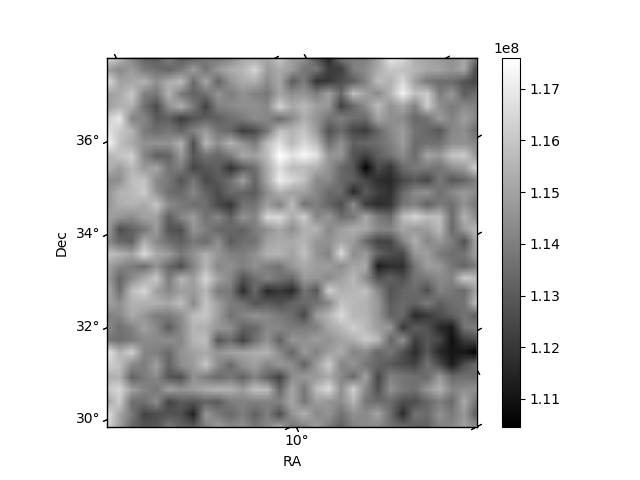
Quadrant B |
|---|---|---|---|
| Quadrant D | 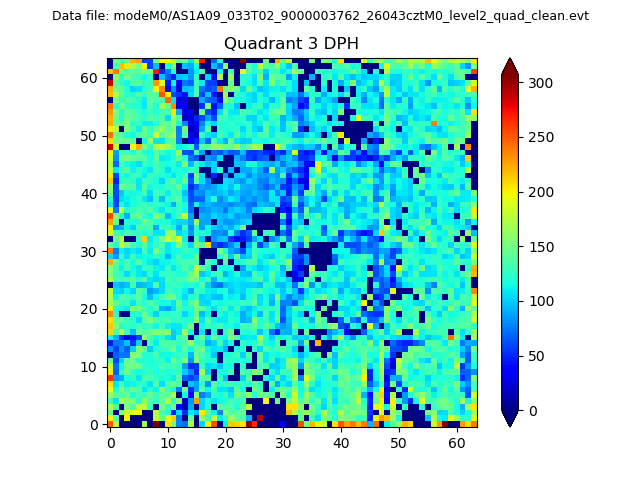 |
 |
Quadrant C |
| Plot type | Count rate plots | Images |
|---|---|---|
| Comparison with Poisson distribution Blue bars denote a histogram of data divided into 1 sec bins. Red curve is a Poisson curve with rate = median count rate of data. |
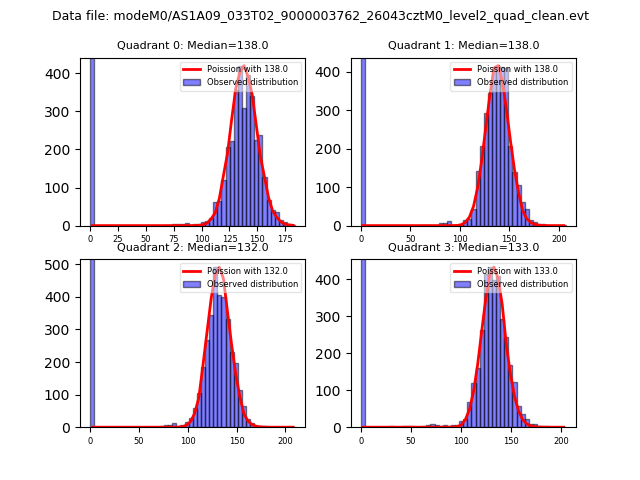 |
 |
| Quadrant-wise count rates Data is divided into 100 sec bins |
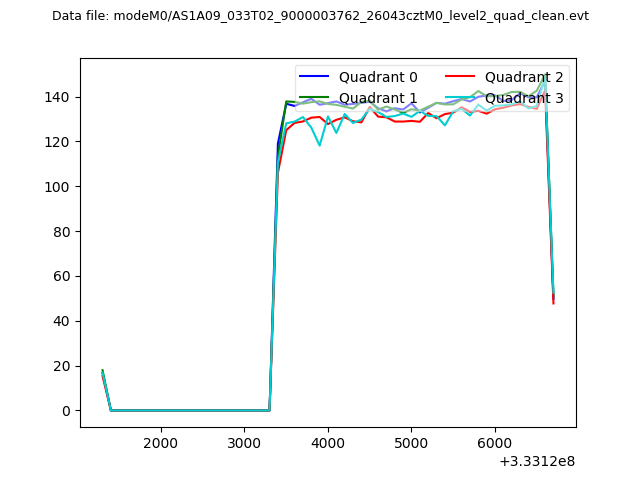 |
|
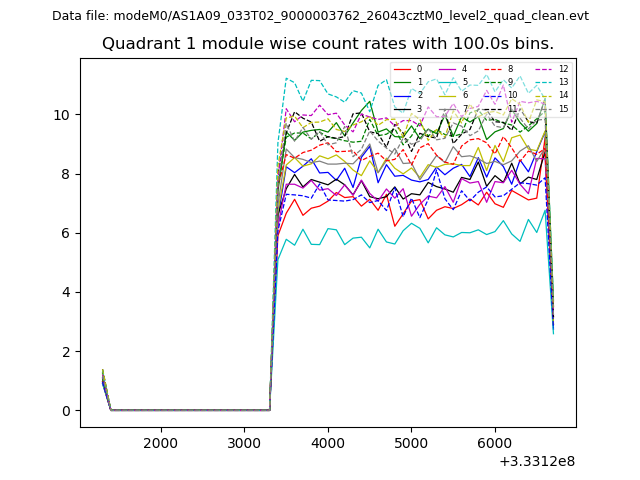
| Module-wise count rates for Quadrant A Data is divided into 100 sec bins |
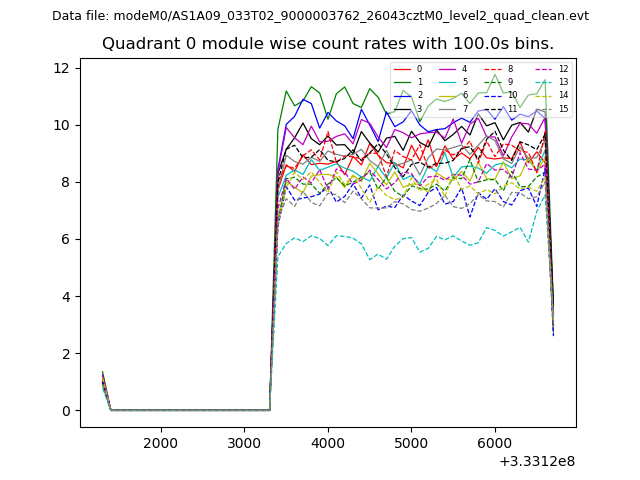 |
 |
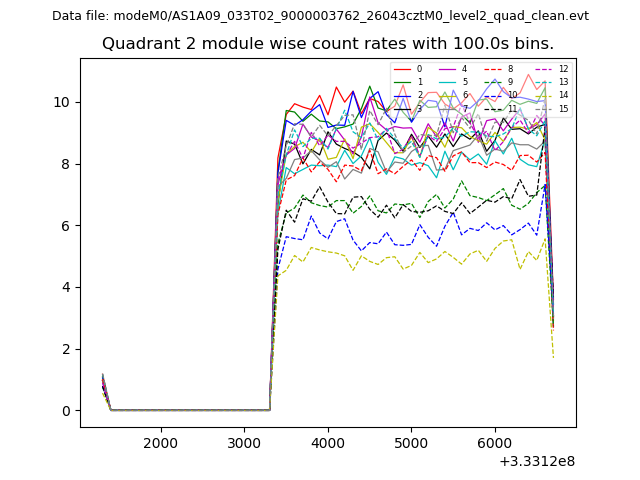
| Module-wise count rates for Quadrant B Data is divided into 100 sec bins |
 |
 |
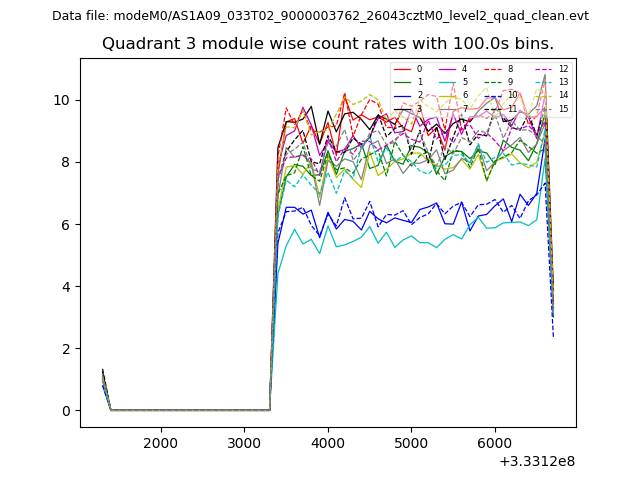
| Module-wise count rates for Quadrant C Data is divided into 100 sec bins |
 |
 |
| Module-wise count rates for Quadrant D Data is divided into 100 sec bins |
 |
 |
| Parameter | Plot |
|---|---|
| CZT HV Monitor | 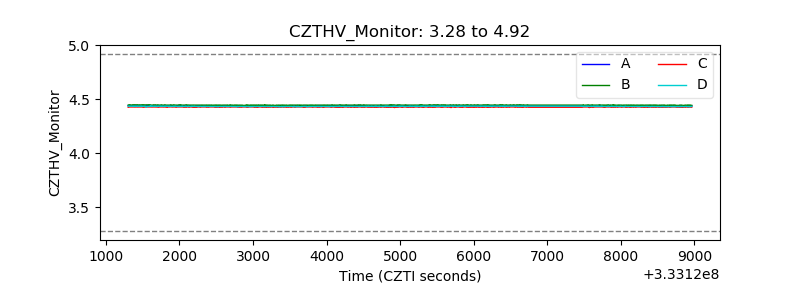 |
| D_VDD | 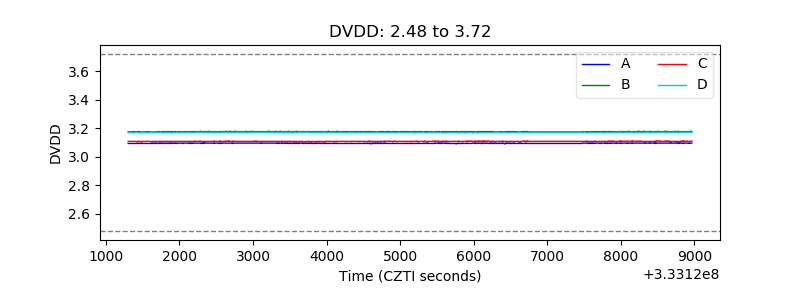 |
| Temperature 1 | 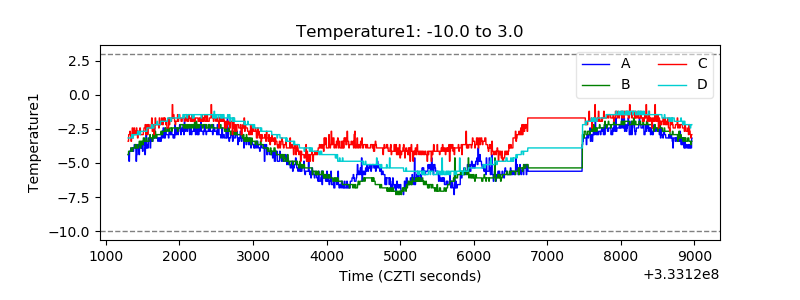 |
| Veto HV Monitor | 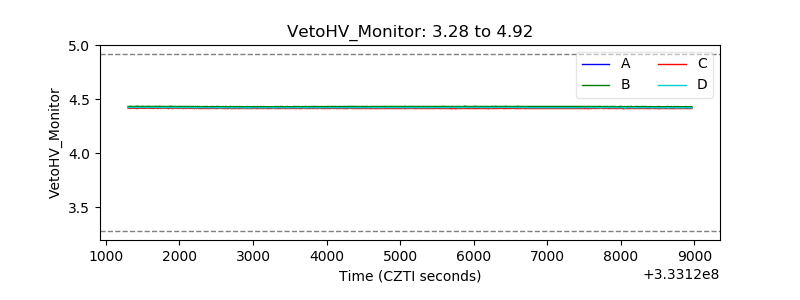 |
| Veto LLD | 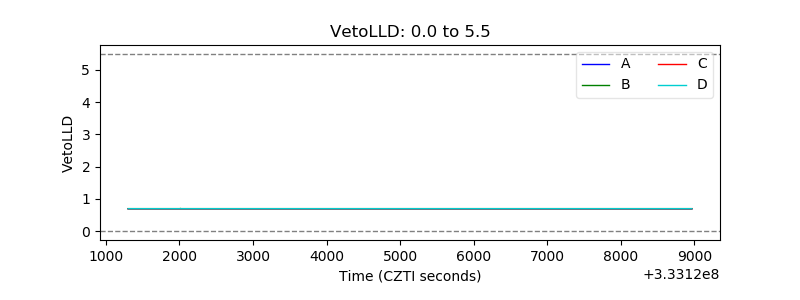 |
| Alpha Counter | 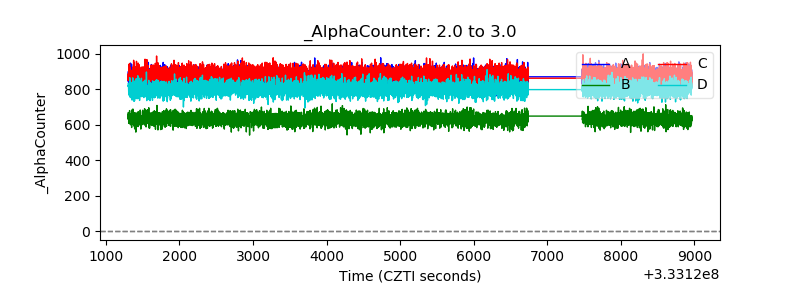 |
| _CPM_Rate | 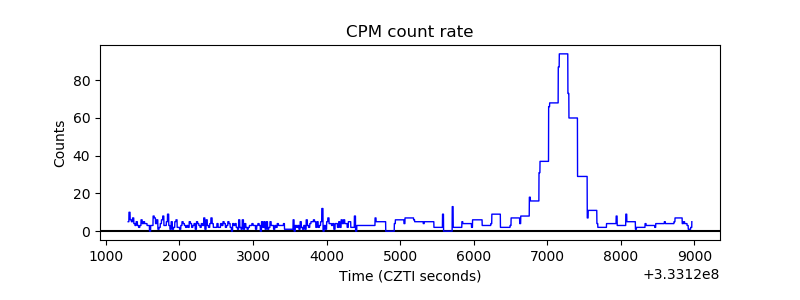 |
| CZT Counter | 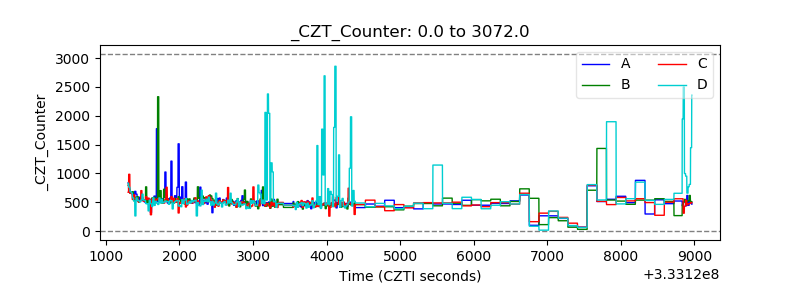 |
| +2.5 Volts monitor |  |
| +5 Volts monitor |  |
| _ROLL_ROT | 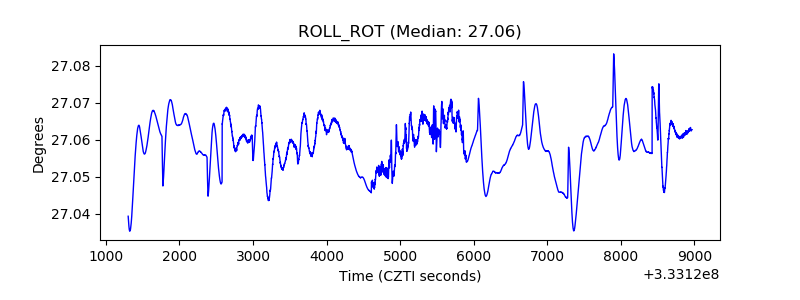 |
| _Roll_DEC |  |
| _Roll_RA | 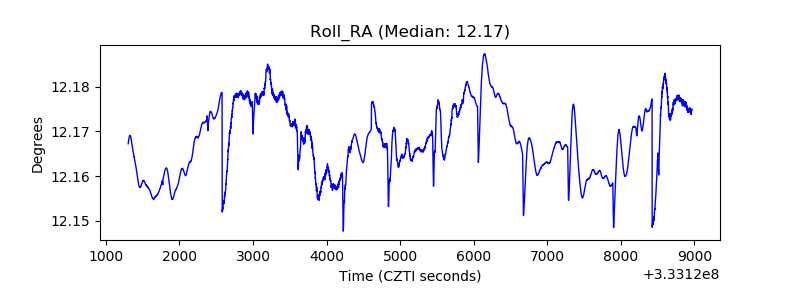 |
| Veto Counter | 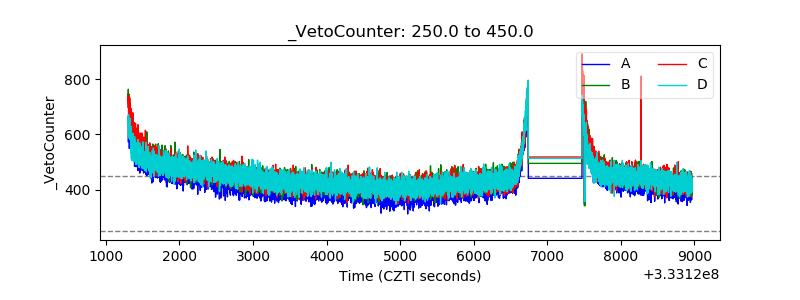 |