| Param | Original file | Final file |
|---|---|---|
| Filename | modeM0/AS1A09_033T02_9000003762_26044cztM0_level2.evt | modeM0/AS1A09_033T02_9000003762_26044cztM0_level2_quad_clean.evt |
| Size (bytes) | 235,771,200 | 28,019,520 |
| Size | 224.8 MB | 26.7 MB |
| Events in quadrant A | 1,475,400 | 163,067 |
| Events in quadrant B | 1,661,510 | 162,948 |
| Events in quadrant C | 1,485,247 | 154,070 |
| Events in quadrant D | 2,310,196 | 151,438 |
| Mode M9 | |||
|---|---|---|---|
| Quadrant | BADHDUFLAG | Total packets | Discarded packets |
| A | 0 | 2 | 0 |
| B | 0 | 3 | 0 |
| C | 0 | 3 | 0 |
| D | 0 | 3 | 0 |
| Mode M0 | |||
|---|---|---|---|
| Quadrant | BADHDUFLAG | Total packets | Discarded packets |
| A | 0 | 6224 | 0 |
| B | 0 | 6799 | 0 |
| C | 0 | 6200 | 0 |
| D | 0 | 8829 | 0 |
| Quadrant | Total seconds | Saturated seconds | Saturation percentage |
|---|---|---|---|
| A | 3030 | 35 | 1.155116% |
| B | 3030 | 97 | 3.201320% |
| C | 3030 | 51 | 1.683168% |
| D | 3030 | 186 | 6.138614% |
Noise dominated data is calculated using 1-second bins in cleaned event files. If a bin has >2000 counts, and if more than 50% of those come from <1% of pixels, then it is considered to be noise-dominated and hence unusable.
| Quadrant | # 1 sec bins | Bins with >0 counts | Bins with >2000 counts | High rate bins dominated by noise | Noise dominated (total time) | Noise dominated (detector-on time) | Marked lightcurve |
|---|---|---|---|---|---|---|---|
| A | 3045 | 3031 | 0 | 0 | 0.00% | 0.00% | 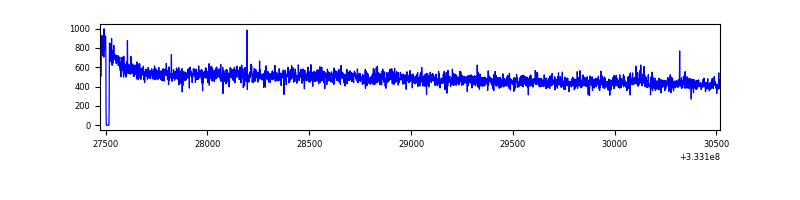 |
| B | 3045 | 3031 | 38 | 38 | 1.25% | 1.25% | 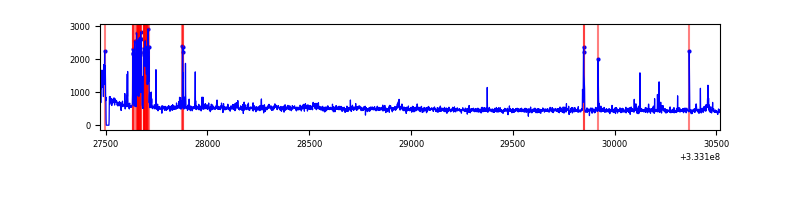 |
| C | 3045 | 3031 | 0 | 0 | 0.00% | 0.00% | 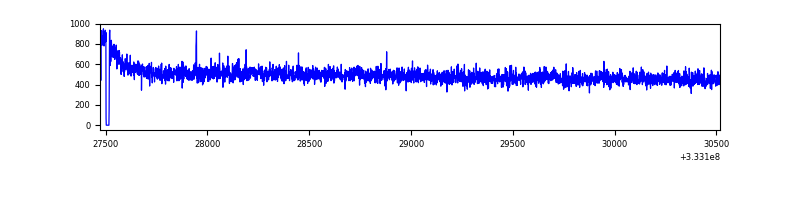 |
| D | 3045 | 3031 | 131 | 131 | 4.30% | 4.32% | 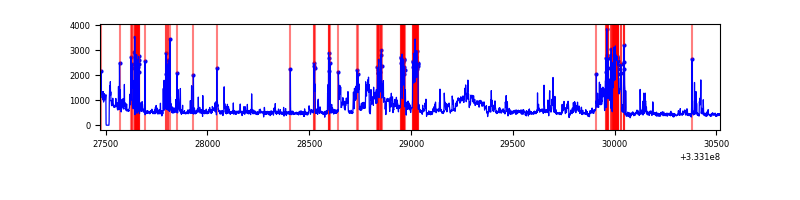 |
Top three noisy pixels from each quadrant. If the there are fewer than three noisy pixels in the level2.evt file, extra rows are filled as -1
| Pixel properties | Quadrant properties | ||||||
|---|---|---|---|---|---|---|---|
| Quadrant | DetID | PixID | Counts | Sigma | Mean | Median | Sigma |
| A | 5 | 244 | 5182 | 61.98 | 381 | 374 | 77.6 |
| A | 13 | 254 | 4062 | 47.54 | 381 | 374 | 77.6 |
| A | 3 | 137 | 3628 | 41.95 | 381 | 374 | 77.6 |
| B | 10 | 245 | 170542 | 2355.59 | 372 | 363 | 72.2 |
| B | 0 | 190 | 24253 | 330.68 | 372 | 363 | 72.2 |
| B | 0 | 229 | 10372 | 138.54 | 372 | 363 | 72.2 |
| C | 14 | 238 | 58729 | 681.18 | 362 | 364 | 85.7 |
| C | 3 | 233 | 8357 | 93.29 | 362 | 364 | 85.7 |
| C | 3 | 248 | 4568 | 49.07 | 362 | 364 | 85.7 |
| D | 1 | 52 | 925475 | 9406.2 | 362 | 354 | 98.4 |
| D | 2 | 234 | 11826 | 116.64 | 362 | 354 | 98.4 |
| D | 14 | 226 | 3518 | 32.17 | 362 | 354 | 98.4 |
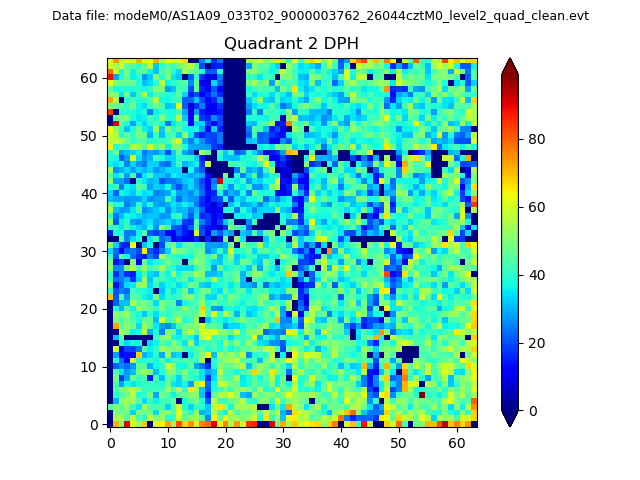
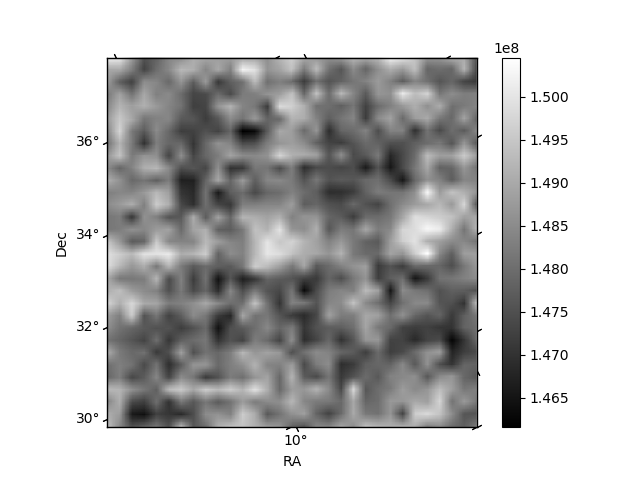
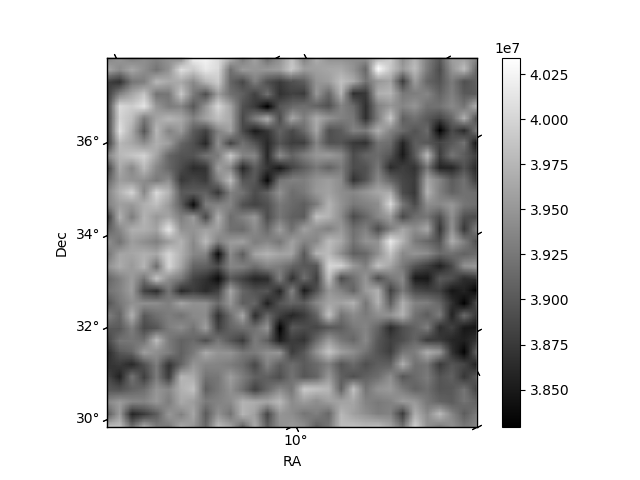
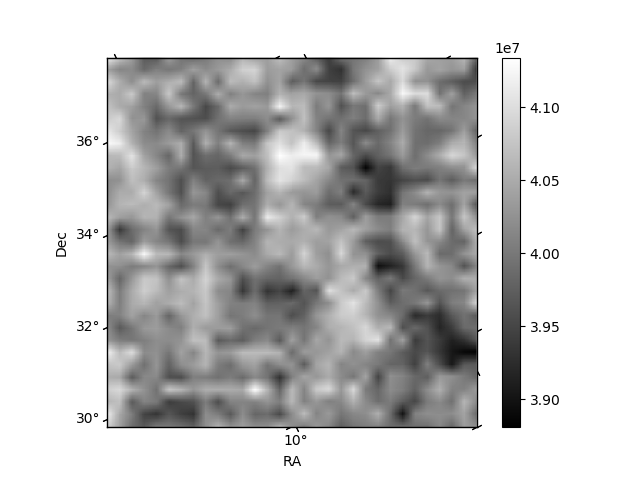
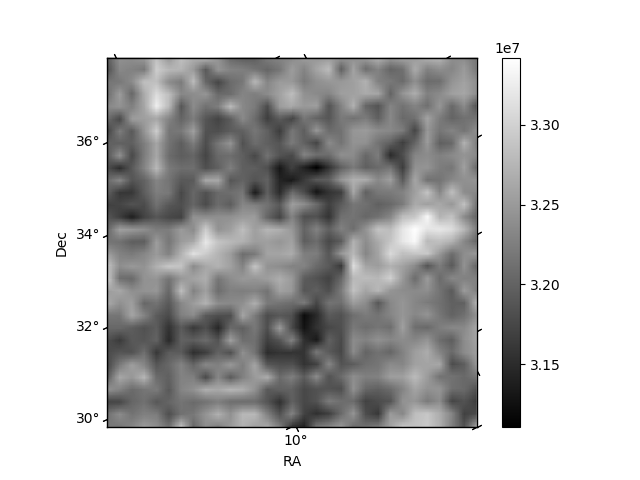
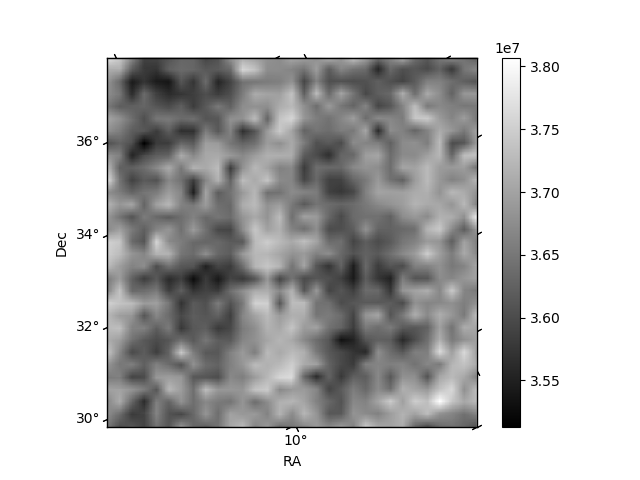
Histogram calculated using DETX and DETY for each event in the final _common_clean file
| Quadrant A | 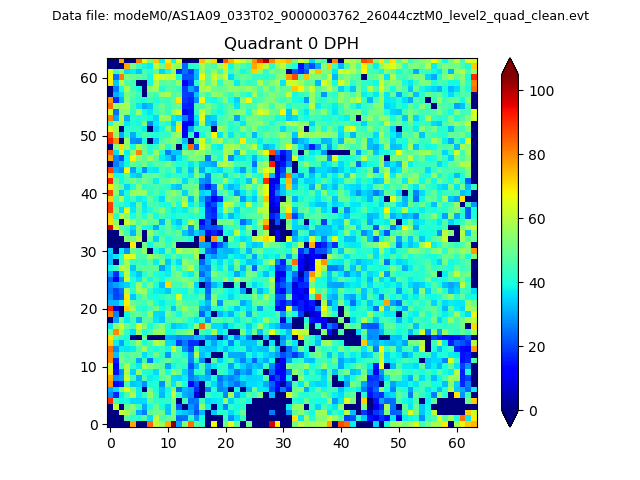 |
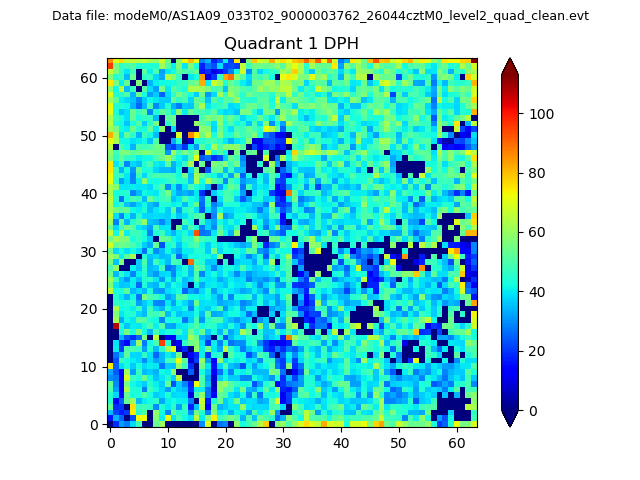 |
Quadrant B |
|---|---|---|---|
| Quadrant D | 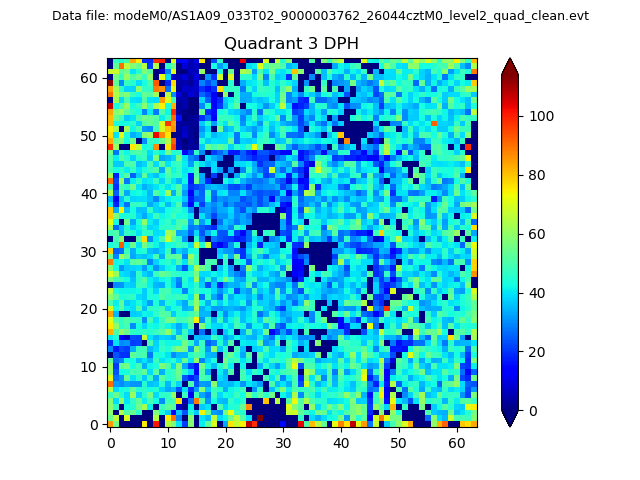 |
 |
Quadrant C |
| Plot type | Count rate plots | Images |
|---|---|---|
| Comparison with Poisson distribution Blue bars denote a histogram of data divided into 1 sec bins. Red curve is a Poisson curve with rate = median count rate of data. |
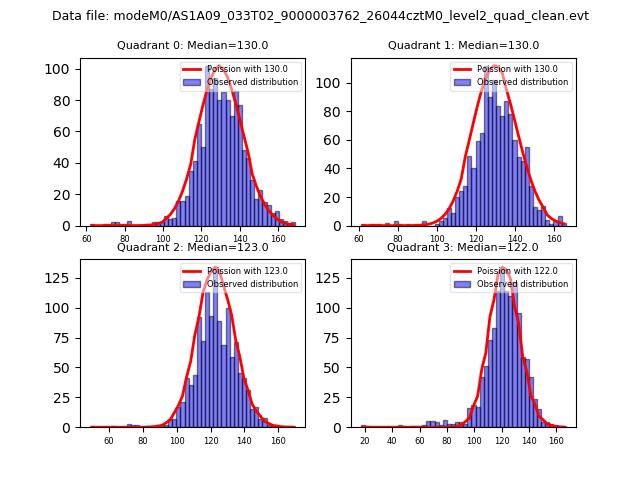 |
 |
| Quadrant-wise count rates Data is divided into 100 sec bins |
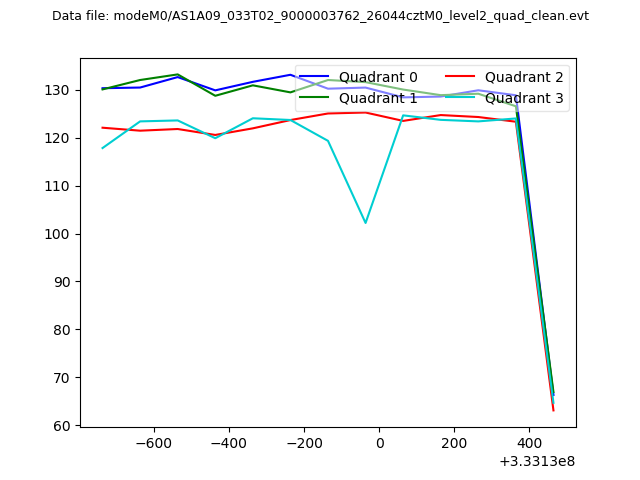 |
|
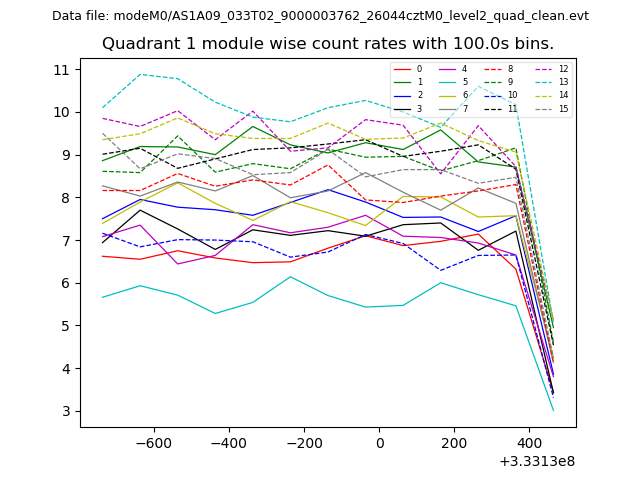
| Module-wise count rates for Quadrant A Data is divided into 100 sec bins |
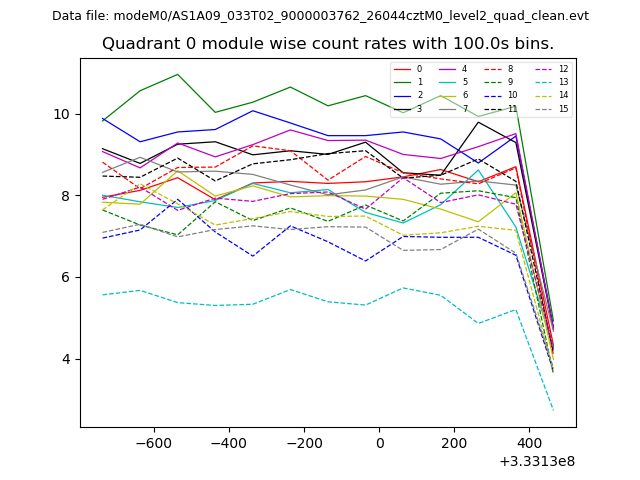 |
 |
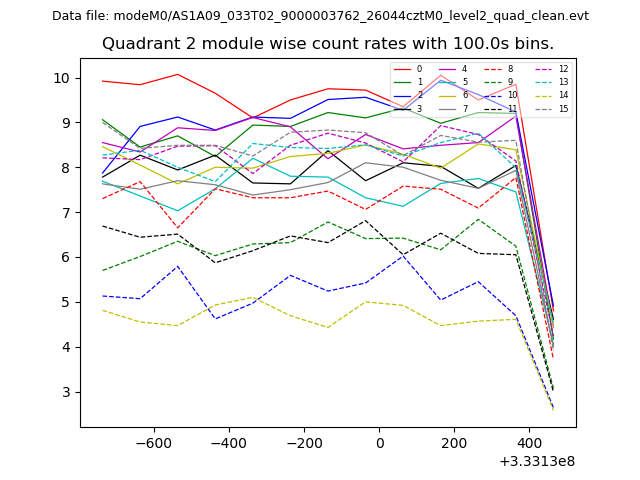
| Module-wise count rates for Quadrant B Data is divided into 100 sec bins |
 |
 |
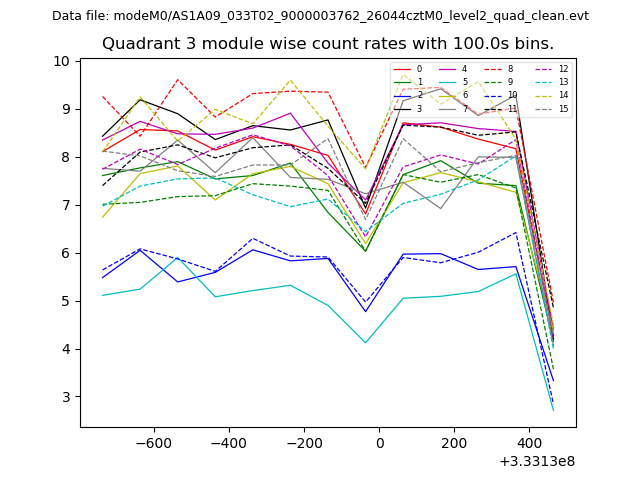
| Module-wise count rates for Quadrant C Data is divided into 100 sec bins |
 |
 |
| Module-wise count rates for Quadrant D Data is divided into 100 sec bins |
 |
 |
| Parameter | Plot |
|---|---|
| CZT HV Monitor | 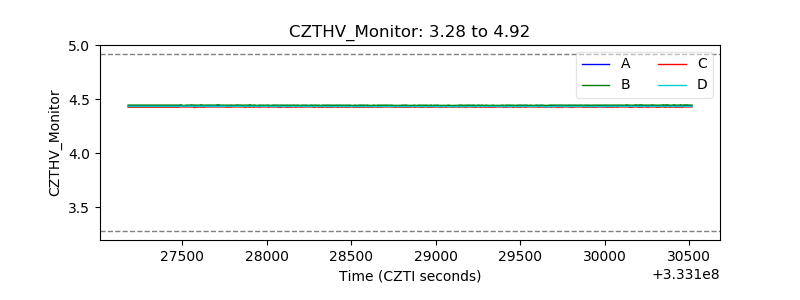 |
| D_VDD | 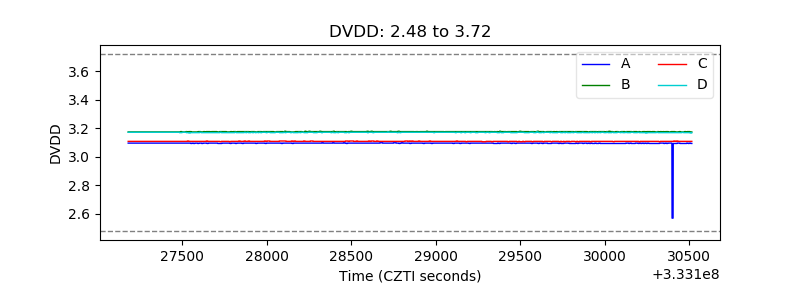 |
| Temperature 1 | 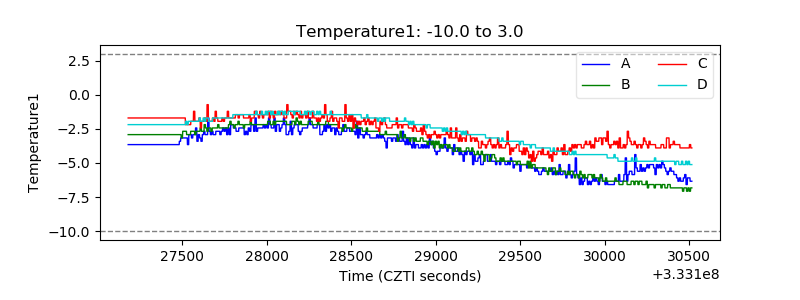 |
| Veto HV Monitor |  |
| Veto LLD | 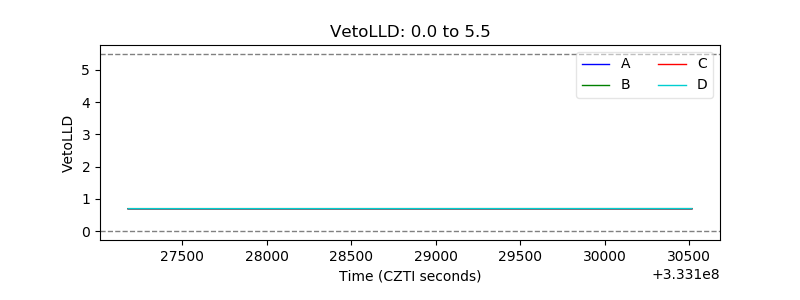 |
| Alpha Counter | 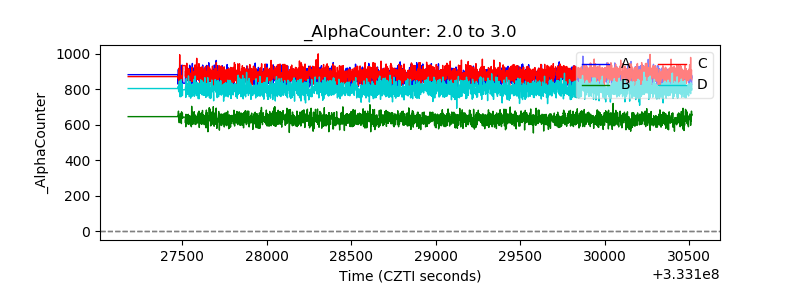 |
| _CPM_Rate | 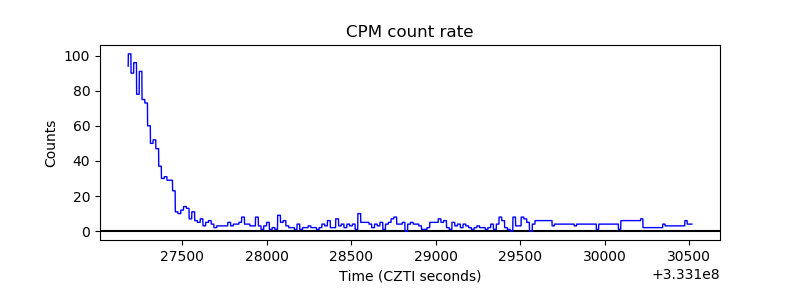 |
| CZT Counter | 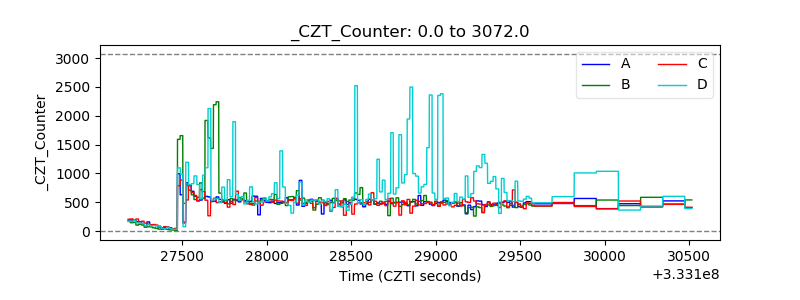 |
| +2.5 Volts monitor | 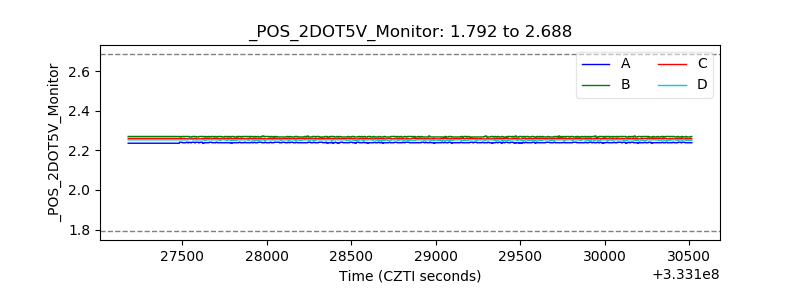 |
| +5 Volts monitor | 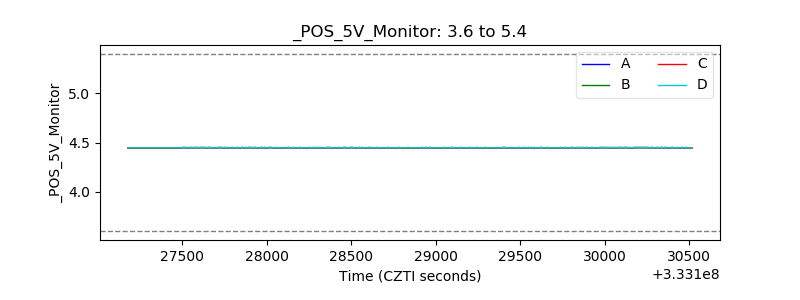 |
| _ROLL_ROT | 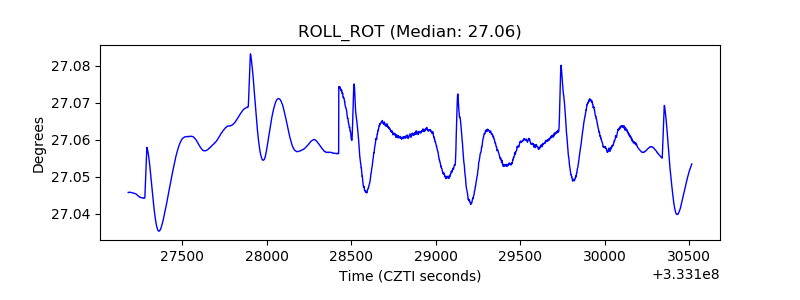 |
| _Roll_DEC |  |
| _Roll_RA | 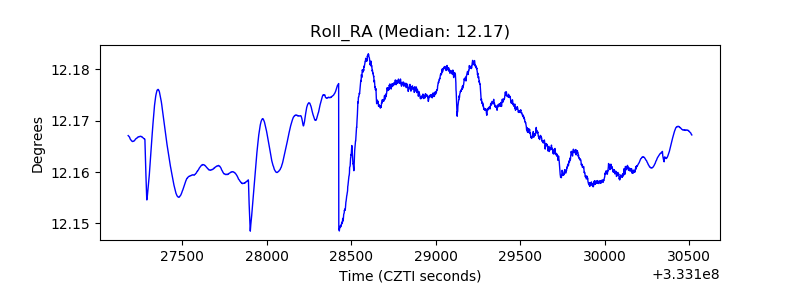 |
| Veto Counter | 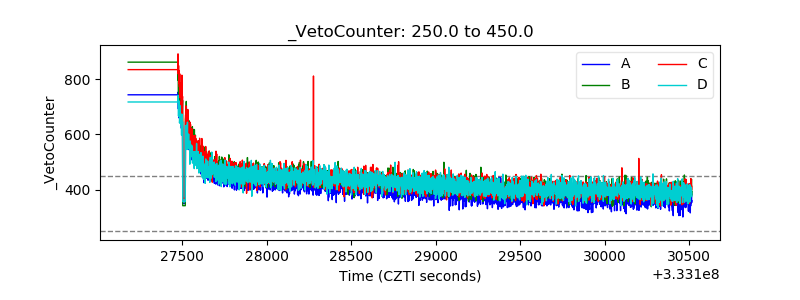 |