| Param | Original file | Final file |
|---|---|---|
| Filename | modeM0/AS1A09_085T03_9000003764cztM0_level2.fits | modeM0/AS1A09_085T03_9000003764cztM0_level2_quad_clean.evt |
| Size (bytes) | 635,117,760 | 587,211,840 |
| Size | 605.7 MB | 560.0 MB |
| Events in quadrant A | 4,056,980 | 3,554,369 |
| Events in quadrant B | 3,832,148 | 3,555,617 |
| Events in quadrant C | 3,880,482 | 3,440,092 |
| Events in quadrant D | 2,986,480 | 2,760,268 |
| Mode M0 | |||
|---|---|---|---|
| Quadrant | BADHDUFLAG | Total packets | Discarded packets |
| A | 0 | 140371 | 0 |
| B | 0 | 138875 | 0 |
| C | 0 | 135263 | 0 |
| D | 0 | 268483 | 0 |
| Mode SS | |||
|---|---|---|---|
| Quadrant | BADHDUFLAG | Total packets | Discarded packets |
| A | 0 | 1336 | 0 |
| B | 0 | 1336 | 0 |
| C | 0 | 1334 | 0 |
| D | 0 | 1336 | 0 |
| Mode M9 | |||
|---|---|---|---|
| Quadrant | BADHDUFLAG | Total packets | Discarded packets |
| A | 0 | 102 | 0 |
| B | 0 | 102 | 0 |
| C | 0 | 102 | 0 |
| D | 0 | 102 | 0 |
| Quadrant | Total seconds | Saturated seconds | Saturation percentage |
|---|---|---|---|
| A | 65228 | 831 | 1.273993% |
| B | 65216 | 861 | 1.320228% |
| C | 65222 | 1018 | 1.560823% |
| D | 65100 | 13951 | 21.430108% |
Noise dominated data is calculated using 1-second bins in cleaned event files. If a bin has >2000 counts, and if more than 50% of those come from <1% of pixels, then it is considered to be noise-dominated and hence unusable.
| Quadrant | # 1 sec bins | Bins with >0 counts | Bins with >2000 counts | High rate bins dominated by noise | Noise dominated (total time) | Noise dominated (detector-on time) | Marked lightcurve |
|---|---|---|---|---|---|---|---|
| A | 81041 | 65263 | 0 | 0 | 0.00% | 0.00% |  |
| B | 81041 | 65261 | 0 | 0 | 0.00% | 0.00% |  |
| C | 81041 | 65270 | 0 | 0 | 0.00% | 0.00% |  |
| D | 81041 | 64452 | 0 | 0 | 0.00% | 0.00% |  |
Top three noisy pixels from each quadrant. If the there are fewer than three noisy pixels in the level2.evt file, extra rows are filled as -1
| Pixel properties | Quadrant properties | ||||||
|---|---|---|---|---|---|---|---|
| Quadrant | DetID | PixID | Counts | Sigma | Mean | Median | Sigma |
| A | 0 | 29 | 3564 | 9.91 | 1058 | 997 | 259.0 |
| A | 7 | 110 | 3159 | 8.35 | 1058 | 997 | 259.0 |
| A | 0 | 30 | 3123 | 8.21 | 1058 | 997 | 259.0 |
| B | 2 | 9 | 3082 | 10.78 | 1015 | 975 | 195.4 |
| B | 2 | 8 | 2611 | 8.37 | 1015 | 975 | 195.4 |
| B | 5 | 255 | 2551 | 8.07 | 1015 | 975 | 195.4 |
| C | 12 | 241 | 2721 | 6.87 | 1025 | 963 | 256.0 |
| C | 9 | 209 | 2637 | 6.54 | 1025 | 963 | 256.0 |
| C | 2 | 191 | 2609 | 6.43 | 1025 | 963 | 256.0 |
| D | 3 | 14 | 2220 | 6.41 | 852 | 777 | 225.1 |
| D | 10 | 189 | 2149 | 6.1 | 852 | 777 | 225.1 |
| D | 6 | 231 | 2109 | 5.92 | 852 | 777 | 225.1 |
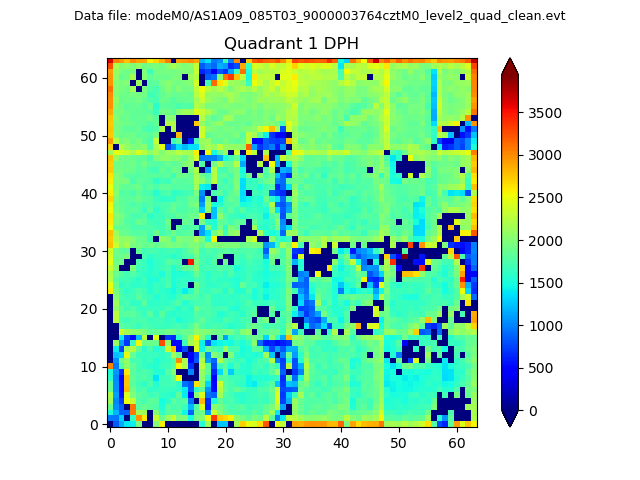
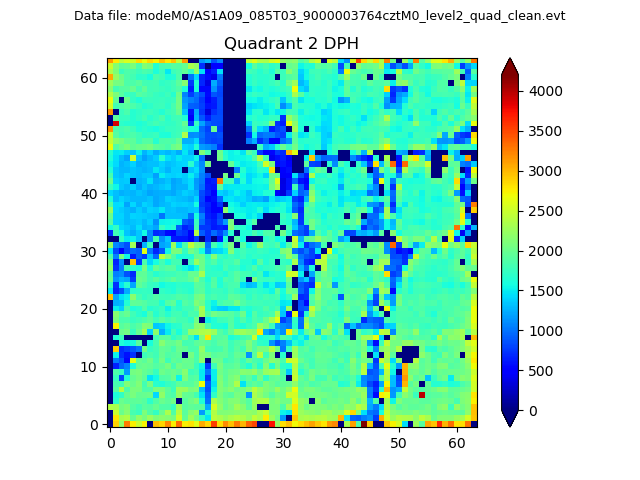
Histogram calculated using DETX and DETY for each event in the final _common_clean file
| Quadrant A |  |
 |
Quadrant B |
|---|---|---|---|
| Quadrant D | 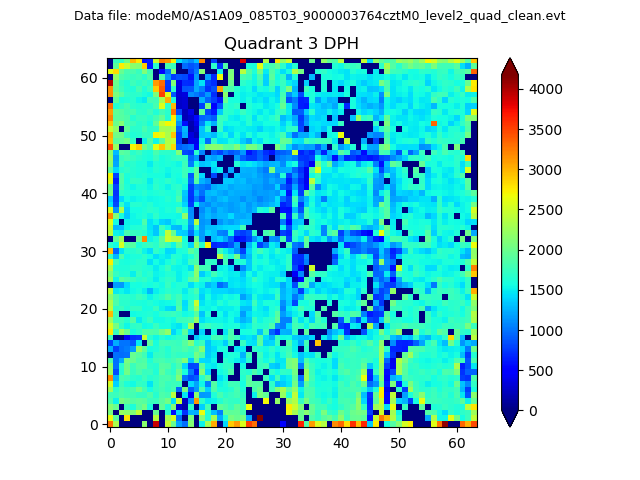 |
 |
Quadrant C |
| Plot type | Count rate plots | Images |
|---|---|---|
| Comparison with Poisson distribution Blue bars denote a histogram of data divided into 1 sec bins. Red curve is a Poisson curve with rate = median count rate of data. |
 |
 |
| Quadrant-wise count rates Data is divided into 100 sec bins |
 |
|
| Module-wise count rates for Quadrant A Data is divided into 100 sec bins |
 |
 |
| Module-wise count rates for Quadrant B Data is divided into 100 sec bins |
 |
 |
| Module-wise count rates for Quadrant C Data is divided into 100 sec bins |
 |
 |
| Module-wise count rates for Quadrant D Data is divided into 100 sec bins |
 |
 |
| Parameter | Plot |
|---|---|
| CZT HV Monitor |  |
| D_VDD |  |
| Temperature 1 |  |
| Veto HV Monitor |  |
| Veto LLD |  |
| Alpha Counter |  |
| _CPM_Rate |  |
| CZT Counter |  |
| +2.5 Volts monitor |  |
| +5 Volts monitor |  |
| _ROLL_ROT |  |
| _Roll_DEC |  |
| _Roll_RA |  |
| Veto Counter |  |