| Param | Original file | Final file |
|---|---|---|
| Filename | modeM0/AS1A09_085T03_9000003764_26045cztM0_level2.evt | modeM0/AS1A09_085T03_9000003764_26045cztM0_level2_quad_clean.evt |
| Size (bytes) | 578,580,480 | 107,660,160 |
| Size | 551.8 MB | 102.7 MB |
| Events in quadrant A | 4,253,073 | 688,647 |
| Events in quadrant B | 4,023,103 | 695,114 |
| Events in quadrant C | 3,762,914 | 672,885 |
| Events in quadrant D | 4,960,336 | 667,921 |
| Mode M0 | |||
|---|---|---|---|
| Quadrant | BADHDUFLAG | Total packets | Discarded packets |
| A | 0 | 17682 | 0 |
| B | 0 | 16921 | 0 |
| C | 0 | 16075 | 0 |
| D | 0 | 20054 | 0 |
| Mode M9 | |||
|---|---|---|---|
| Quadrant | BADHDUFLAG | Total packets | Discarded packets |
| A | 0 | 2 | 0 |
| B | 0 | 3 | 0 |
| C | 0 | 3 | 0 |
| D | 0 | 3 | 0 |
| Quadrant | Total seconds | Saturated seconds | Saturation percentage |
|---|---|---|---|
| A | 7707 | 249 | 3.230829% |
| B | 7707 | 226 | 2.932399% |
| C | 7706 | 194 | 2.517519% |
| D | 7706 | 353 | 4.580846% |
Noise dominated data is calculated using 1-second bins in cleaned event files. If a bin has >2000 counts, and if more than 50% of those come from <1% of pixels, then it is considered to be noise-dominated and hence unusable.
| Quadrant | # 1 sec bins | Bins with >0 counts | Bins with >2000 counts | High rate bins dominated by noise | Noise dominated (total time) | Noise dominated (detector-on time) | Marked lightcurve |
|---|---|---|---|---|---|---|---|
| A | 7927 | 7708 | 146 | 146 | 1.84% | 1.89% | 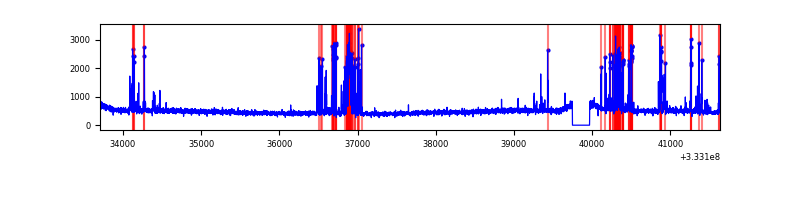 |
| B | 7927 | 7708 | 12 | 12 | 0.15% | 0.16% | 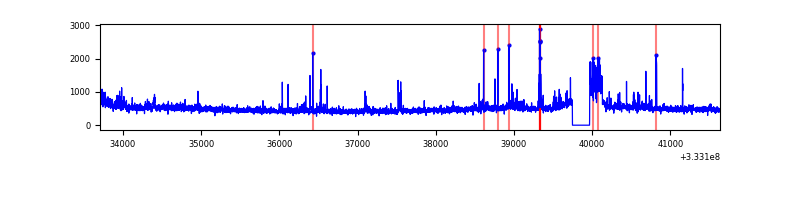 |
| C | 7926 | 7707 | 12 | 12 | 0.15% | 0.16% | 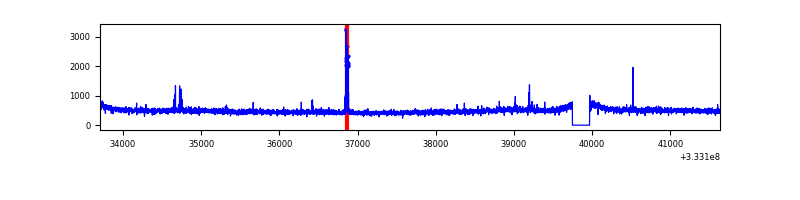 |
| D | 7926 | 7707 | 247 | 247 | 3.12% | 3.20% | 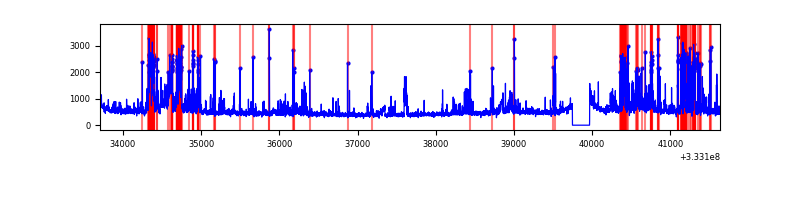 |
Top three noisy pixels from each quadrant. If the there are fewer than three noisy pixels in the level2.evt file, extra rows are filled as -1
| Pixel properties | Quadrant properties | ||||||
|---|---|---|---|---|---|---|---|
| Quadrant | DetID | PixID | Counts | Sigma | Mean | Median | Sigma |
| A | 0 | 13 | 643542 | 3416.96 | 936 | 916 | 188.1 |
| A | 13 | 254 | 11968 | 58.77 | 936 | 916 | 188.1 |
| A | 3 | 137 | 8530 | 40.49 | 936 | 916 | 188.1 |
| B | 10 | 245 | 121169 | 679.42 | 928 | 907 | 177.0 |
| B | 15 | 33 | 102567 | 574.33 | 928 | 907 | 177.0 |
| B | 0 | 190 | 72046 | 401.9 | 928 | 907 | 177.0 |
| C | 14 | 238 | 146107 | 698.24 | 898 | 900 | 208.0 |
| C | 3 | 233 | 106364 | 507.13 | 898 | 900 | 208.0 |
| C | 3 | 248 | 9405 | 40.9 | 898 | 900 | 208.0 |
| D | 1 | 52 | 1209361 | 5225.84 | 902 | 876 | 231.3 |
| D | 12 | 233 | 223157 | 961.21 | 902 | 876 | 231.3 |
| D | 2 | 153 | 39858 | 168.57 | 902 | 876 | 231.3 |
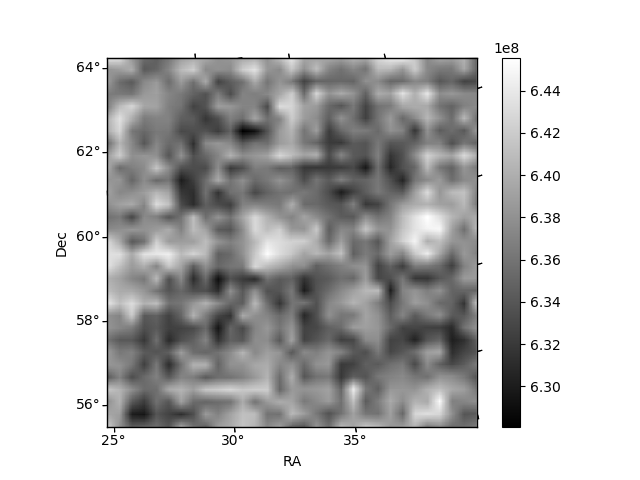
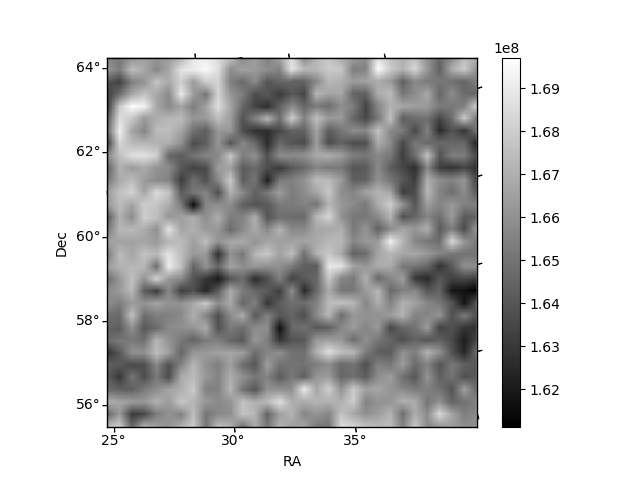
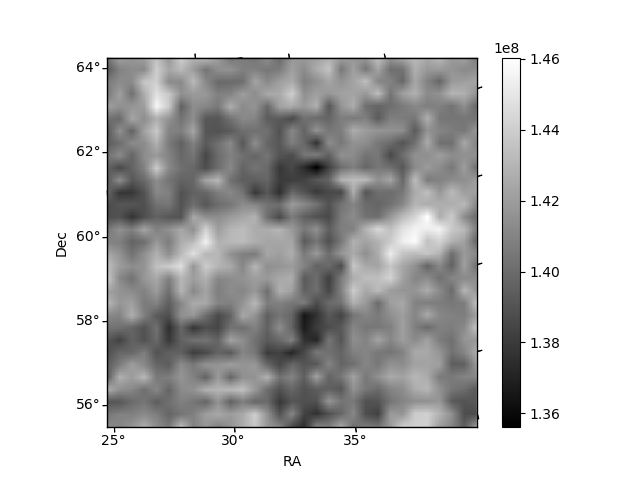
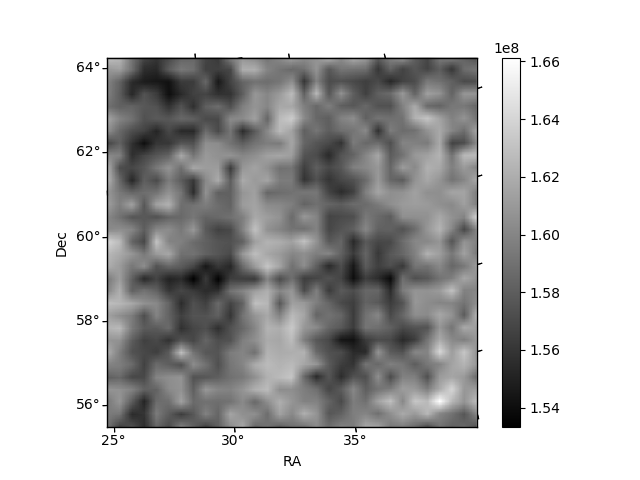
Histogram calculated using DETX and DETY for each event in the final _common_clean file
| Quadrant A | 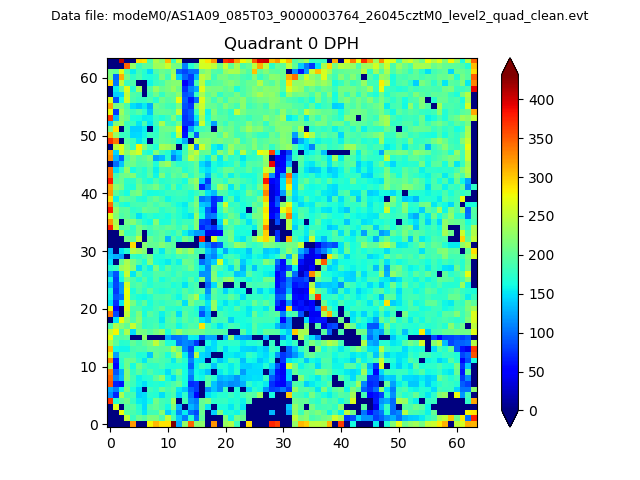 |
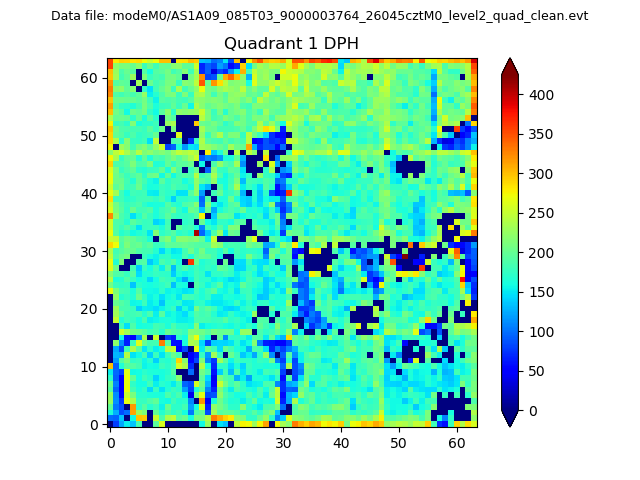 |
Quadrant B |
|---|---|---|---|
| Quadrant D |  |
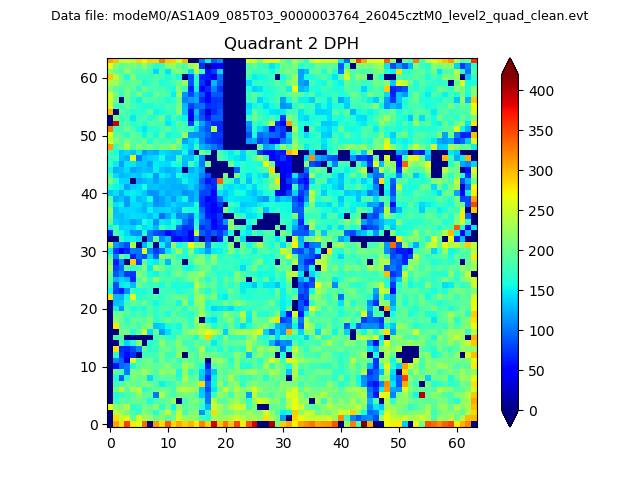 |
Quadrant C |
| Plot type | Count rate plots | Images |
|---|---|---|
| Comparison with Poisson distribution Blue bars denote a histogram of data divided into 1 sec bins. Red curve is a Poisson curve with rate = median count rate of data. |
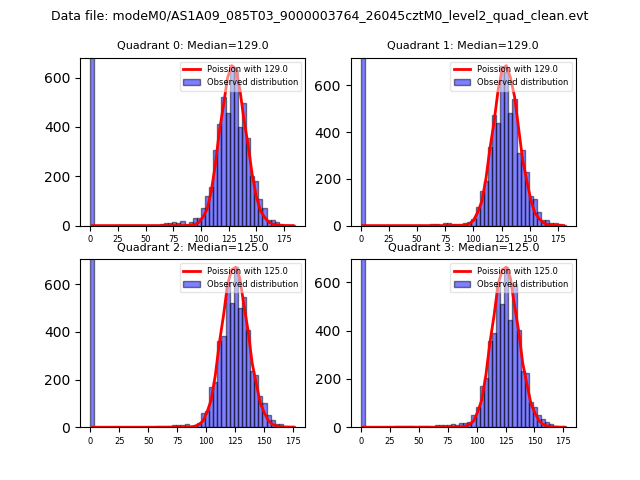 |
 |
| Quadrant-wise count rates Data is divided into 100 sec bins |
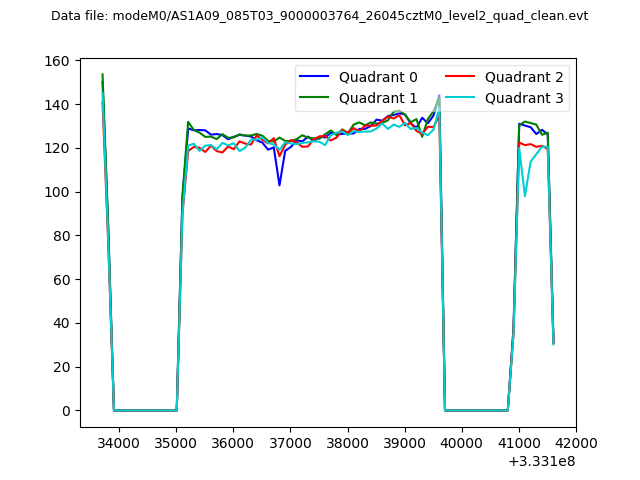 |
|
| Module-wise count rates for Quadrant A Data is divided into 100 sec bins |
 |
 |
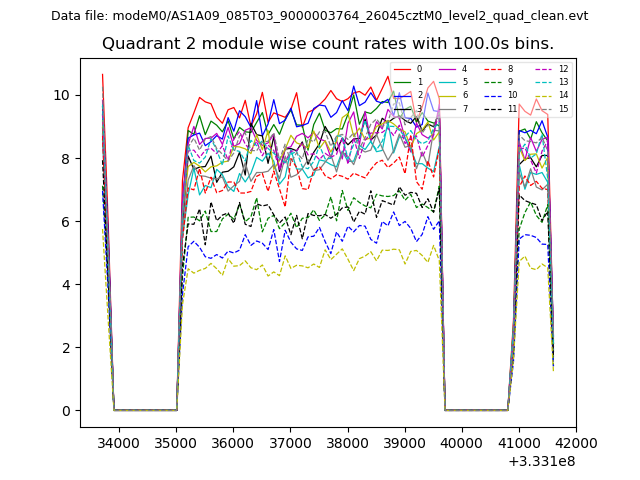
| Module-wise count rates for Quadrant B Data is divided into 100 sec bins |
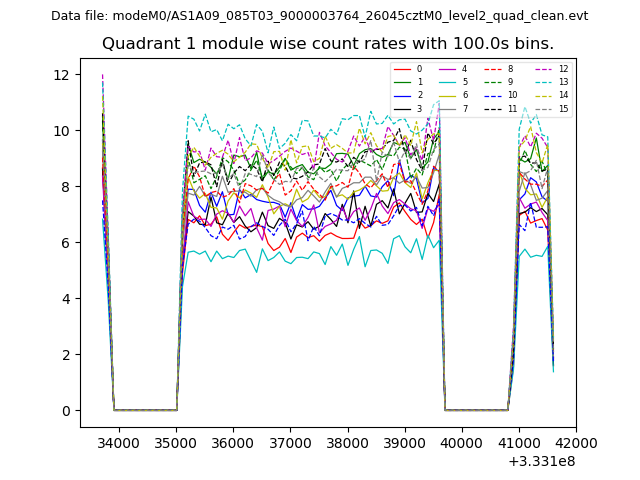 |
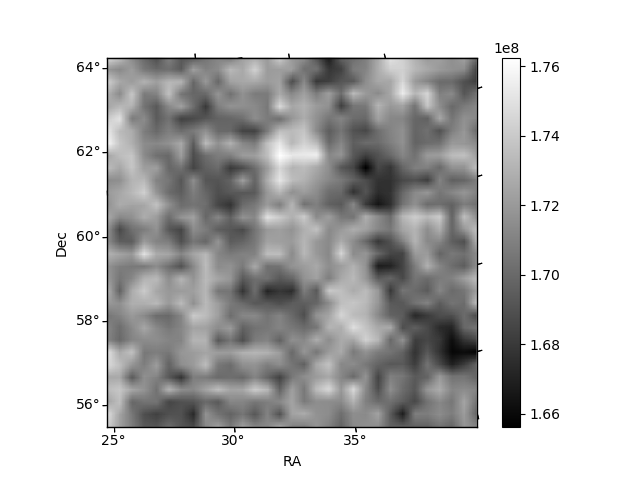 |
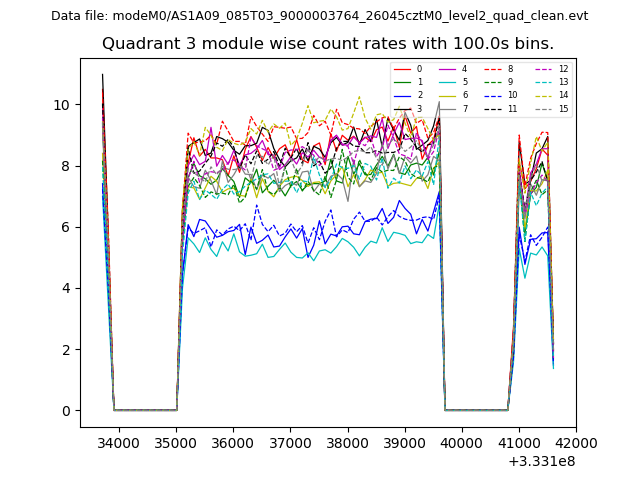
| Module-wise count rates for Quadrant C Data is divided into 100 sec bins |
 |
 |
| Module-wise count rates for Quadrant D Data is divided into 100 sec bins |
 |
 |
| Parameter | Plot |
|---|---|
| CZT HV Monitor | 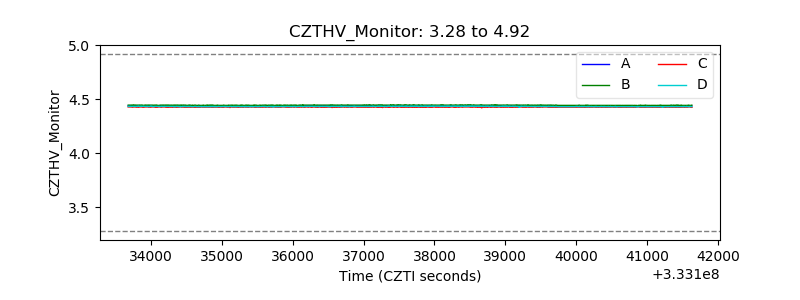 |
| D_VDD | 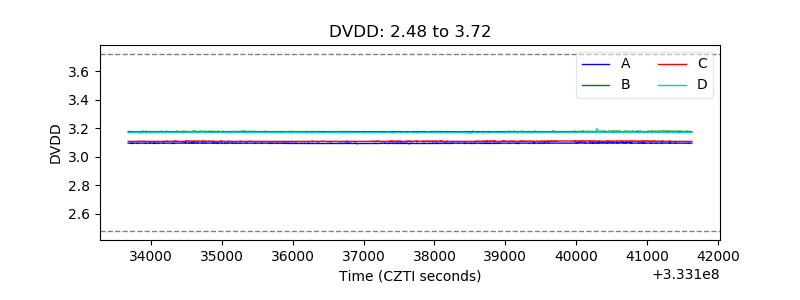 |
| Temperature 1 | 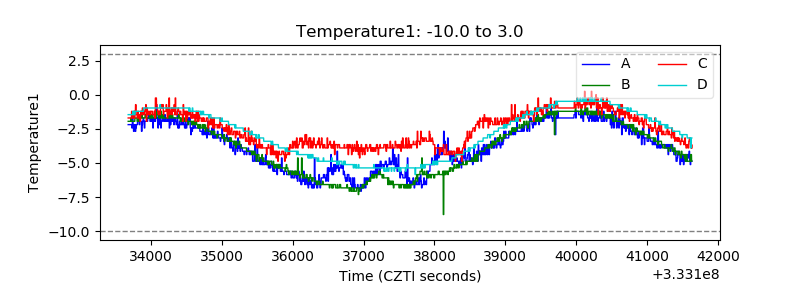 |
| Veto HV Monitor | 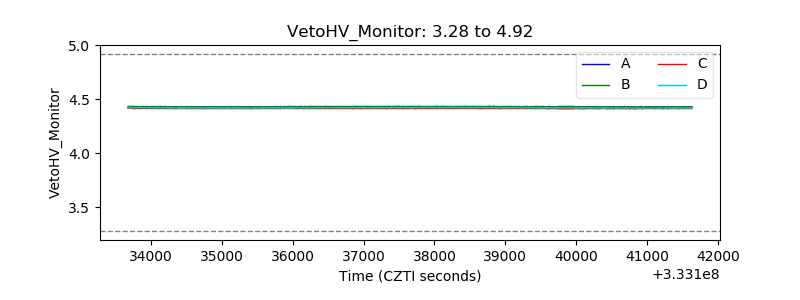 |
| Veto LLD | 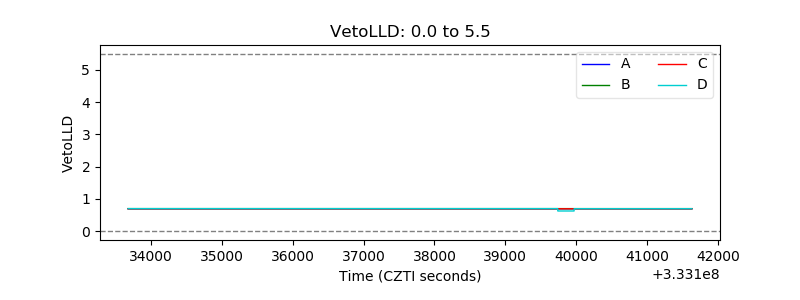 |
| Alpha Counter | 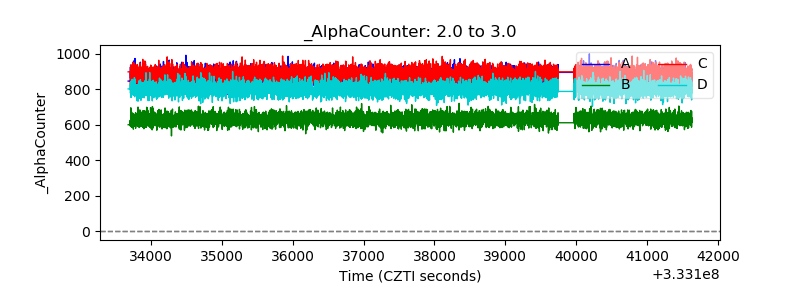 |
| _CPM_Rate | 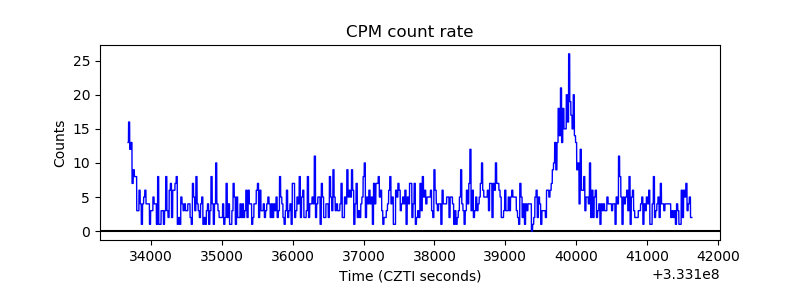 |
| CZT Counter | 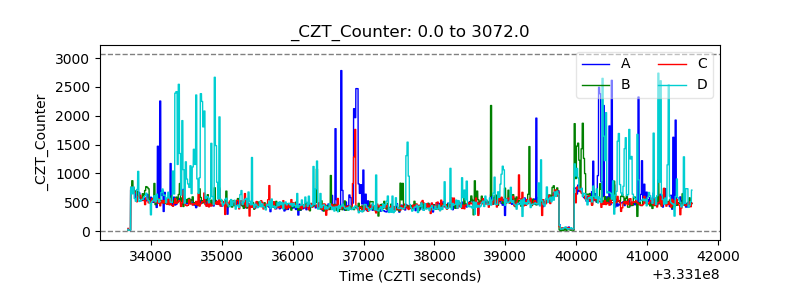 |
| +2.5 Volts monitor |  |
| +5 Volts monitor | 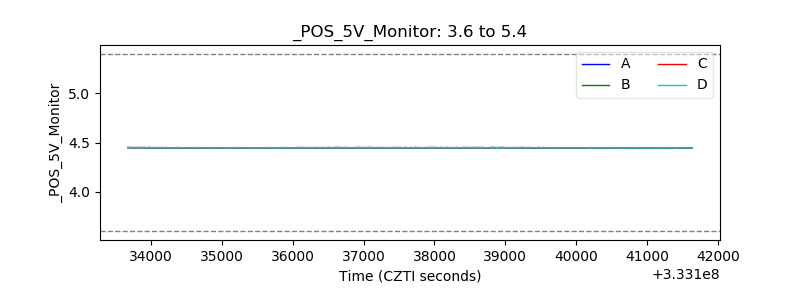 |
| _ROLL_ROT | 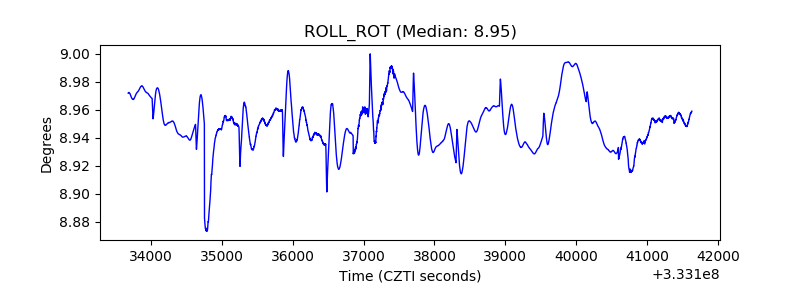 |
| _Roll_DEC | 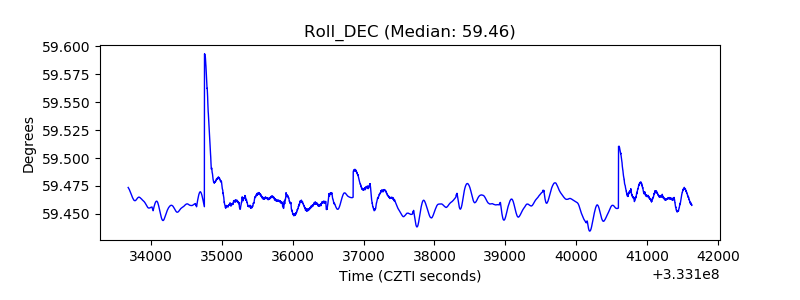 |
| _Roll_RA | 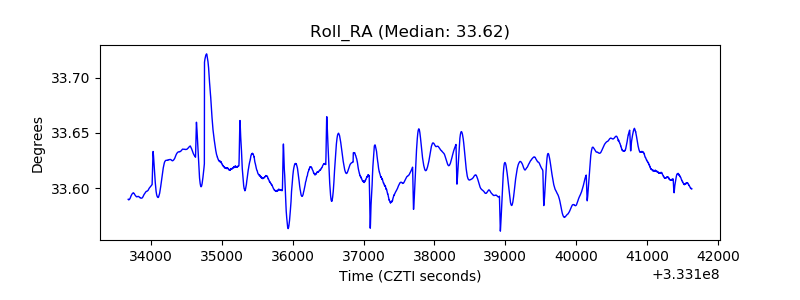 |
| Veto Counter | 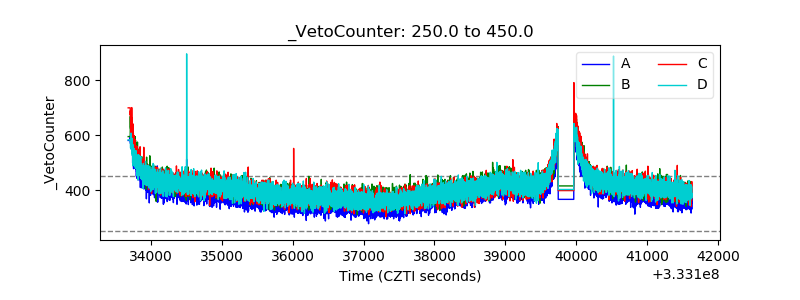 |