| Param | Original file | Final file |
|---|---|---|
| Filename | modeM0/AS1A09_085T03_9000003764_26046cztM0_level2.evt | modeM0/AS1A09_085T03_9000003764_26046cztM0_level2_quad_clean.evt |
| Size (bytes) | 578,485,440 | 109,782,720 |
| Size | 551.7 MB | 104.7 MB |
| Events in quadrant A | 3,525,309 | 722,957 |
| Events in quadrant B | 3,599,869 | 724,868 |
| Events in quadrant C | 3,410,531 | 705,313 |
| Events in quadrant D | 6,501,458 | 676,274 |
| Mode M0 | |||
|---|---|---|---|
| Quadrant | BADHDUFLAG | Total packets | Discarded packets |
| A | 0 | 15125 | 0 |
| B | 0 | 15280 | 0 |
| C | 0 | 14575 | 0 |
| D | 0 | 24172 | 0 |
| Mode M9 | |||
|---|---|---|---|
| Quadrant | BADHDUFLAG | Total packets | Discarded packets |
| A | 0 | 4 | 0 |
| B | 0 | 4 | 0 |
| C | 0 | 4 | 0 |
| D | 0 | 4 | 0 |
| Quadrant | Total seconds | Saturated seconds | Saturation percentage |
|---|---|---|---|
| A | 7115 | 62 | 0.871398% |
| B | 7116 | 67 | 0.941540% |
| C | 7116 | 92 | 1.292861% |
| D | 7116 | 775 | 10.890950% |
Noise dominated data is calculated using 1-second bins in cleaned event files. If a bin has >2000 counts, and if more than 50% of those come from <1% of pixels, then it is considered to be noise-dominated and hence unusable.
| Quadrant | # 1 sec bins | Bins with >0 counts | Bins with >2000 counts | High rate bins dominated by noise | Noise dominated (total time) | Noise dominated (detector-on time) | Marked lightcurve |
|---|---|---|---|---|---|---|---|
| A | 7520 | 7116 | 39 | 39 | 0.52% | 0.55% | 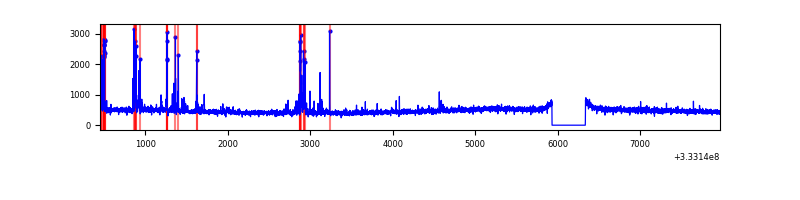 |
| B | 7521 | 7116 | 9 | 9 | 0.12% | 0.13% | 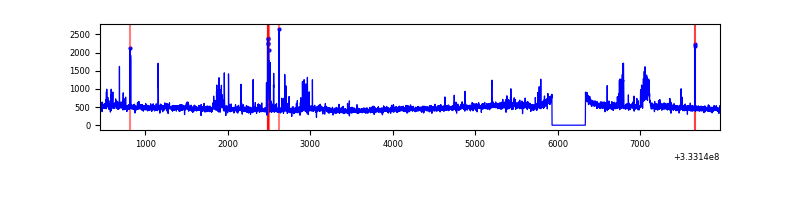 |
| C | 7521 | 7116 | 2 | 2 | 0.03% | 0.03% | 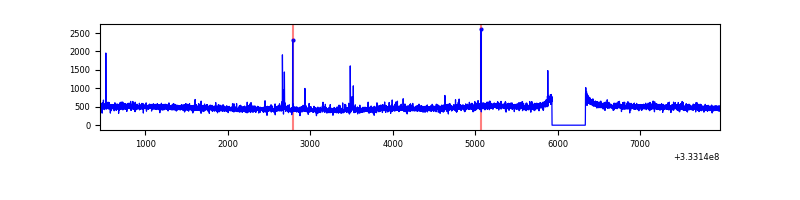 |
| D | 7521 | 7116 | 597 | 597 | 7.94% | 8.39% | 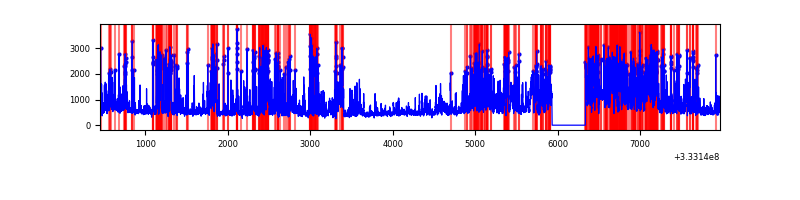 |
Top three noisy pixels from each quadrant. If the there are fewer than three noisy pixels in the level2.evt file, extra rows are filled as -1
| Pixel properties | Quadrant properties | ||||||
|---|---|---|---|---|---|---|---|
| Quadrant | DetID | PixID | Counts | Sigma | Mean | Median | Sigma |
| A | 0 | 13 | 253351 | 1468.96 | 848 | 831 | 171.9 |
| A | 13 | 254 | 11772 | 63.65 | 848 | 831 | 171.9 |
| A | 3 | 137 | 7830 | 40.71 | 848 | 831 | 171.9 |
| B | 0 | 190 | 106940 | 655.35 | 844 | 822 | 161.9 |
| B | 10 | 245 | 88611 | 542.16 | 844 | 822 | 161.9 |
| B | 0 | 229 | 50208 | 304.99 | 844 | 822 | 161.9 |
| C | 14 | 238 | 132098 | 690.88 | 819 | 825 | 190.0 |
| C | 3 | 233 | 59042 | 306.39 | 819 | 825 | 190.0 |
| C | 3 | 248 | 18529 | 93.18 | 819 | 825 | 190.0 |
| D | 1 | 52 | 2996322 | 14398.52 | 794 | 773 | 208.0 |
| D | 12 | 233 | 244333 | 1170.7 | 794 | 773 | 208.0 |
| D | 12 | 217 | 97599 | 465.41 | 794 | 773 | 208.0 |
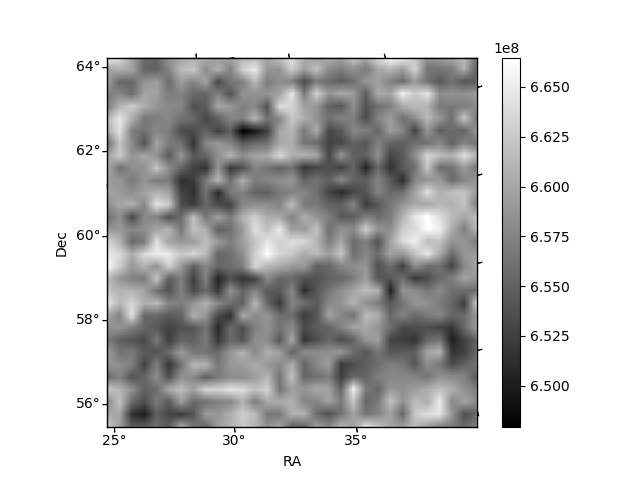
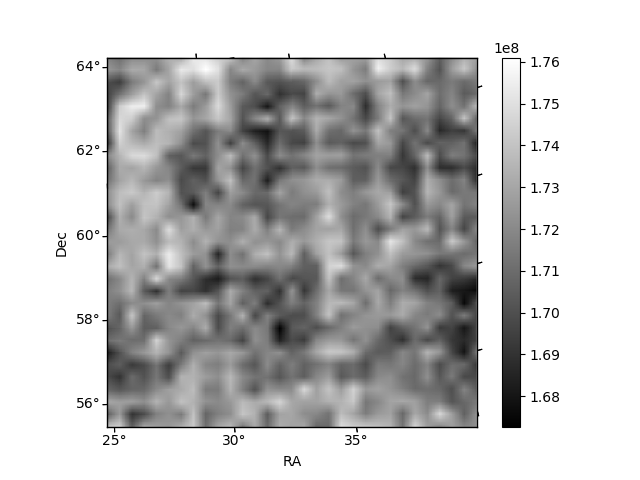
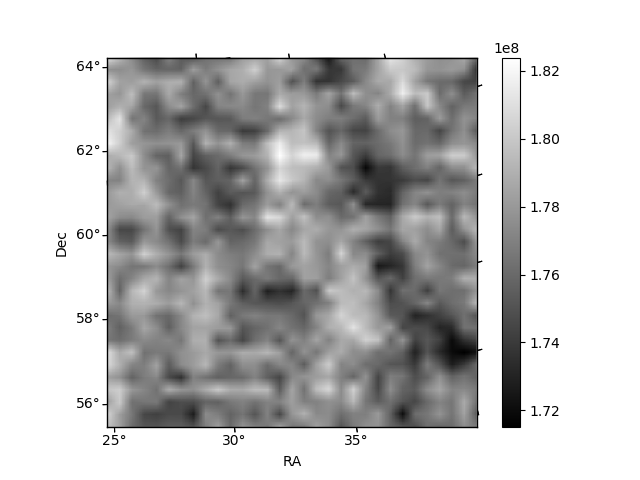
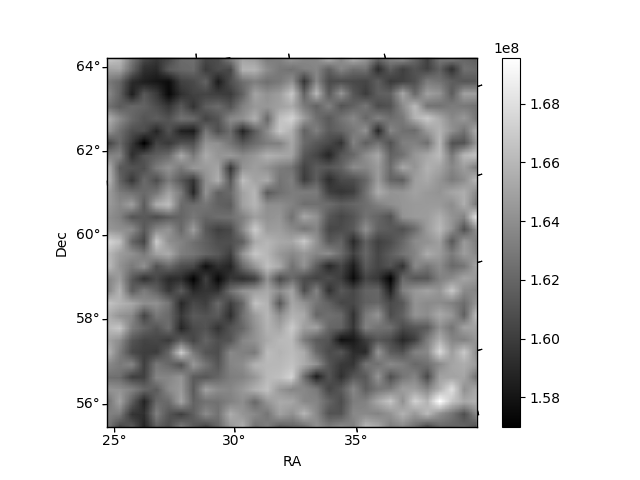
Histogram calculated using DETX and DETY for each event in the final _common_clean file
| Quadrant A | 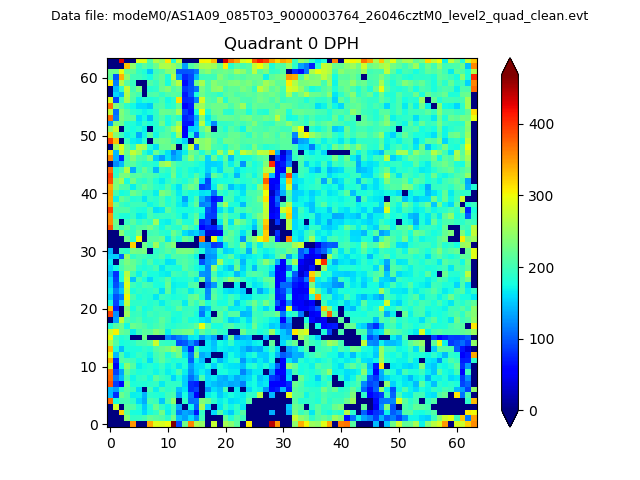 |
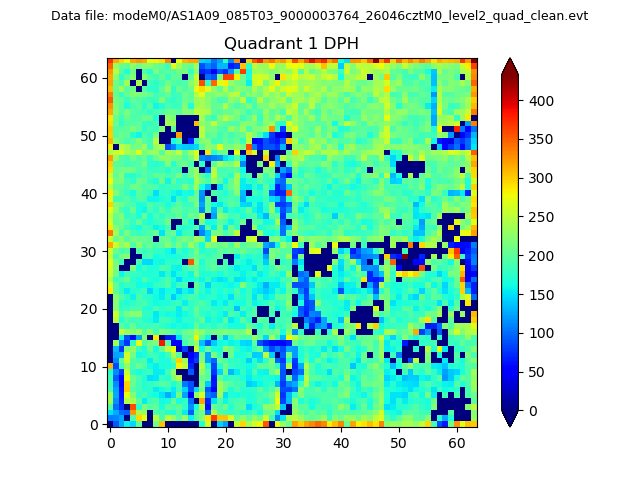 |
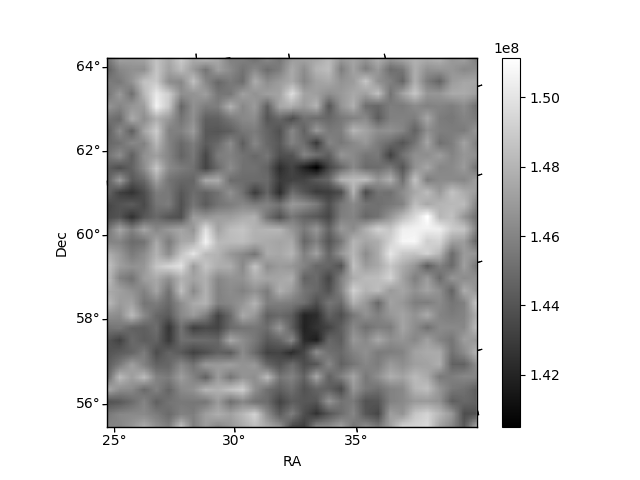
Quadrant B |
|---|---|---|---|
| Quadrant D | 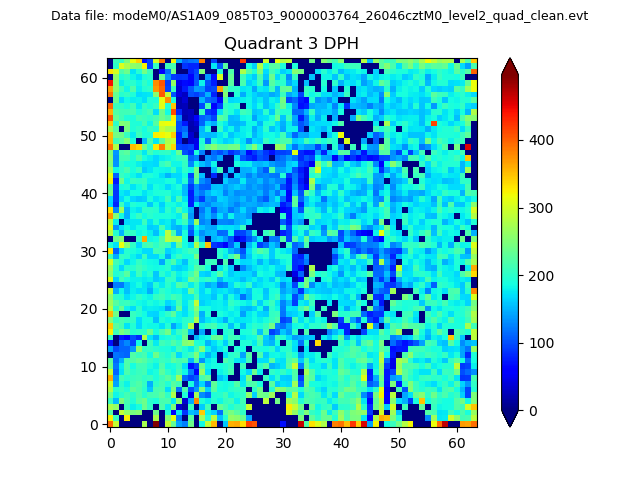 |
 |
Quadrant C |
| Plot type | Count rate plots | Images |
|---|---|---|
| Comparison with Poisson distribution Blue bars denote a histogram of data divided into 1 sec bins. Red curve is a Poisson curve with rate = median count rate of data. |
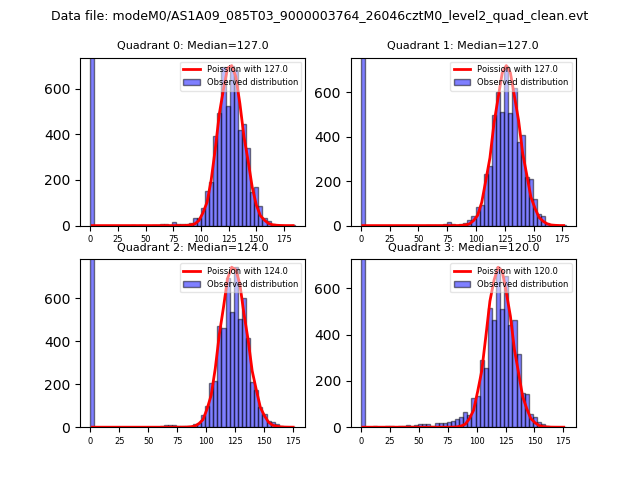 |
 |
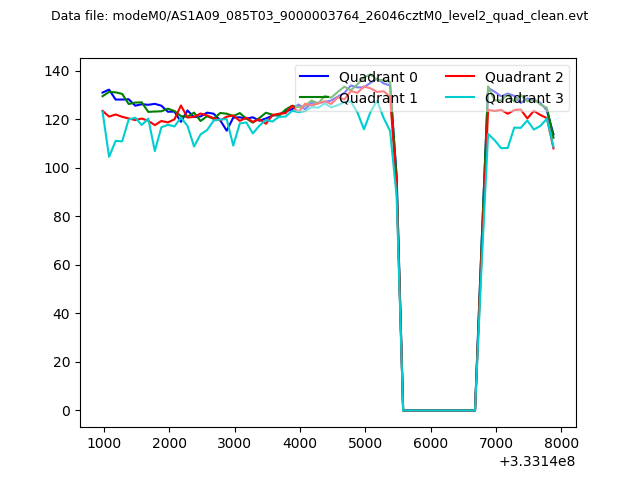
| Quadrant-wise count rates Data is divided into 100 sec bins |
 |
|
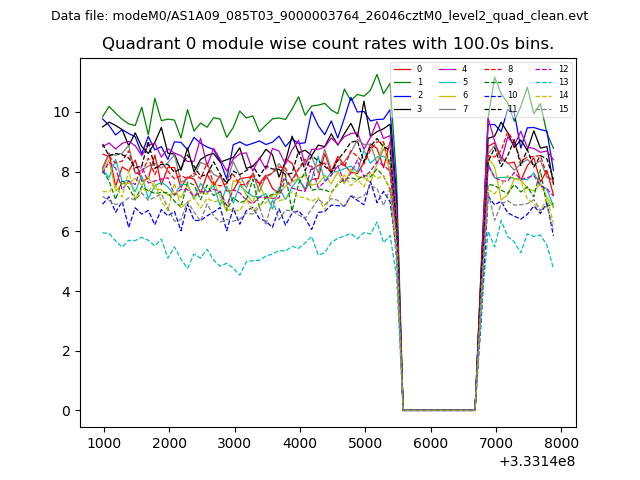
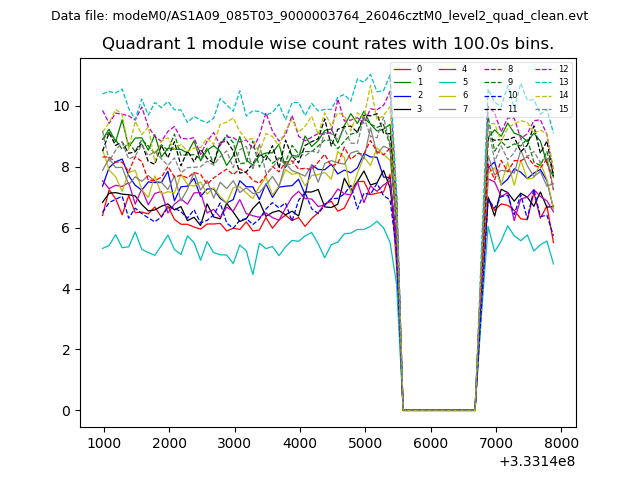
| Module-wise count rates for Quadrant A Data is divided into 100 sec bins |
 |
 |
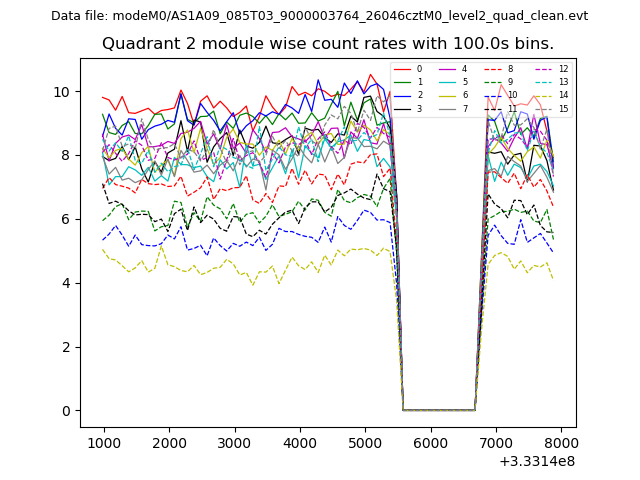
| Module-wise count rates for Quadrant B Data is divided into 100 sec bins |
 |
 |
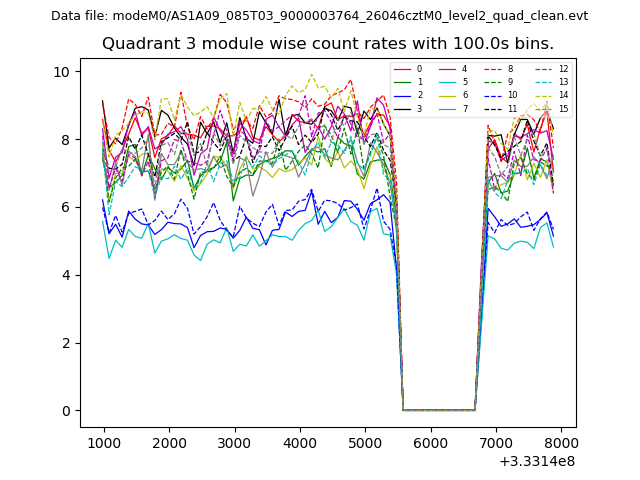
| Module-wise count rates for Quadrant C Data is divided into 100 sec bins |
 |
 |
| Module-wise count rates for Quadrant D Data is divided into 100 sec bins |
 |
 |
| Parameter | Plot |
|---|---|
| CZT HV Monitor |  |
| D_VDD | 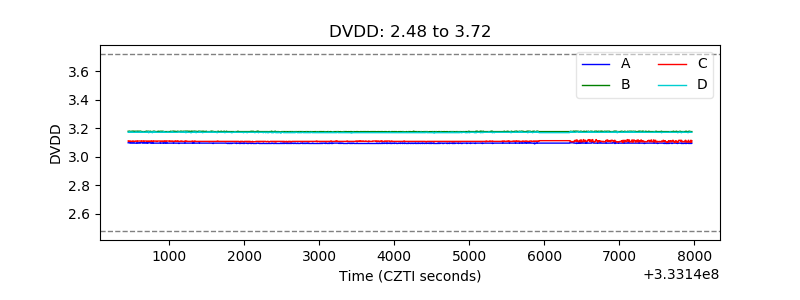 |
| Temperature 1 | 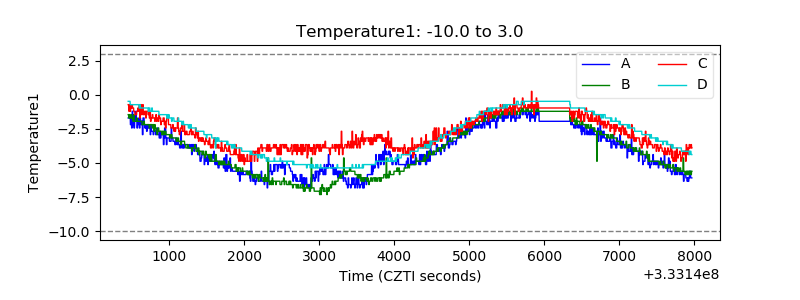 |
| Veto HV Monitor | 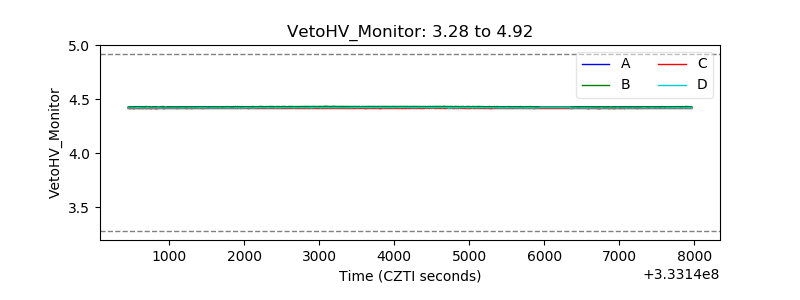 |
| Veto LLD | 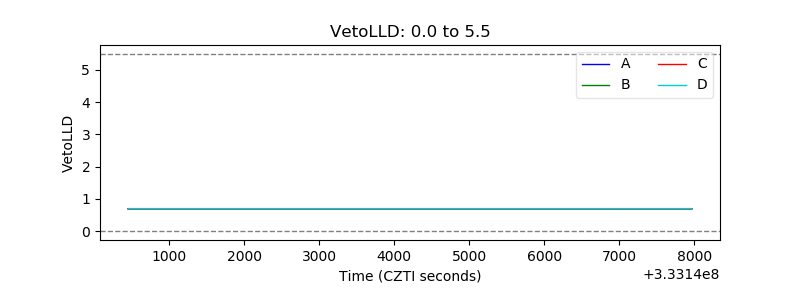 |
| Alpha Counter |  |
| _CPM_Rate | 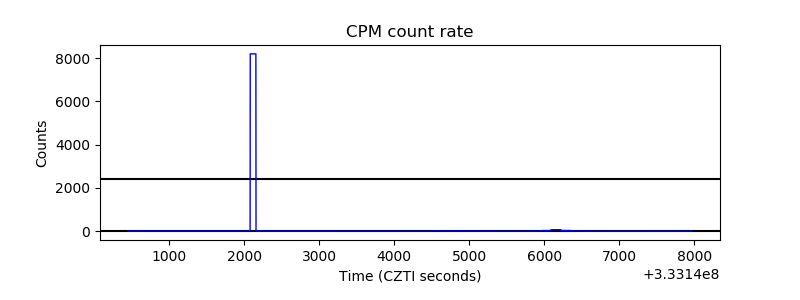 |
| CZT Counter | 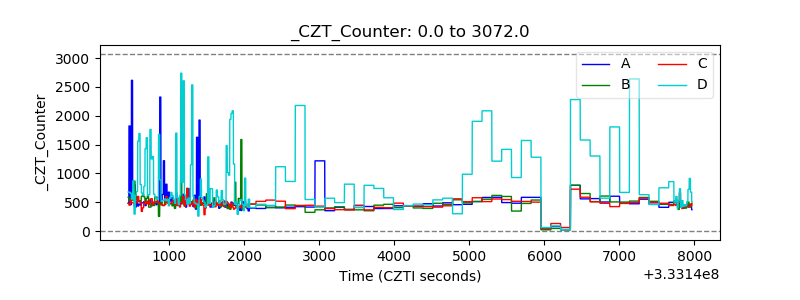 |
| +2.5 Volts monitor |  |
| +5 Volts monitor | 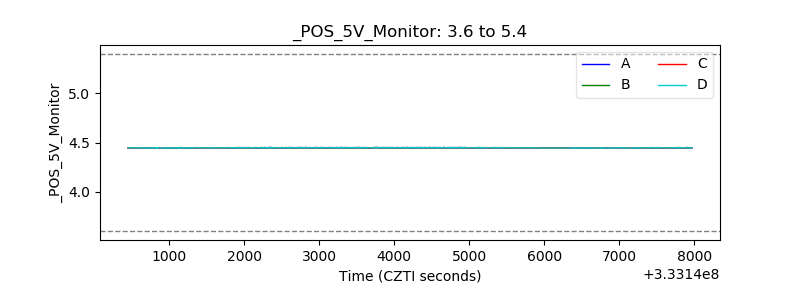 |
| _ROLL_ROT | 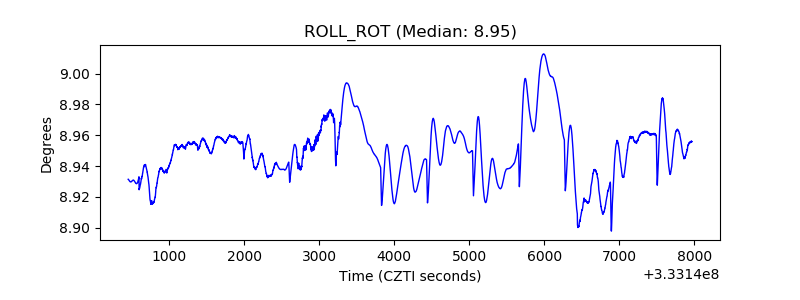 |
| _Roll_DEC | 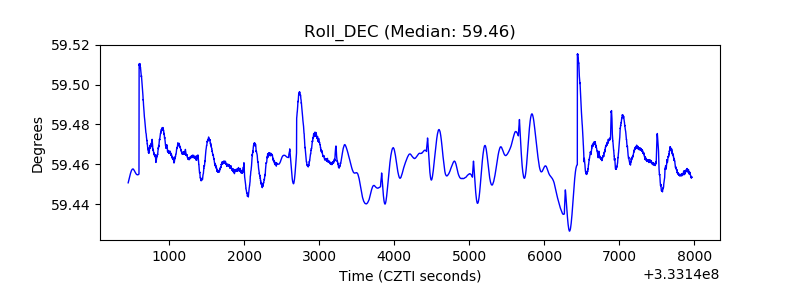 |
| _Roll_RA | 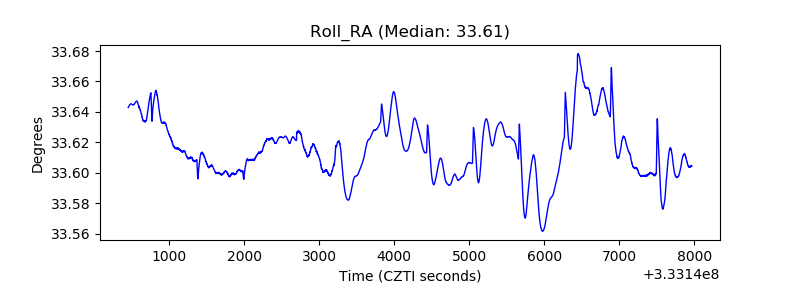 |
| Veto Counter | 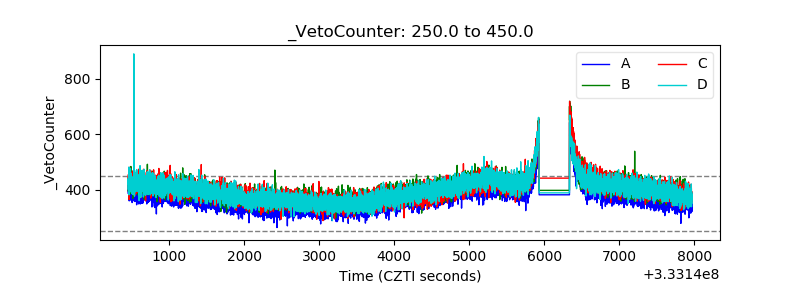 |