| Param | Original file | Final file |
|---|---|---|
| Filename | modeM0/AS1A09_085T03_9000003764_26049cztM0_level2.evt | modeM0/AS1A09_085T03_9000003764_26049cztM0_level2_quad_clean.evt |
| Size (bytes) | 628,499,520 | 109,396,800 |
| Size | 599.4 MB | 104.3 MB |
| Events in quadrant A | 3,280,464 | 718,119 |
| Events in quadrant B | 3,407,823 | 731,290 |
| Events in quadrant C | 3,400,563 | 711,531 |
| Events in quadrant D | 8,467,007 | 660,098 |
| Mode M0 | |||
|---|---|---|---|
| Quadrant | BADHDUFLAG | Total packets | Discarded packets |
| A | 0 | 14499 | 0 |
| B | 0 | 14897 | 0 |
| C | 0 | 14773 | 0 |
| D | 0 | 30110 | 0 |
| Mode M9 | |||
|---|---|---|---|
| Quadrant | BADHDUFLAG | Total packets | Discarded packets |
| A | 0 | 16 | 0 |
| B | 0 | 16 | 0 |
| C | 0 | 16 | 0 |
| D | 0 | 16 | 0 |
| Quadrant | Total seconds | Saturated seconds | Saturation percentage |
|---|---|---|---|
| A | 7053 | 48 | 0.680561% |
| B | 7054 | 86 | 1.219166% |
| C | 7054 | 120 | 1.701162% |
| D | 7054 | 1323 | 18.755316% |
Noise dominated data is calculated using 1-second bins in cleaned event files. If a bin has >2000 counts, and if more than 50% of those come from <1% of pixels, then it is considered to be noise-dominated and hence unusable.
| Quadrant | # 1 sec bins | Bins with >0 counts | Bins with >2000 counts | High rate bins dominated by noise | Noise dominated (total time) | Noise dominated (detector-on time) | Marked lightcurve |
|---|---|---|---|---|---|---|---|
| A | 8748 | 7054 | 1 | 1 | 0.01% | 0.01% | 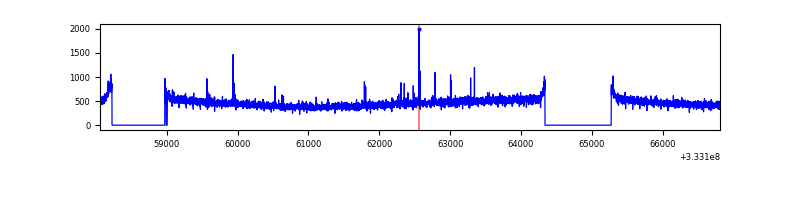 |
| B | 8749 | 7055 | 1 | 1 | 0.01% | 0.01% | 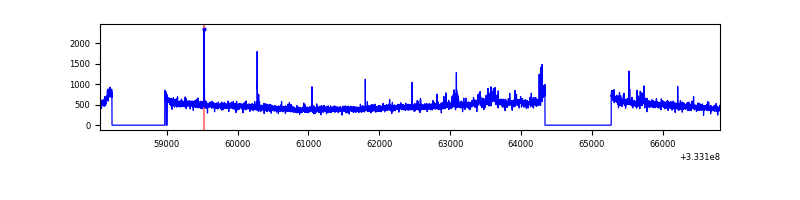 |
| C | 8749 | 7056 | 0 | 0 | 0.00% | 0.00% | 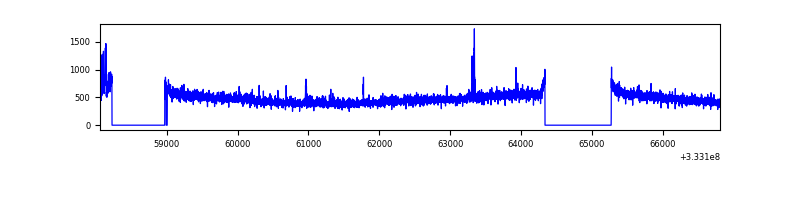 |
| D | 8749 | 7055 | 1178 | 1178 | 13.46% | 16.70% | 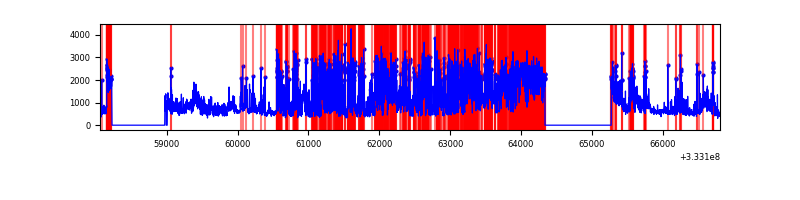 |
Top three noisy pixels from each quadrant. If the there are fewer than three noisy pixels in the level2.evt file, extra rows are filled as -1
| Pixel properties | Quadrant properties | ||||||
|---|---|---|---|---|---|---|---|
| Quadrant | DetID | PixID | Counts | Sigma | Mean | Median | Sigma |
| A | 0 | 13 | 29247 | 167.77 | 843 | 823 | 169.4 |
| A | 13 | 254 | 11561 | 63.38 | 843 | 823 | 169.4 |
| A | 3 | 137 | 7873 | 41.61 | 843 | 823 | 169.4 |
| B | 0 | 190 | 52269 | 321.26 | 843 | 822 | 160.1 |
| B | 0 | 229 | 44075 | 270.09 | 843 | 822 | 160.1 |
| B | 12 | 111 | 19844 | 118.78 | 843 | 822 | 160.1 |
| C | 14 | 238 | 130529 | 680.88 | 815 | 820 | 190.5 |
| C | 3 | 233 | 69805 | 362.12 | 815 | 820 | 190.5 |
| C | 8 | 128 | 11827 | 57.78 | 815 | 820 | 190.5 |
| D | 1 | 52 | 4759940 | 23649.13 | 753 | 739 | 201.2 |
| D | 1 | 3 | 613976 | 3047.26 | 753 | 739 | 201.2 |
| D | 12 | 233 | 155708 | 770.06 | 753 | 739 | 201.2 |
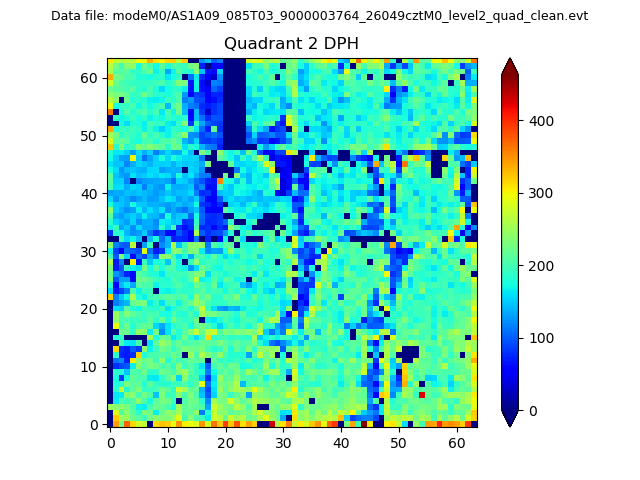
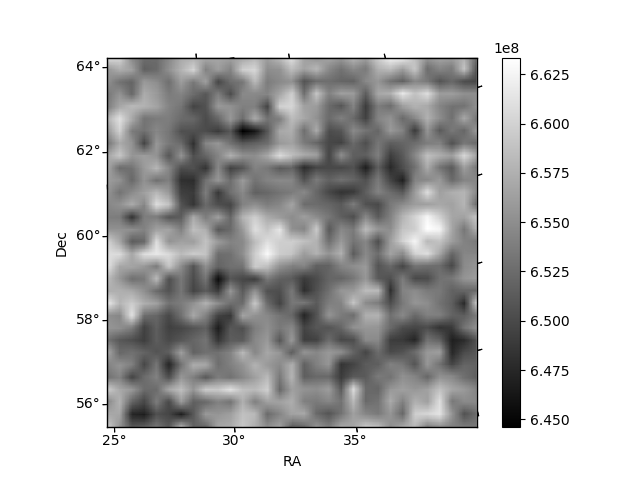
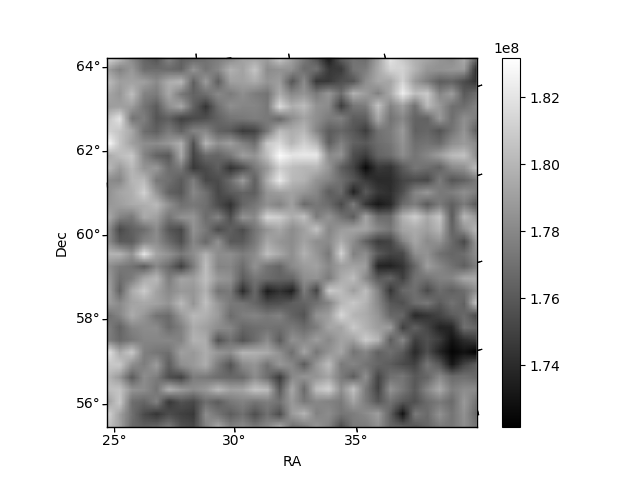
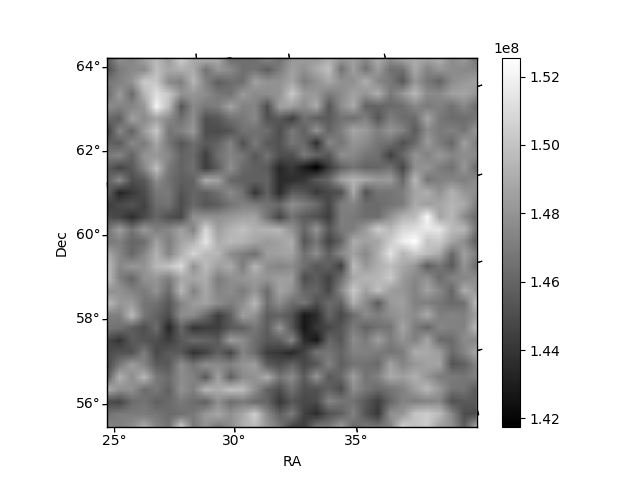
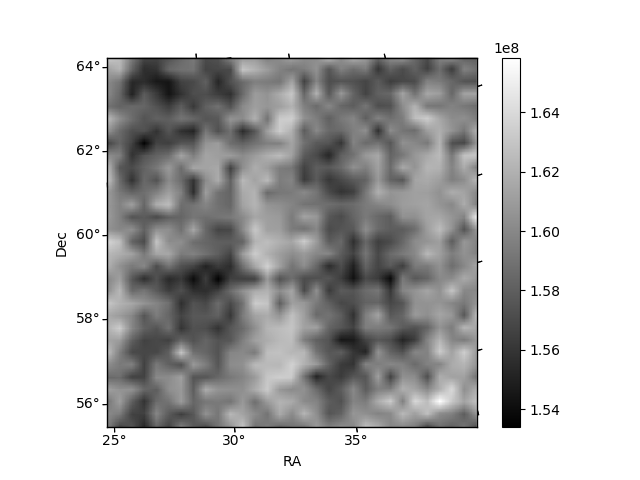
Histogram calculated using DETX and DETY for each event in the final _common_clean file
| Quadrant A | 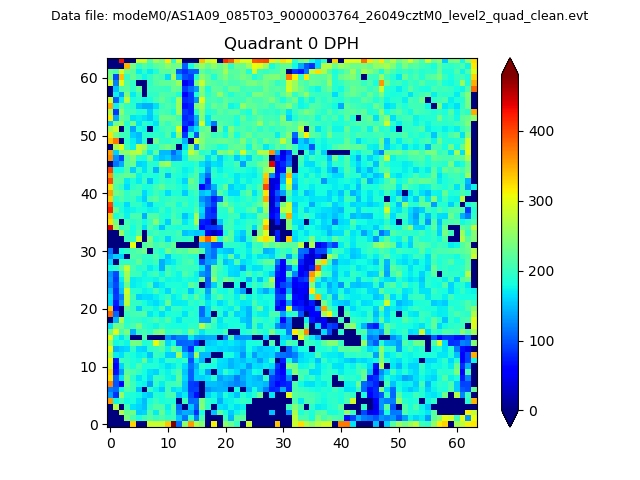 |
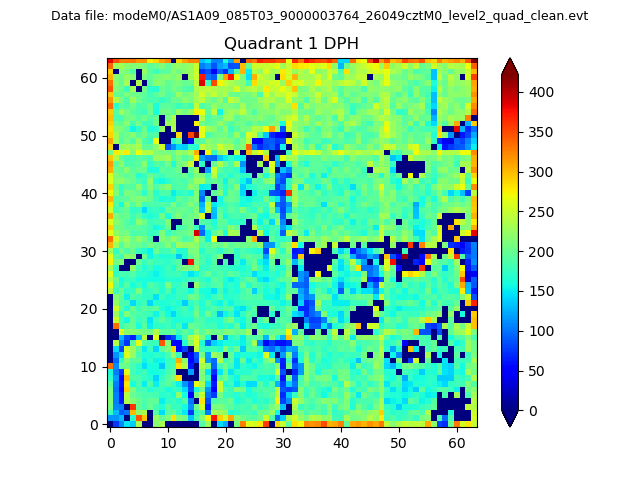 |
Quadrant B |
|---|---|---|---|
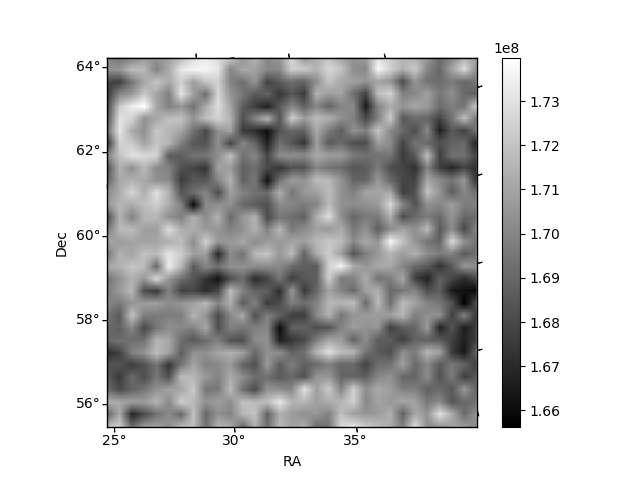
| Quadrant D | 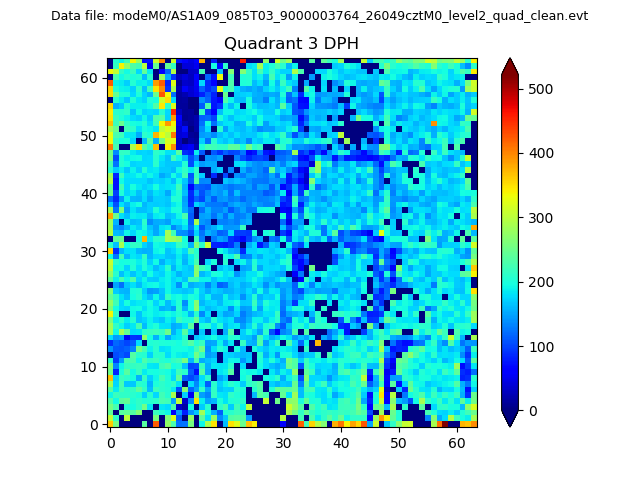 |
 |
Quadrant C |
| Plot type | Count rate plots | Images |
|---|---|---|
| Comparison with Poisson distribution Blue bars denote a histogram of data divided into 1 sec bins. Red curve is a Poisson curve with rate = median count rate of data. |
 |
 |
| Quadrant-wise count rates Data is divided into 100 sec bins |
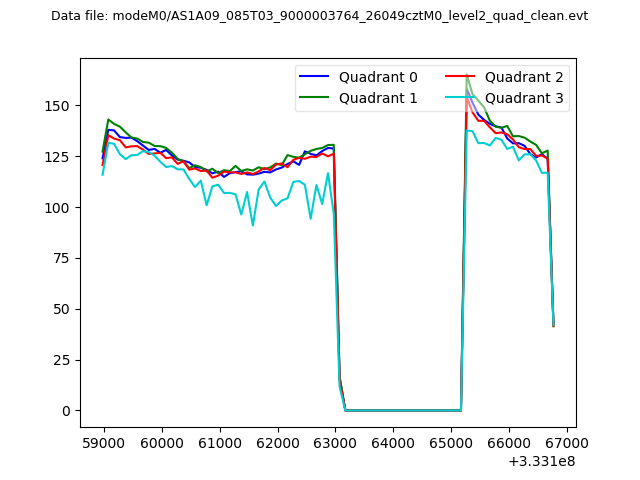 |
|
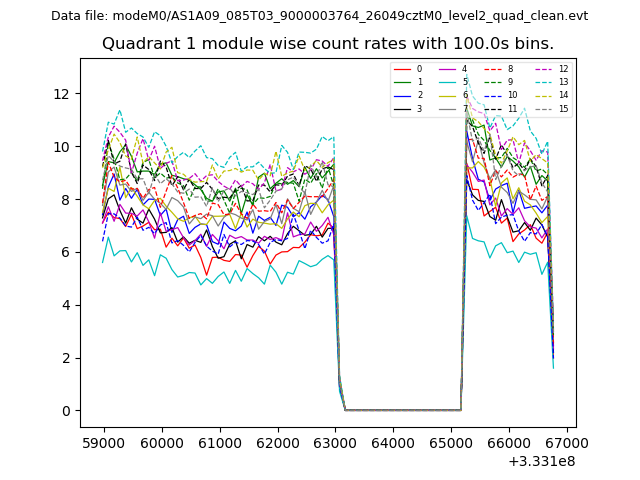
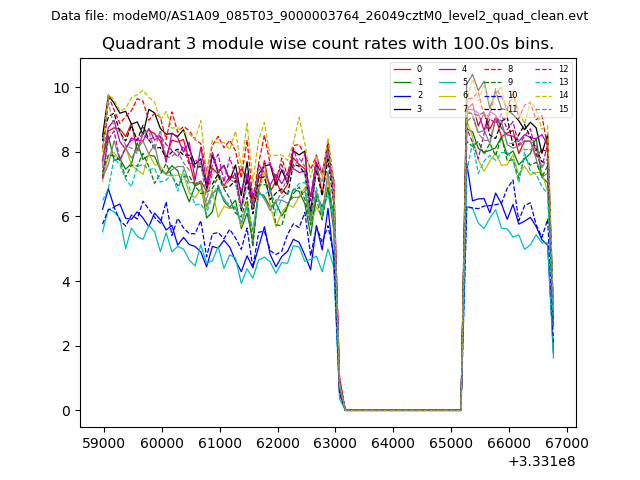
| Module-wise count rates for Quadrant A Data is divided into 100 sec bins |
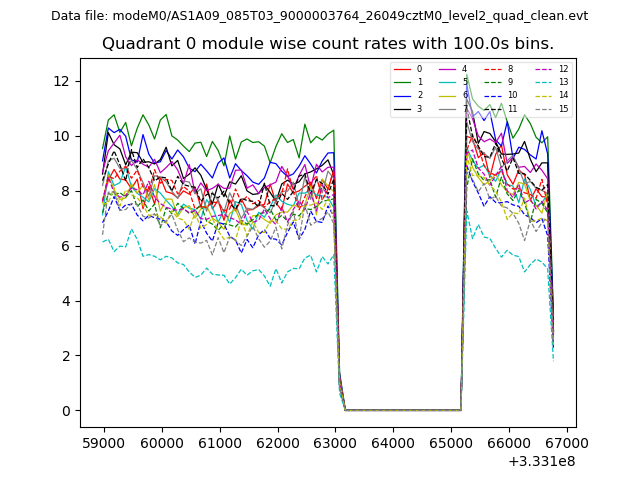 |
 |
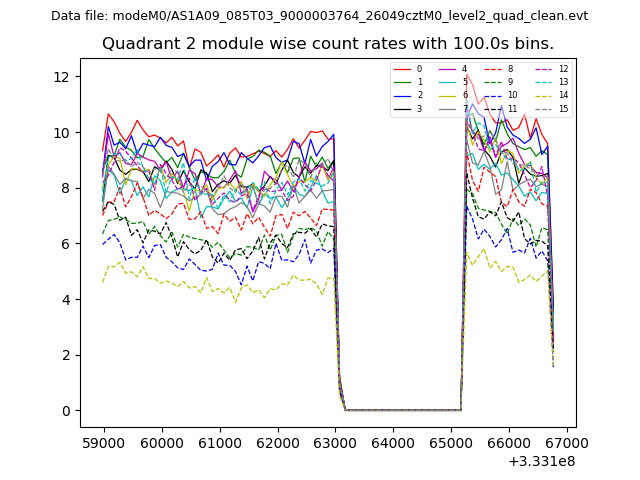
| Module-wise count rates for Quadrant B Data is divided into 100 sec bins |
 |
 |
| Module-wise count rates for Quadrant C Data is divided into 100 sec bins |
 |
 |
| Module-wise count rates for Quadrant D Data is divided into 100 sec bins |
 |
 |
| Parameter | Plot |
|---|---|
| CZT HV Monitor | 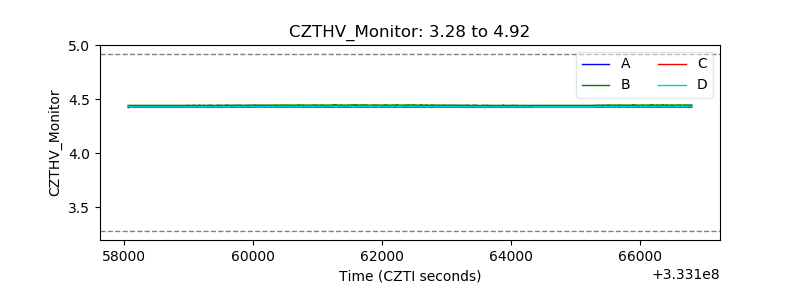 |
| D_VDD | 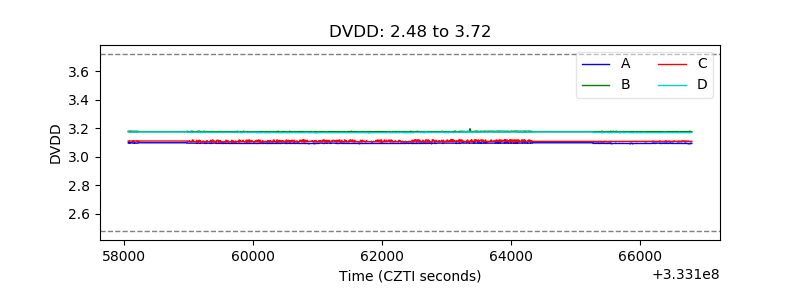 |
| Temperature 1 | 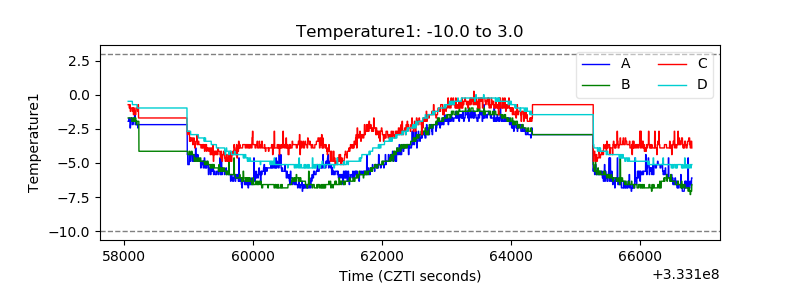 |
| Veto HV Monitor | 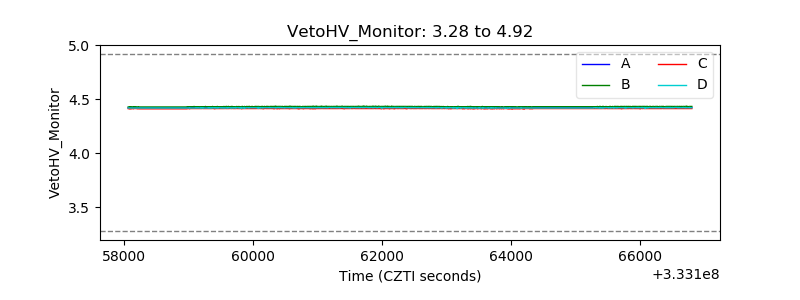 |
| Veto LLD | 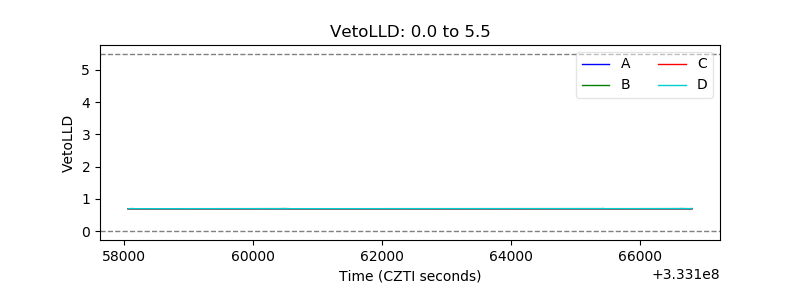 |
| Alpha Counter | 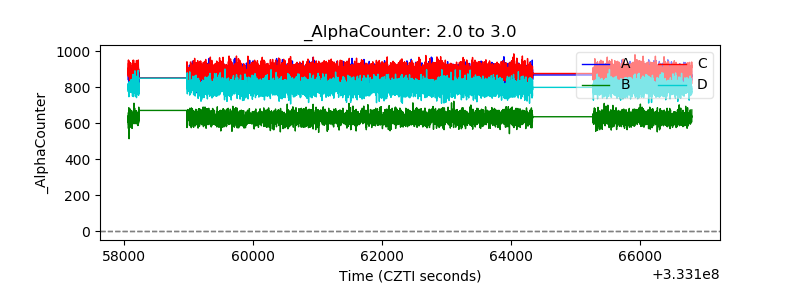 |
| _CPM_Rate | 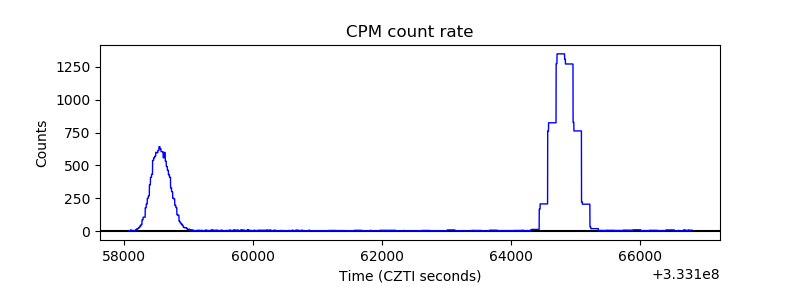 |
| CZT Counter | 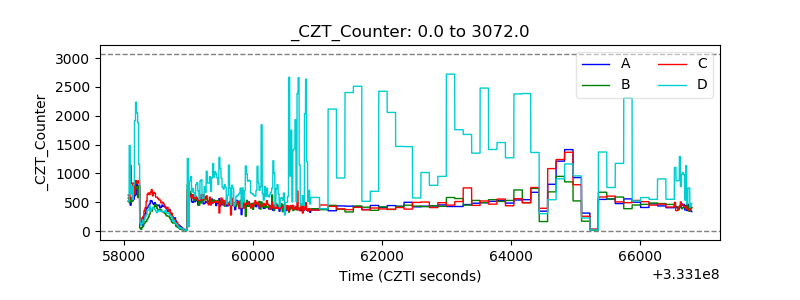 |
| +2.5 Volts monitor |  |
| +5 Volts monitor |  |
| _ROLL_ROT | 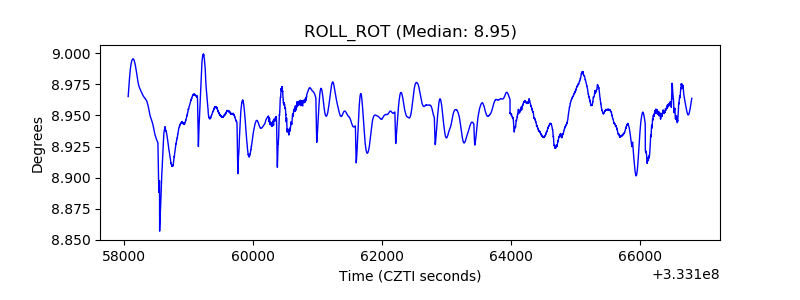 |
| _Roll_DEC | 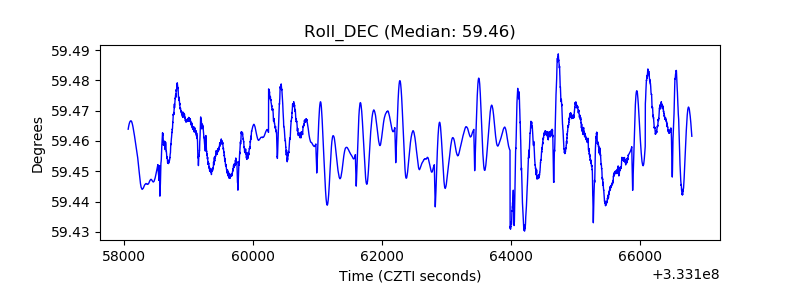 |
| _Roll_RA | 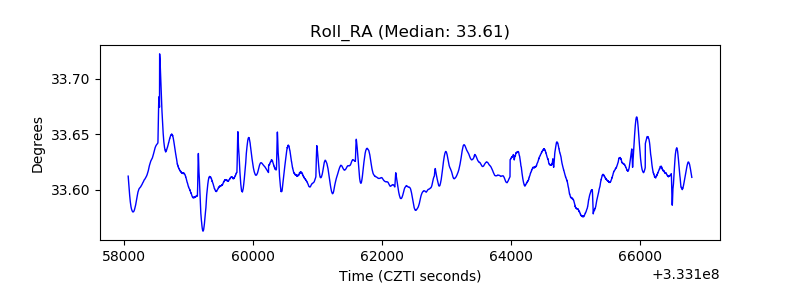 |
| Veto Counter | 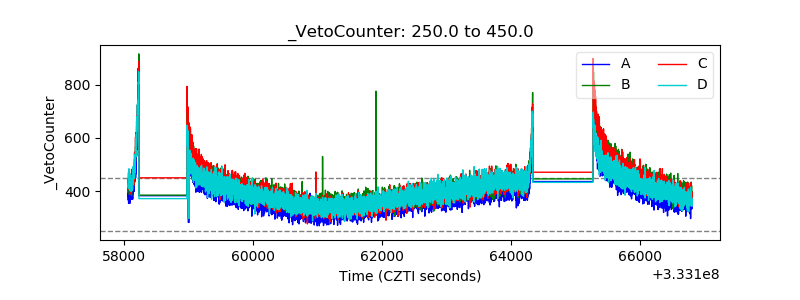 |