| Param | Original file | Final file |
|---|---|---|
| Filename | modeM0/AS1A09_085T03_9000003764_26050cztM0_level2.evt | modeM0/AS1A09_085T03_9000003764_26050cztM0_level2_quad_clean.evt |
| Size (bytes) | 545,898,240 | 93,038,400 |
| Size | 520.6 MB | 88.7 MB |
| Events in quadrant A | 2,948,089 | 624,569 |
| Events in quadrant B | 2,849,294 | 638,710 |
| Events in quadrant C | 2,805,371 | 619,181 |
| Events in quadrant D | 7,521,318 | 513,932 |
| Mode M0 | |||
|---|---|---|---|
| Quadrant | BADHDUFLAG | Total packets | Discarded packets |
| A | 0 | 12677 | 0 |
| B | 0 | 12447 | 0 |
| C | 0 | 12354 | 0 |
| D | 0 | 26494 | 0 |
| Mode M9 | |||
|---|---|---|---|
| Quadrant | BADHDUFLAG | Total packets | Discarded packets |
| A | 0 | 10 | 0 |
| B | 0 | 10 | 0 |
| C | 0 | 10 | 0 |
| D | 0 | 10 | 0 |
| Quadrant | Total seconds | Saturated seconds | Saturation percentage |
|---|---|---|---|
| A | 6019 | 23 | 0.382123% |
| B | 6020 | 32 | 0.531561% |
| C | 6020 | 62 | 1.029900% |
| D | 6020 | 1305 | 21.677741% |
Noise dominated data is calculated using 1-second bins in cleaned event files. If a bin has >2000 counts, and if more than 50% of those come from <1% of pixels, then it is considered to be noise-dominated and hence unusable.
| Quadrant | # 1 sec bins | Bins with >0 counts | Bins with >2000 counts | High rate bins dominated by noise | Noise dominated (total time) | Noise dominated (detector-on time) | Marked lightcurve |
|---|---|---|---|---|---|---|---|
| A | 7104 | 6019 | 4 | 4 | 0.06% | 0.07% | 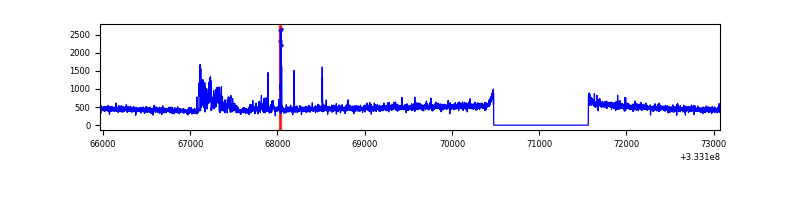 |
| B | 7105 | 6020 | 2 | 2 | 0.03% | 0.03% | 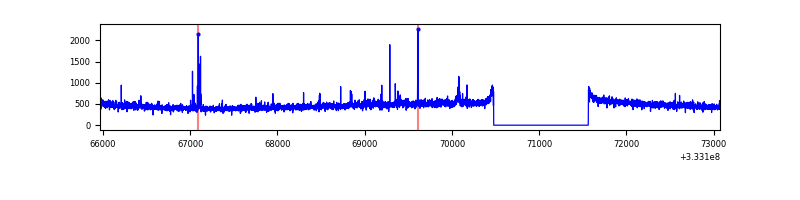 |
| C | 7105 | 6021 | 0 | 0 | 0.00% | 0.00% | 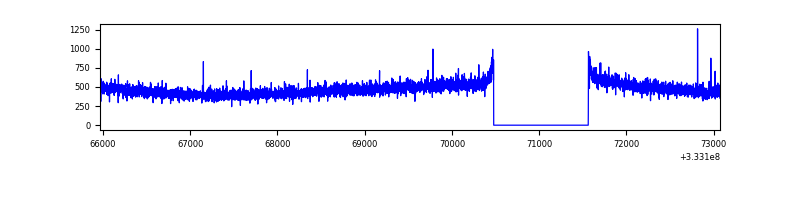 |
| D | 7105 | 6021 | 1313 | 1313 | 18.48% | 21.81% | 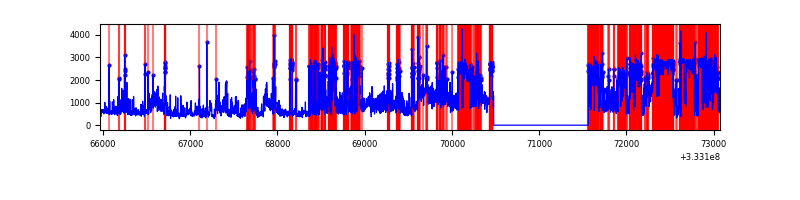 |
Top three noisy pixels from each quadrant. If the there are fewer than three noisy pixels in the level2.evt file, extra rows are filled as -1
| Pixel properties | Quadrant properties | ||||||
|---|---|---|---|---|---|---|---|
| Quadrant | DetID | PixID | Counts | Sigma | Mean | Median | Sigma |
| A | 4 | 2 | 159807 | 1110.91 | 715 | 701 | 143.2 |
| A | 0 | 13 | 30180 | 205.83 | 715 | 701 | 143.2 |
| A | 13 | 254 | 9224 | 59.51 | 715 | 701 | 143.2 |
| B | 0 | 229 | 30399 | 221.08 | 713 | 696 | 134.4 |
| B | 0 | 190 | 18168 | 130.05 | 713 | 696 | 134.4 |
| B | 12 | 111 | 16336 | 116.41 | 713 | 696 | 134.4 |
| C | 14 | 238 | 111716 | 699.65 | 685 | 686 | 158.7 |
| C | 3 | 233 | 17139 | 103.68 | 685 | 686 | 158.7 |
| C | 13 | 61 | 4923 | 26.7 | 685 | 686 | 158.7 |
| D | 1 | 52 | 3197486 | 20083.96 | 607 | 594 | 159.2 |
| D | 1 | 3 | 1522731 | 9562.58 | 607 | 594 | 159.2 |
| D | 13 | 168 | 363999 | 2283.03 | 607 | 594 | 159.2 |
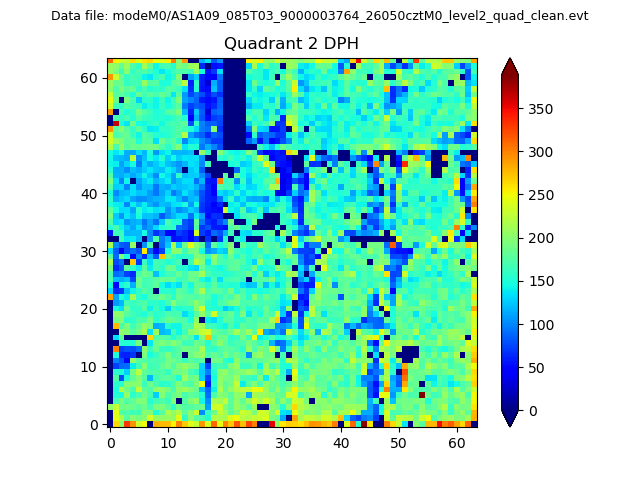
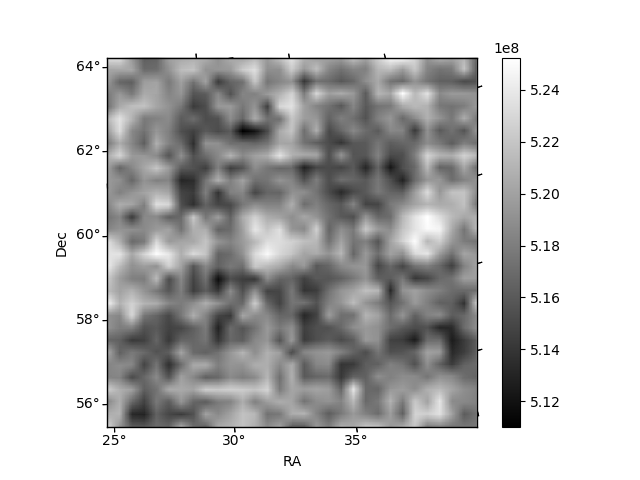
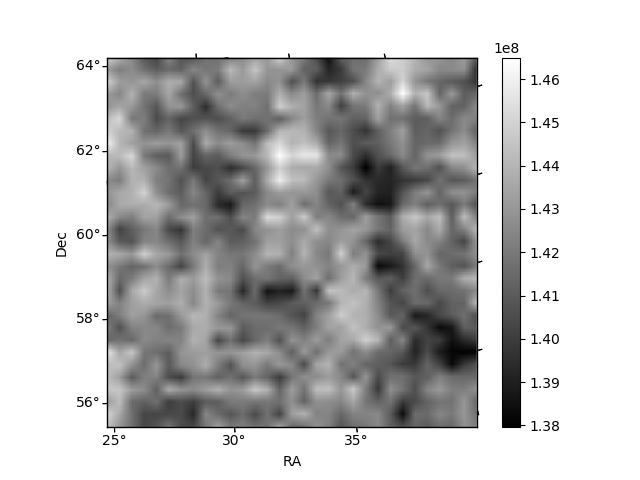
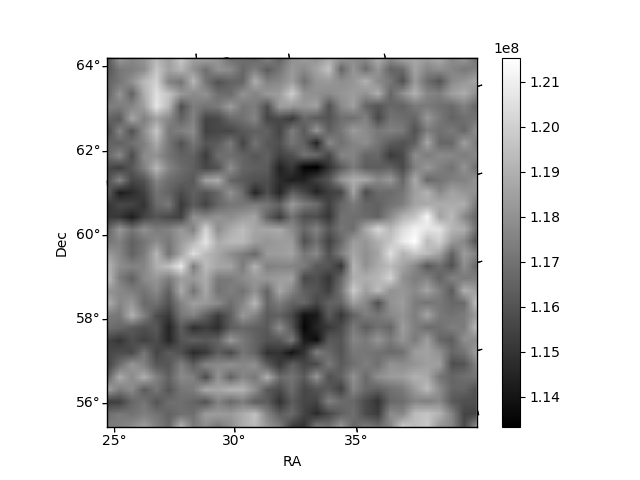
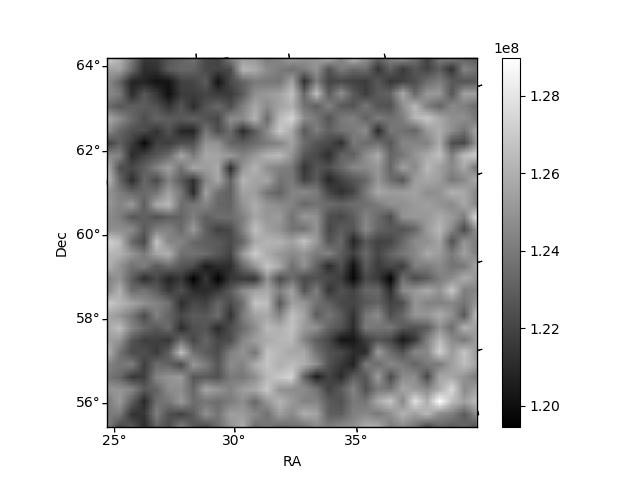
Histogram calculated using DETX and DETY for each event in the final _common_clean file
| Quadrant A | 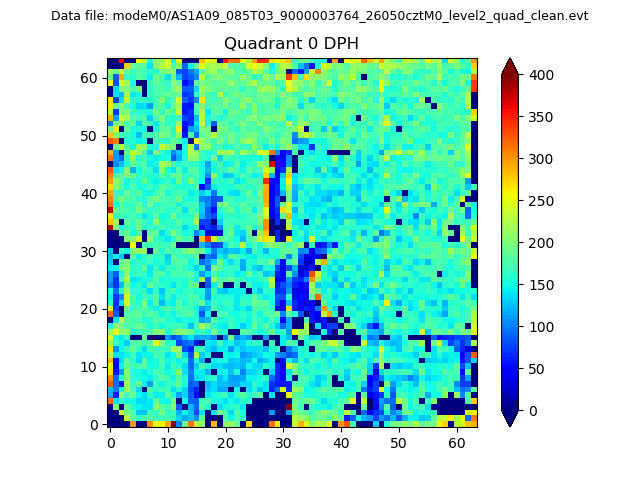 |
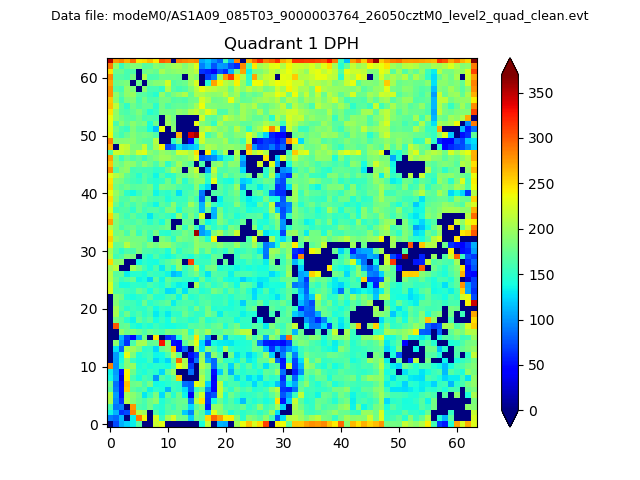 |
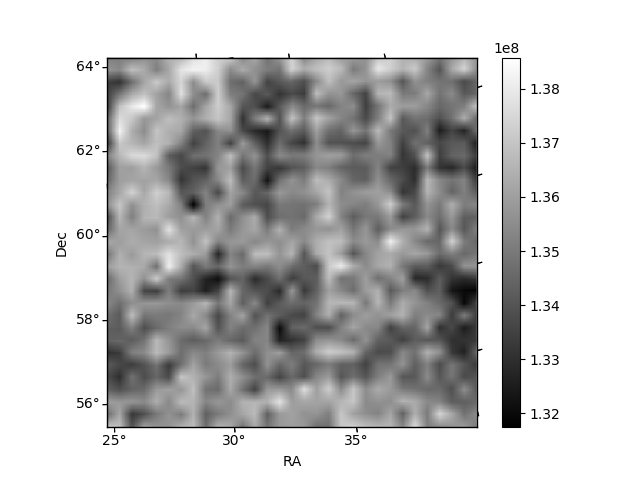
Quadrant B |
|---|---|---|---|
| Quadrant D | 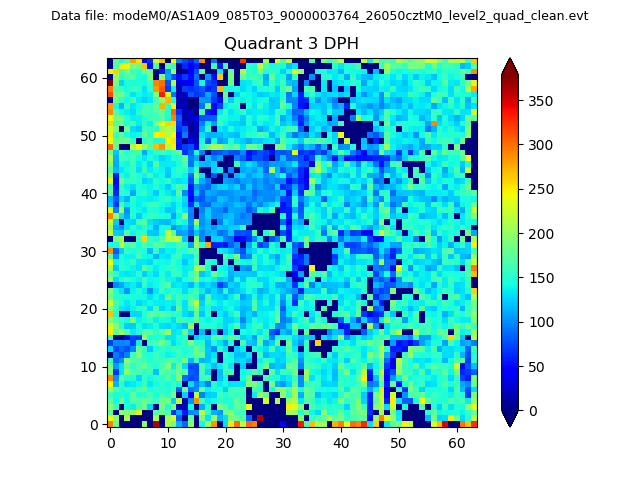 |
 |
Quadrant C |
| Plot type | Count rate plots | Images |
|---|---|---|
| Comparison with Poisson distribution Blue bars denote a histogram of data divided into 1 sec bins. Red curve is a Poisson curve with rate = median count rate of data. |
 |
 |
| Quadrant-wise count rates Data is divided into 100 sec bins |
 |
|
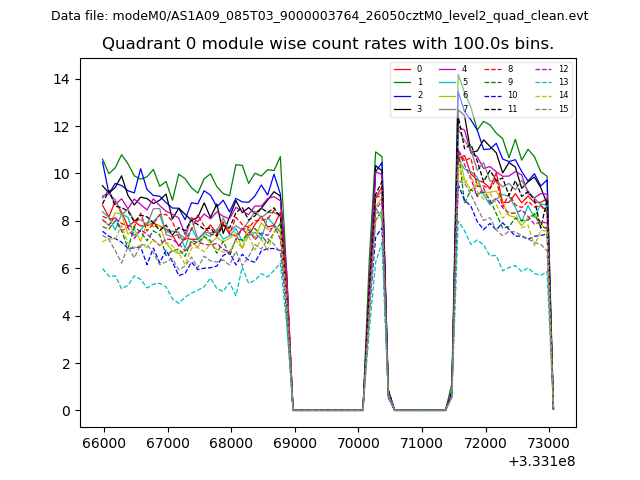
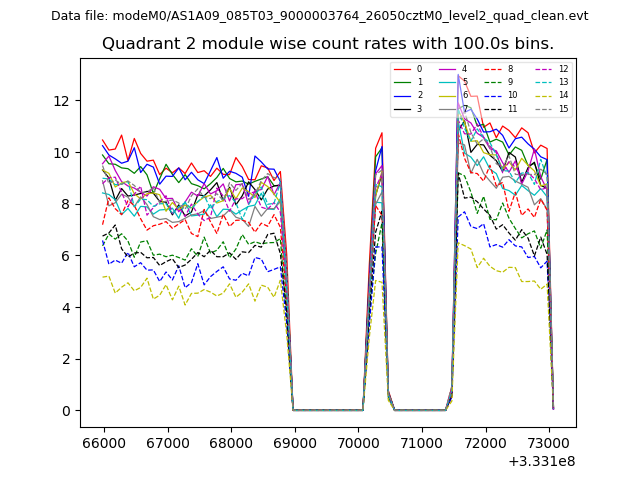
| Module-wise count rates for Quadrant A Data is divided into 100 sec bins |
 |
 |
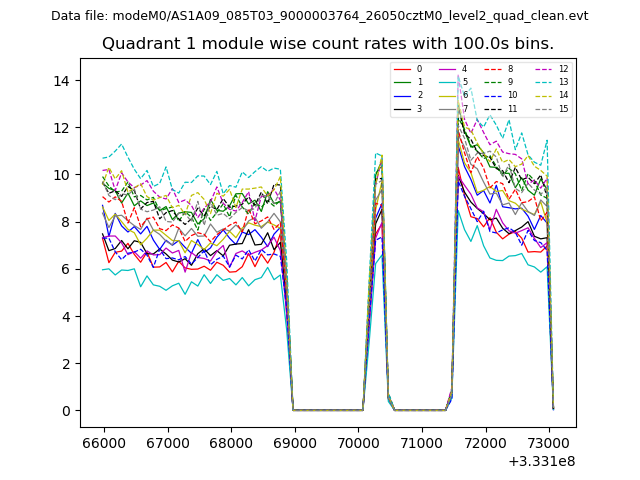
| Module-wise count rates for Quadrant B Data is divided into 100 sec bins |
 |
 |
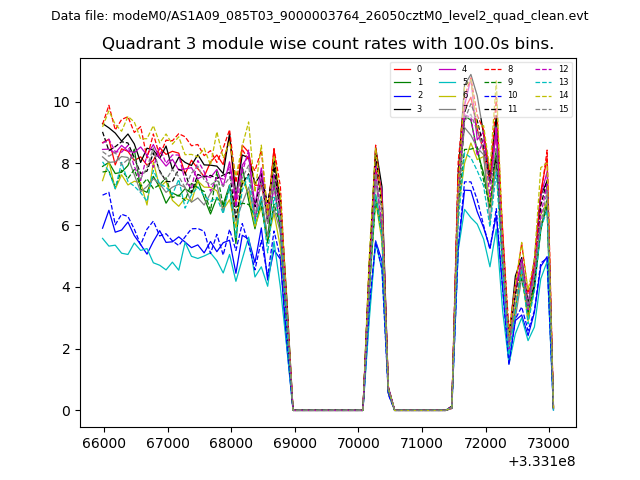
| Module-wise count rates for Quadrant C Data is divided into 100 sec bins |
 |
 |
| Module-wise count rates for Quadrant D Data is divided into 100 sec bins |
 |
 |
| Parameter | Plot |
|---|---|
| CZT HV Monitor | 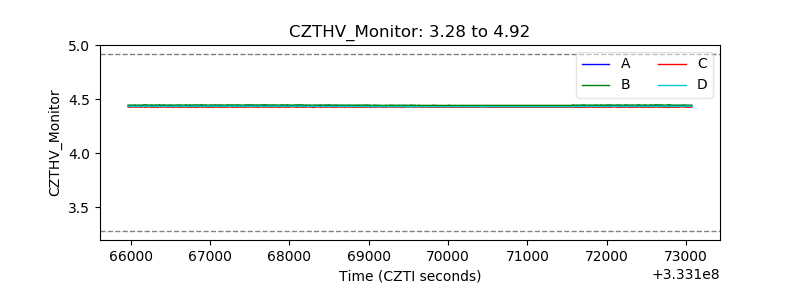 |
| D_VDD | 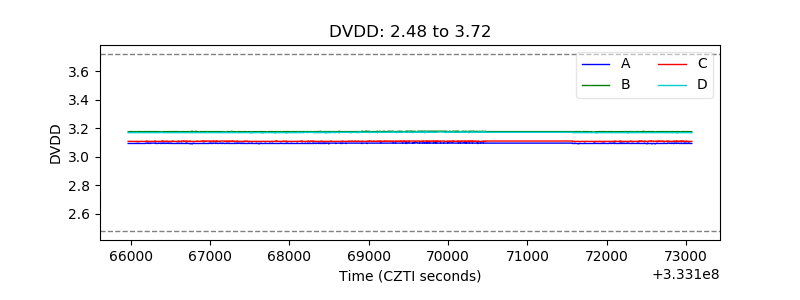 |
| Temperature 1 | 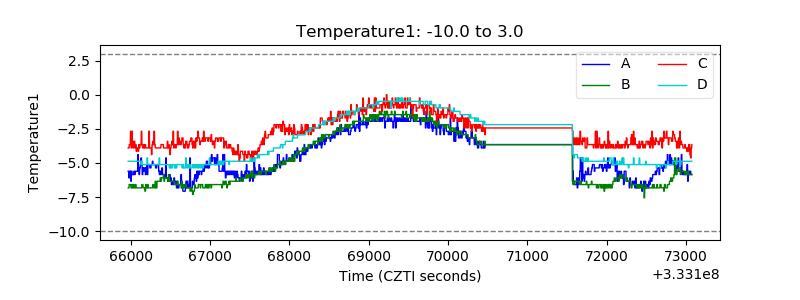 |
| Veto HV Monitor | 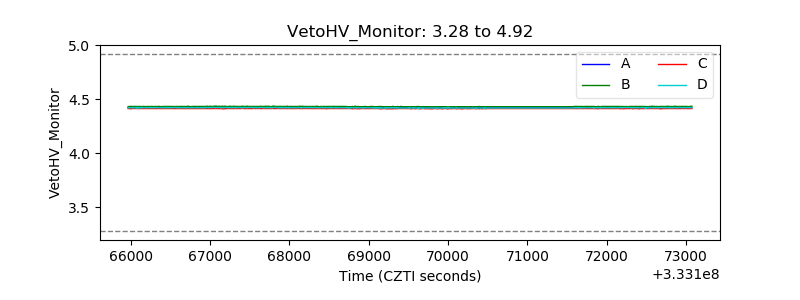 |
| Veto LLD | 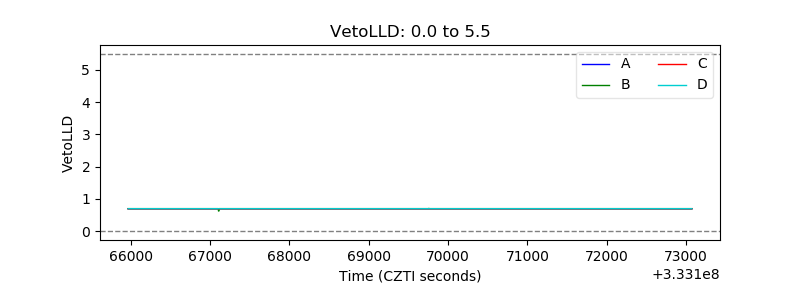 |
| Alpha Counter |  |
| _CPM_Rate | 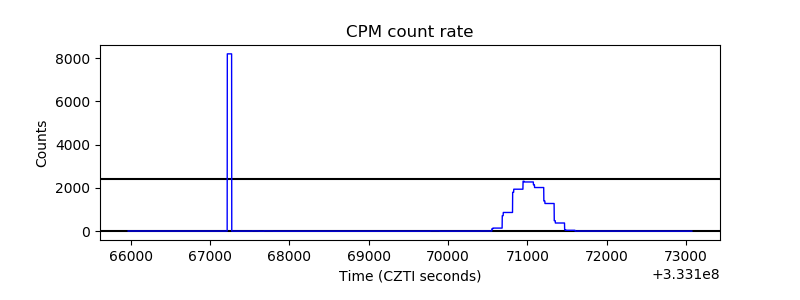 |
| CZT Counter | 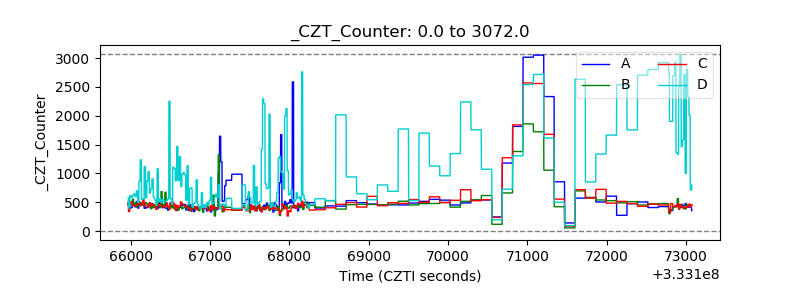 |
| +2.5 Volts monitor |  |
| +5 Volts monitor |  |
| _ROLL_ROT | 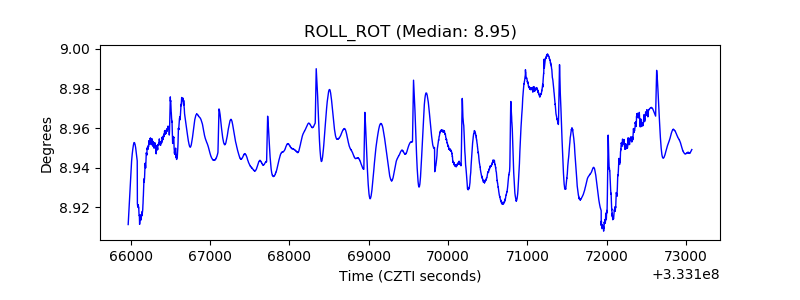 |
| _Roll_DEC | 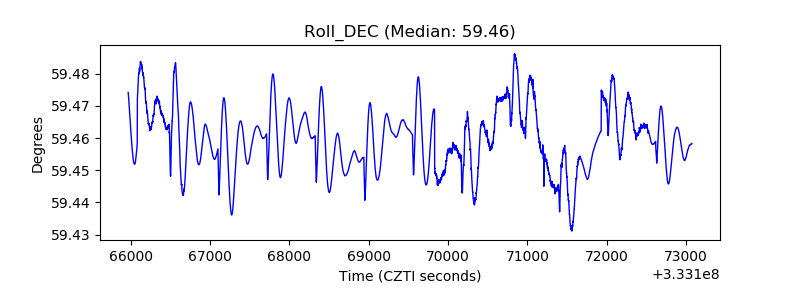 |
| _Roll_RA | 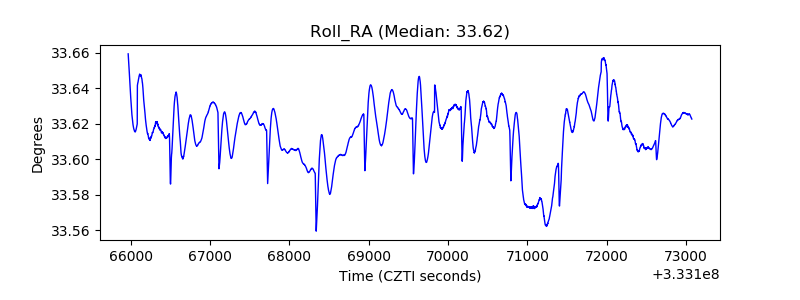 |
| Veto Counter | 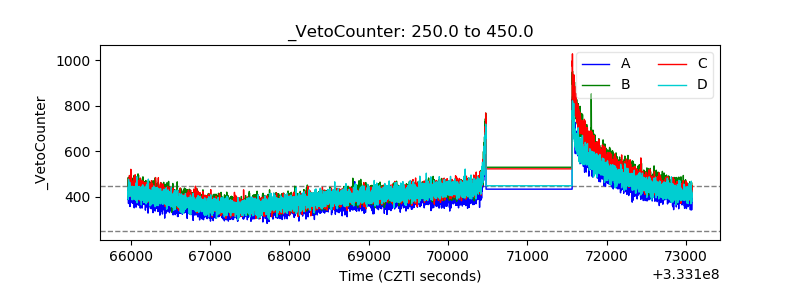 |