| Param | Original file | Final file |
|---|---|---|
| Filename | modeM0/AS1A09_085T03_9000003764_26052cztM0_level2.evt | modeM0/AS1A09_085T03_9000003764_26052cztM0_level2_quad_clean.evt |
| Size (bytes) | 690,932,160 | 88,303,680 |
| Size | 658.9 MB | 84.2 MB |
| Events in quadrant A | 2,989,677 | 644,347 |
| Events in quadrant B | 2,824,653 | 661,099 |
| Events in quadrant C | 2,820,863 | 630,628 |
| Events in quadrant D | 11,894,833 | 328,954 |
| Mode M0 | |||
|---|---|---|---|
| Quadrant | BADHDUFLAG | Total packets | Discarded packets |
| A | 0 | 12576 | 0 |
| B | 0 | 12077 | 0 |
| C | 0 | 12099 | 0 |
| D | 0 | 39323 | 0 |
| Mode M9 | |||
|---|---|---|---|
| Quadrant | BADHDUFLAG | Total packets | Discarded packets |
| A | 0 | 12 | 0 |
| B | 0 | 12 | 0 |
| C | 0 | 12 | 0 |
| D | 0 | 12 | 0 |
| Quadrant | Total seconds | Saturated seconds | Saturation percentage |
|---|---|---|---|
| A | 5829 | 44 | 0.754846% |
| B | 5830 | 16 | 0.274443% |
| C | 5830 | 41 | 0.703259% |
| D | 5829 | 3545 | 60.816607% |
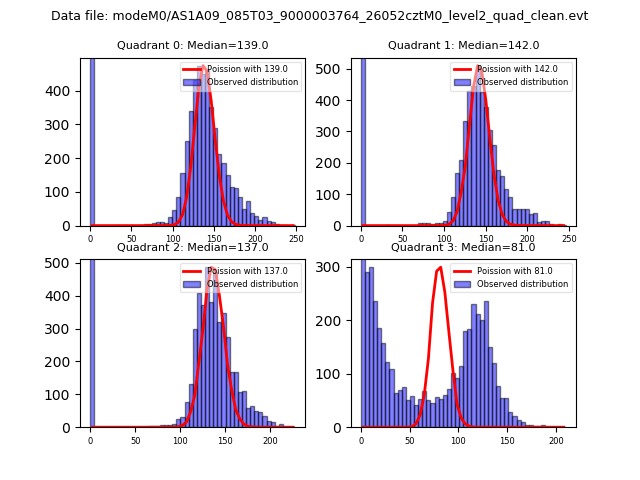
Noise dominated data is calculated using 1-second bins in cleaned event files. If a bin has >2000 counts, and if more than 50% of those come from <1% of pixels, then it is considered to be noise-dominated and hence unusable.
| Quadrant | # 1 sec bins | Bins with >0 counts | Bins with >2000 counts | High rate bins dominated by noise | Noise dominated (total time) | Noise dominated (detector-on time) | Marked lightcurve |
|---|---|---|---|---|---|---|---|
| A | 7039 | 5829 | 25 | 25 | 0.36% | 0.43% | 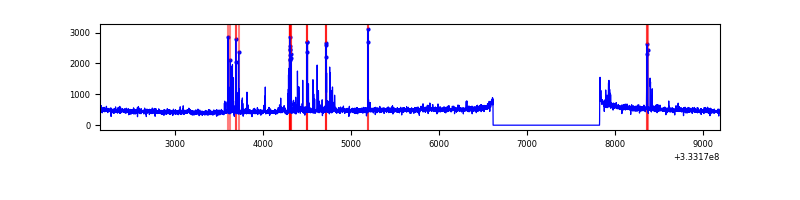 |
| B | 7040 | 5831 | 0 | 0 | 0.00% | 0.00% | 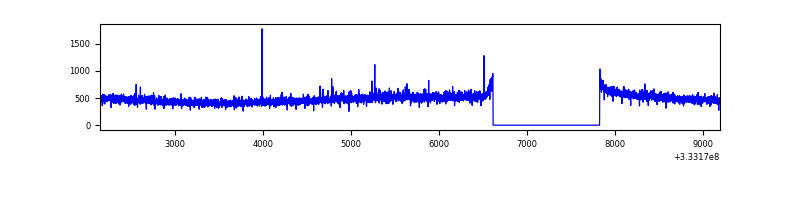 |
| C | 7040 | 5831 | 0 | 0 | 0.00% | 0.00% | 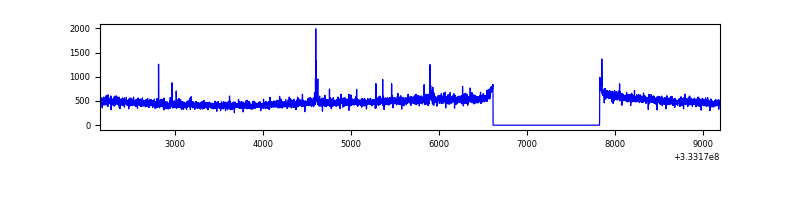 |
| D | 7038 | 5829 | 3587 | 3587 | 50.97% | 61.54% | 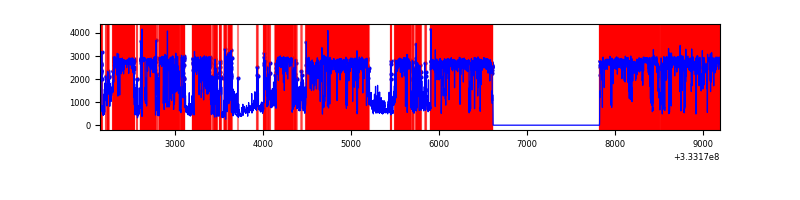 |
Top three noisy pixels from each quadrant. If the there are fewer than three noisy pixels in the level2.evt file, extra rows are filled as -1
| Pixel properties | Quadrant properties | ||||||
|---|---|---|---|---|---|---|---|
| Quadrant | DetID | PixID | Counts | Sigma | Mean | Median | Sigma |
| A | 0 | 13 | 220887 | 1545.0 | 717 | 705 | 142.5 |
| A | 13 | 254 | 8872 | 57.31 | 717 | 705 | 142.5 |
| A | 3 | 137 | 6177 | 38.4 | 717 | 705 | 142.5 |
| B | 12 | 111 | 15755 | 112.6 | 713 | 696 | 133.7 |
| B | 0 | 190 | 15336 | 109.46 | 713 | 696 | 133.7 |
| B | 11 | 111 | 14068 | 99.98 | 713 | 696 | 133.7 |
| C | 14 | 238 | 111762 | 707.78 | 683 | 688 | 156.9 |
| C | 3 | 233 | 46076 | 289.22 | 683 | 688 | 156.9 |
| C | 13 | 61 | 4831 | 26.4 | 683 | 688 | 156.9 |
| D | 1 | 52 | 7960738 | 76360.17 | 407 | 397 | 104.2 |
| D | 1 | 3 | 1437807 | 13788.46 | 407 | 397 | 104.2 |
| D | 12 | 2 | 812484 | 7790.01 | 407 | 397 | 104.2 |
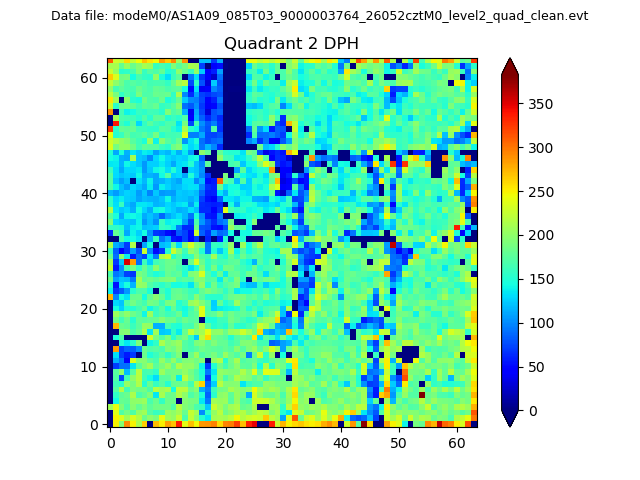
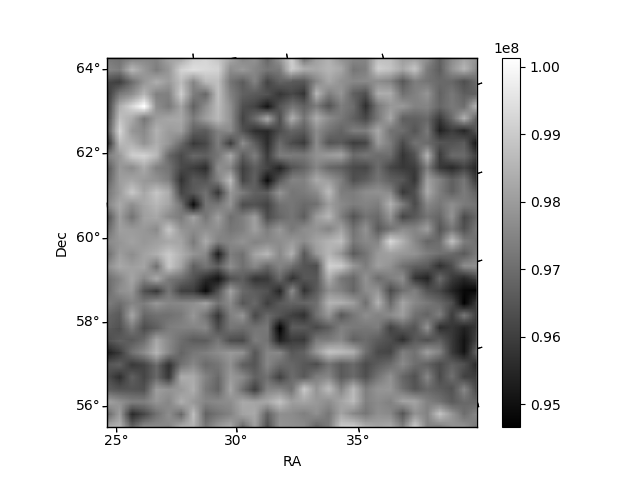
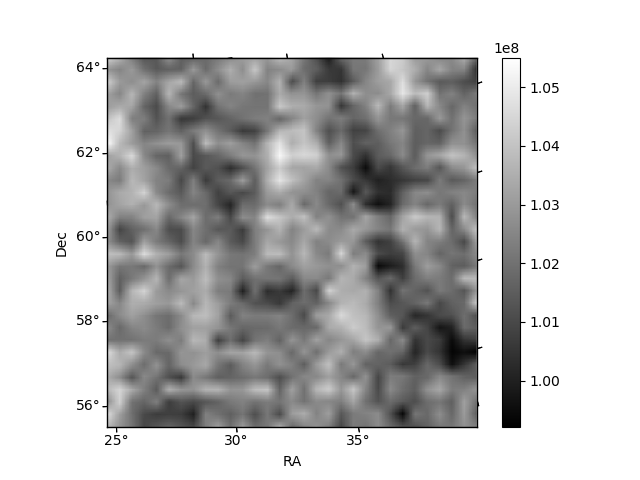
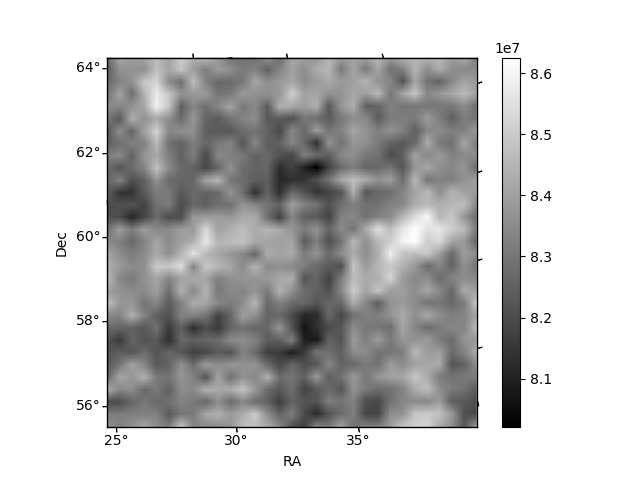
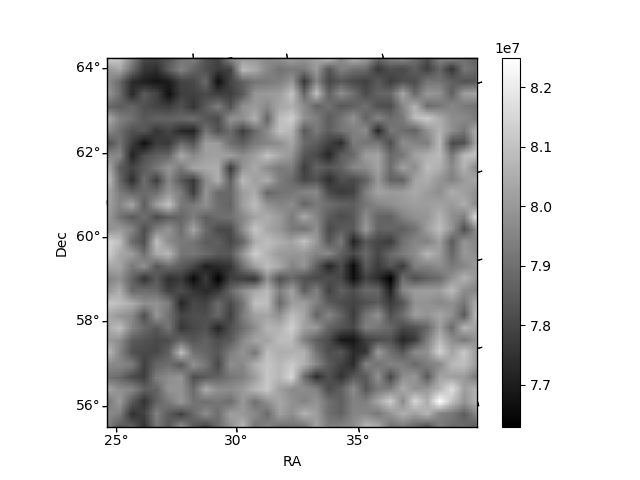
Histogram calculated using DETX and DETY for each event in the final _common_clean file
| Quadrant A | 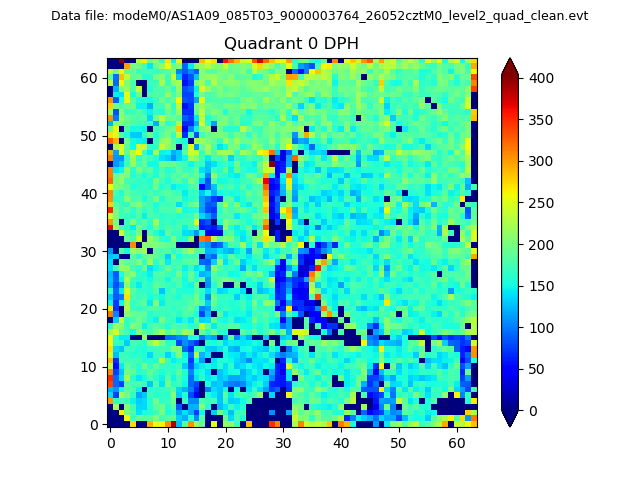 |
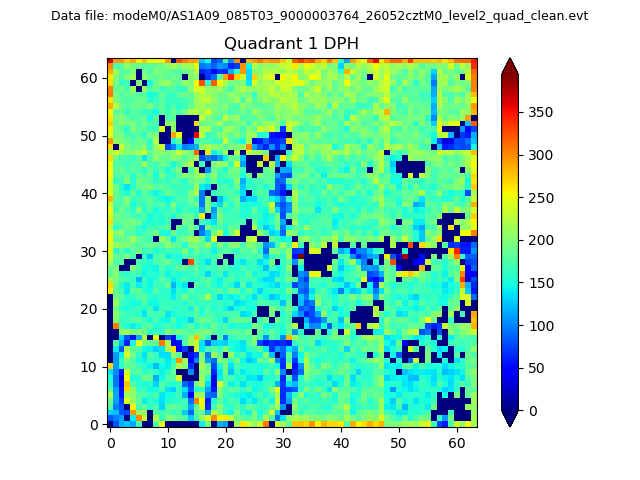 |
Quadrant B |
|---|---|---|---|
| Quadrant D | 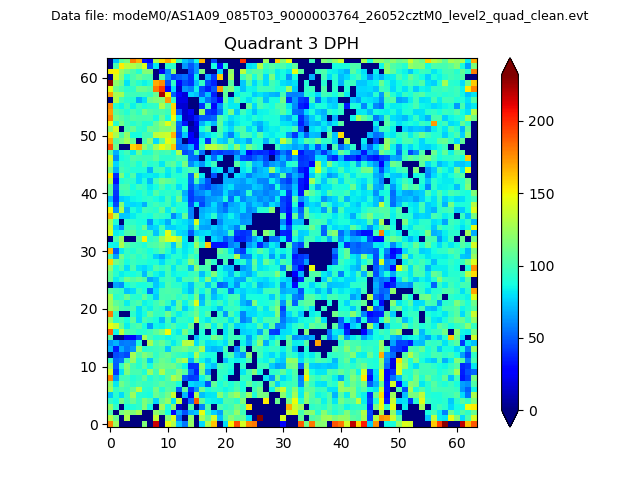 |
 |
Quadrant C |
| Plot type | Count rate plots | Images |
|---|---|---|
| Comparison with Poisson distribution Blue bars denote a histogram of data divided into 1 sec bins. Red curve is a Poisson curve with rate = median count rate of data. |
 |
 |
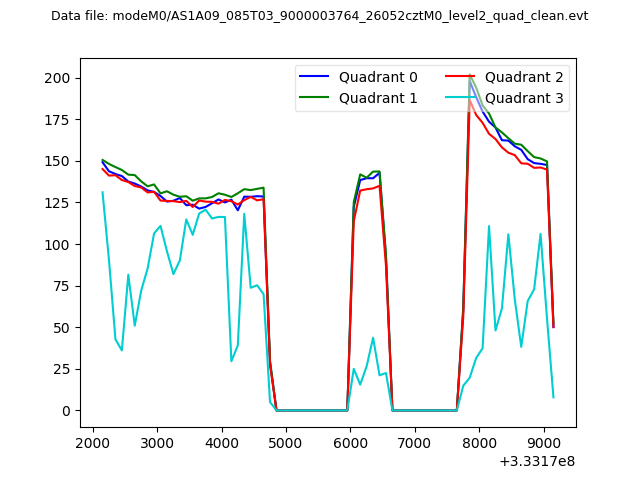
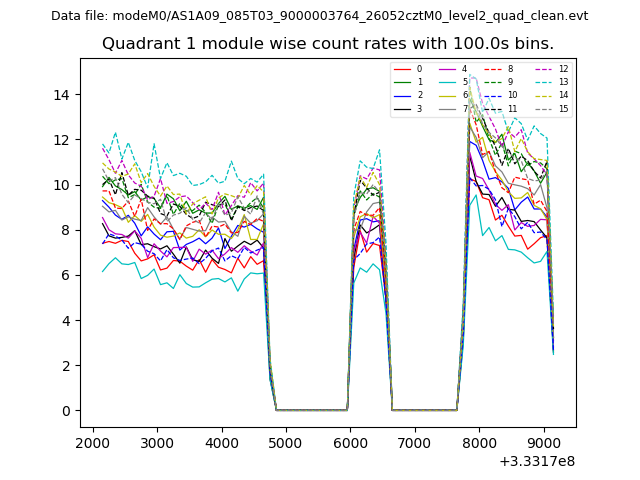
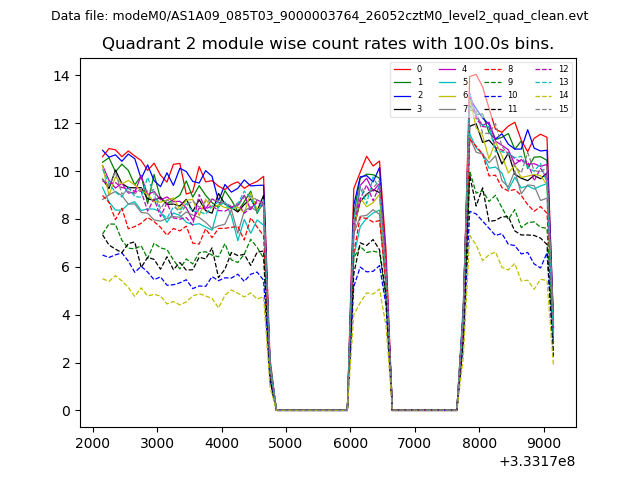
| Quadrant-wise count rates Data is divided into 100 sec bins |
 |
|
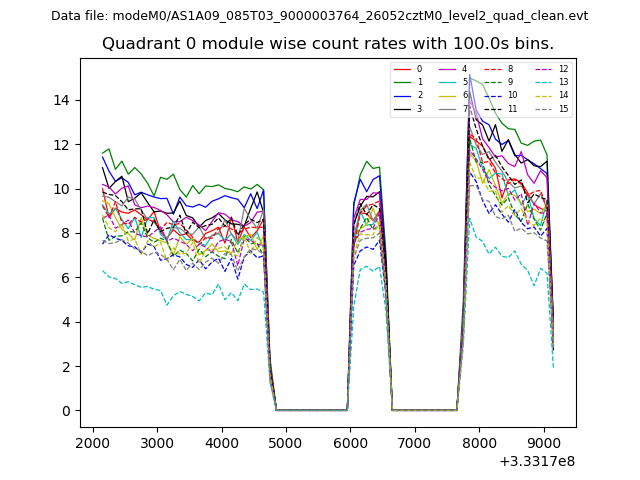
| Module-wise count rates for Quadrant A Data is divided into 100 sec bins |
 |
 |
| Module-wise count rates for Quadrant B Data is divided into 100 sec bins |
 |
 |
| Module-wise count rates for Quadrant C Data is divided into 100 sec bins |
 |
 |
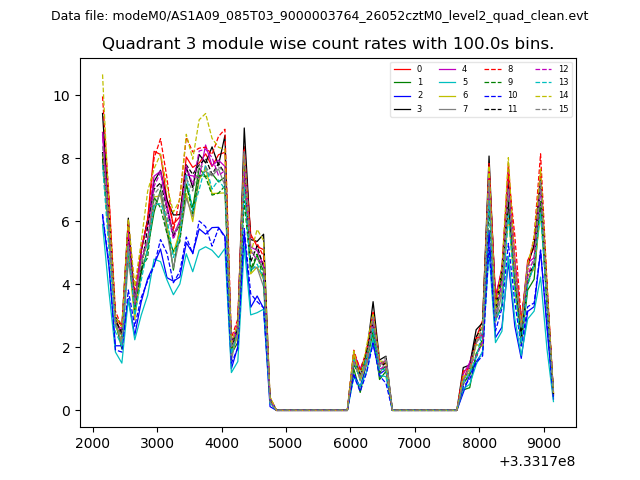
| Module-wise count rates for Quadrant D Data is divided into 100 sec bins |
 |
 |
| Parameter | Plot |
|---|---|
| CZT HV Monitor | 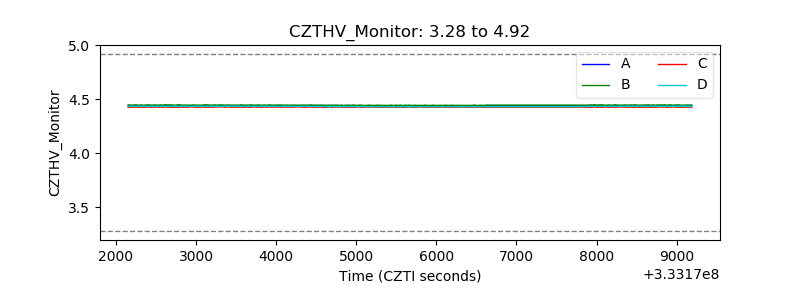 |
| D_VDD | 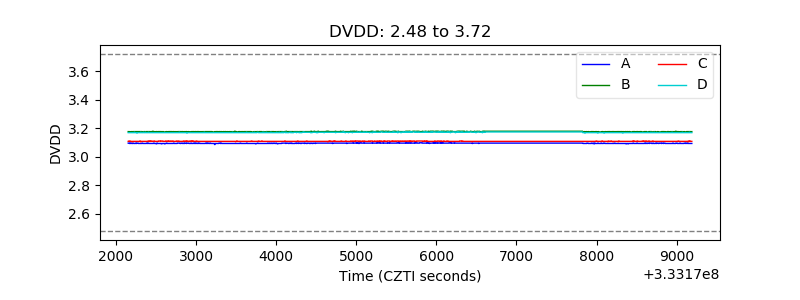 |
| Temperature 1 | 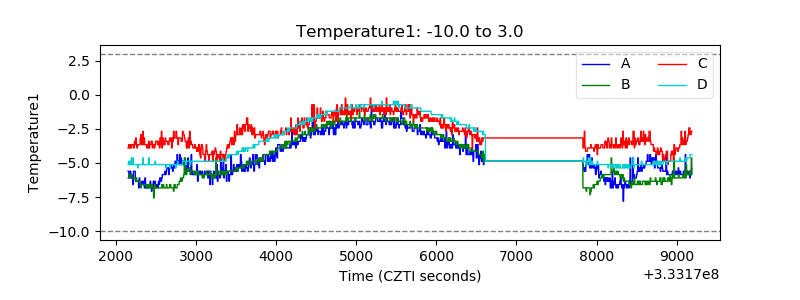 |
| Veto HV Monitor | 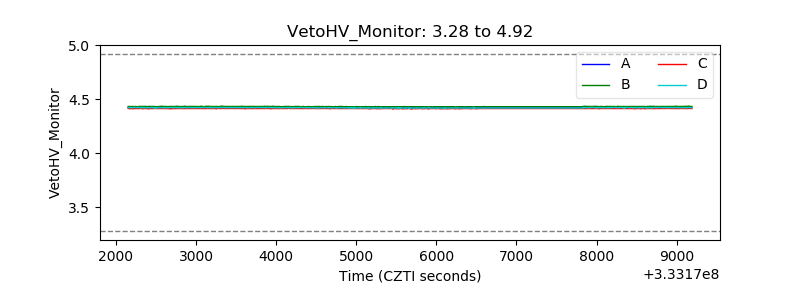 |
| Veto LLD | 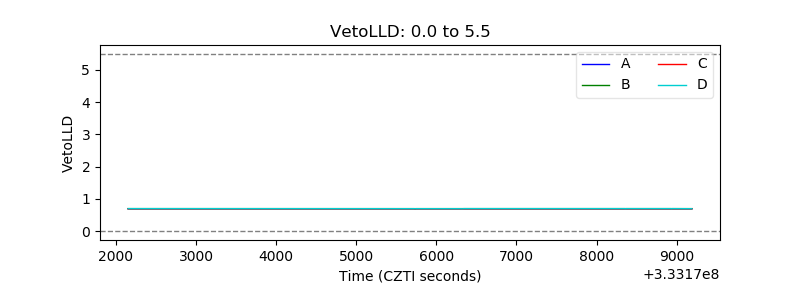 |
| Alpha Counter | 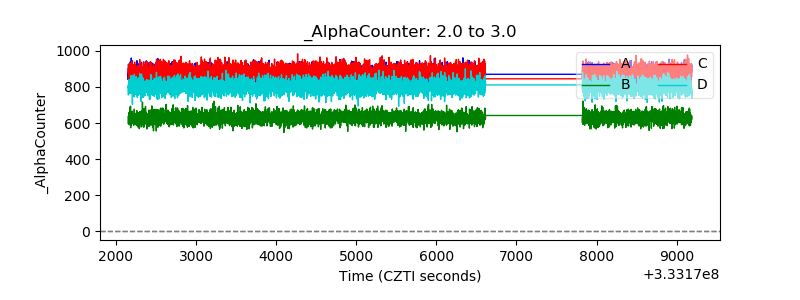 |
| _CPM_Rate | 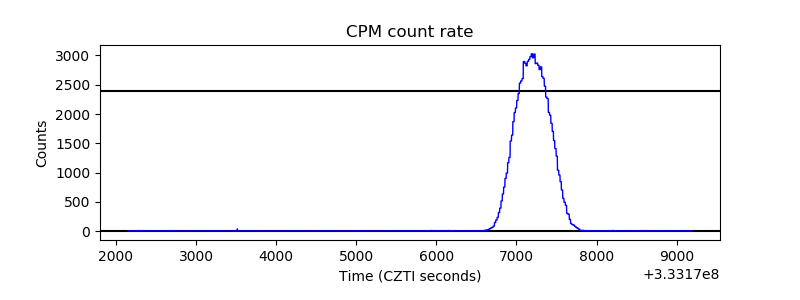 |
| CZT Counter | 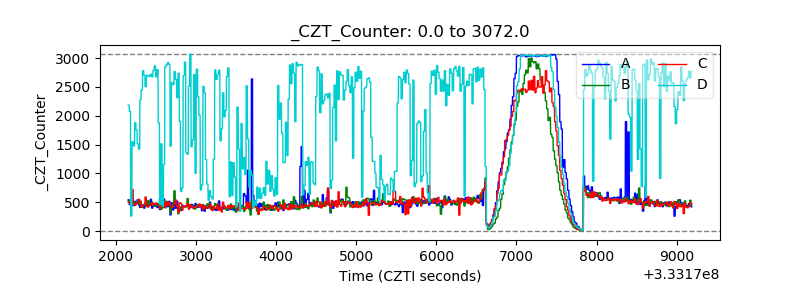 |
| +2.5 Volts monitor |  |
| +5 Volts monitor |  |
| _ROLL_ROT | 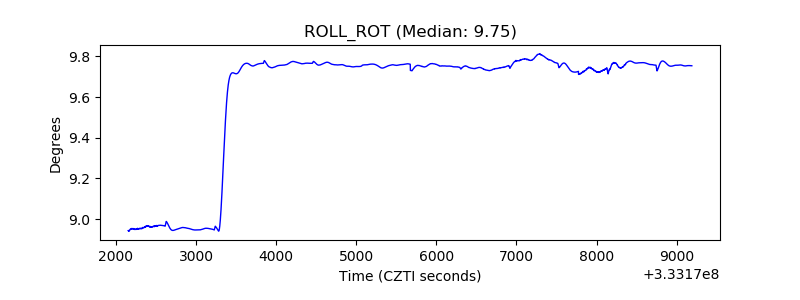 |
| _Roll_DEC | 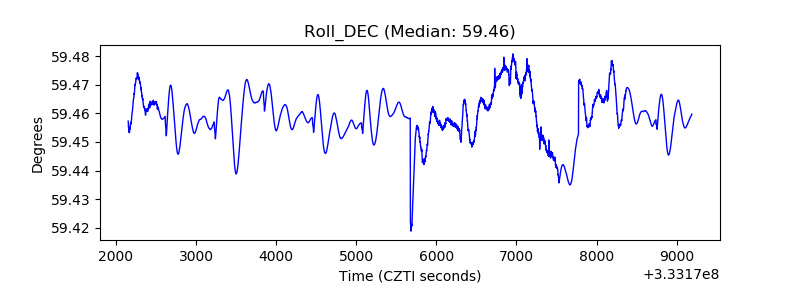 |
| _Roll_RA | 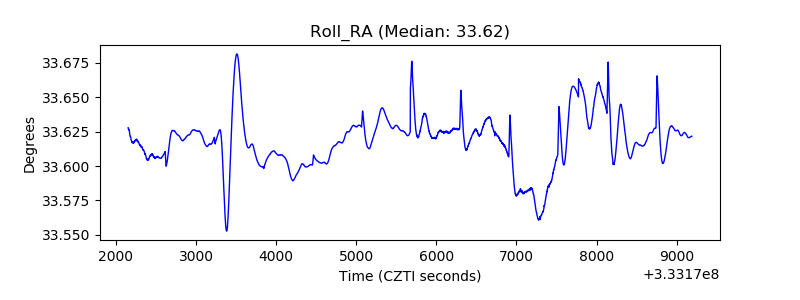 |
| Veto Counter | 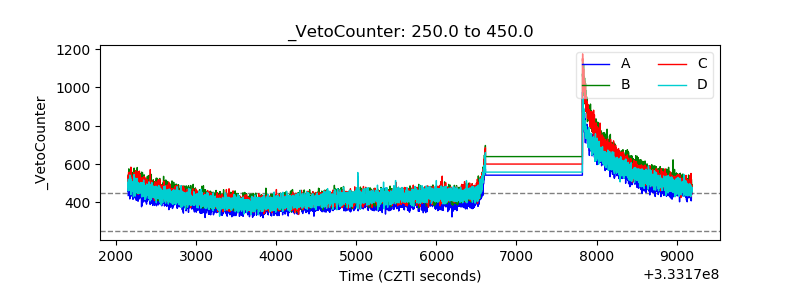 |