| Param | Original file | Final file |
|---|---|---|
| Filename | modeM0/AS1A09_085T03_9000003764_26053cztM0_level2.evt | modeM0/AS1A09_085T03_9000003764_26053cztM0_level2_quad_clean.evt |
| Size (bytes) | 691,320,960 | 96,721,920 |
| Size | 659.3 MB | 92.2 MB |
| Events in quadrant A | 3,026,913 | 725,599 |
| Events in quadrant B | 3,007,282 | 732,693 |
| Events in quadrant C | 2,982,903 | 693,356 |
| Events in quadrant D | 11,524,081 | 368,035 |
| Mode M0 | |||
|---|---|---|---|
| Quadrant | BADHDUFLAG | Total packets | Discarded packets |
| A | 0 | 12543 | 0 |
| B | 0 | 12459 | 0 |
| C | 0 | 12448 | 0 |
| D | 0 | 37923 | 0 |
| Mode M9 | |||
|---|---|---|---|
| Quadrant | BADHDUFLAG | Total packets | Discarded packets |
| A | 0 | 13 | 0 |
| B | 0 | 13 | 0 |
| C | 0 | 13 | 0 |
| D | 0 | 13 | 0 |
| Quadrant | Total seconds | Saturated seconds | Saturation percentage |
|---|---|---|---|
| A | 5925 | 19 | 0.320675% |
| B | 5907 | 28 | 0.474014% |
| C | 5927 | 49 | 0.826725% |
| D | 5517 | 3638 | 65.941635% |
Noise dominated data is calculated using 1-second bins in cleaned event files. If a bin has >2000 counts, and if more than 50% of those come from <1% of pixels, then it is considered to be noise-dominated and hence unusable.
| Quadrant | # 1 sec bins | Bins with >0 counts | Bins with >2000 counts | High rate bins dominated by noise | Noise dominated (total time) | Noise dominated (detector-on time) | Marked lightcurve |
|---|---|---|---|---|---|---|---|
| A | 7435 | 6097 | 3 | 3 | 0.04% | 0.05% | 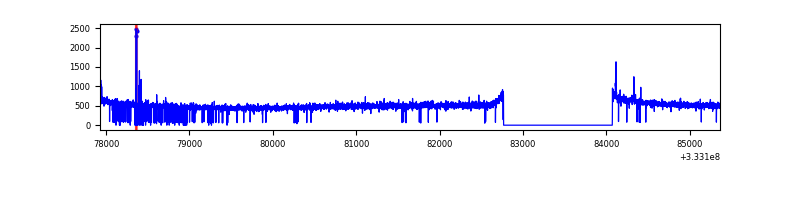 |
| B | 7436 | 6088 | 0 | 0 | 0.00% | 0.00% | 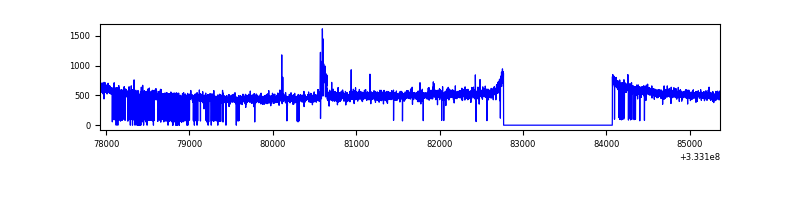 |
| C | 7436 | 6101 | 0 | 0 | 0.00% | 0.00% | 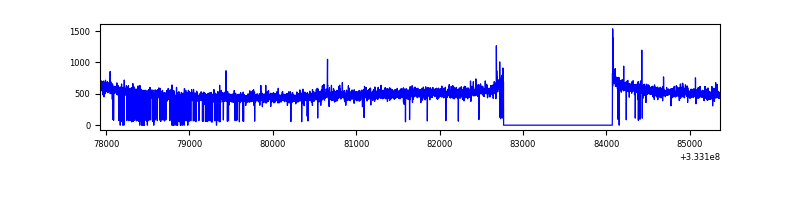 |
| D | 7436 | 5641 | 3597 | 3597 | 48.37% | 63.77% | 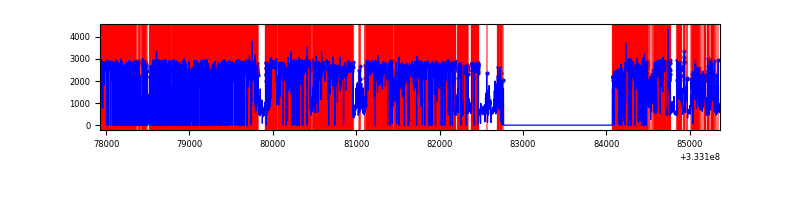 |
Top three noisy pixels from each quadrant. If the there are fewer than three noisy pixels in the level2.evt file, extra rows are filled as -1
| Pixel properties | Quadrant properties | ||||||
|---|---|---|---|---|---|---|---|
| Quadrant | DetID | PixID | Counts | Sigma | Mean | Median | Sigma |
| A | 0 | 13 | 29213 | 185.7 | 775 | 763 | 153.2 |
| A | 13 | 254 | 8628 | 51.34 | 775 | 763 | 153.2 |
| A | 8 | 255 | 8328 | 49.38 | 775 | 763 | 153.2 |
| B | 0 | 190 | 33211 | 231.68 | 759 | 744 | 140.1 |
| B | 12 | 111 | 16378 | 111.56 | 759 | 744 | 140.1 |
| B | 11 | 111 | 14479 | 98.01 | 759 | 744 | 140.1 |
| C | 14 | 238 | 119840 | 720.7 | 727 | 731 | 165.3 |
| C | 3 | 233 | 24317 | 142.71 | 727 | 731 | 165.3 |
| C | 13 | 250 | 5378 | 28.12 | 727 | 731 | 165.3 |
| D | 1 | 52 | 8286487 | 75817.37 | 436 | 424 | 109.3 |
| D | 12 | 2 | 848753 | 7762.2 | 436 | 424 | 109.3 |
| D | 1 | 3 | 679686 | 6215.24 | 436 | 424 | 109.3 |
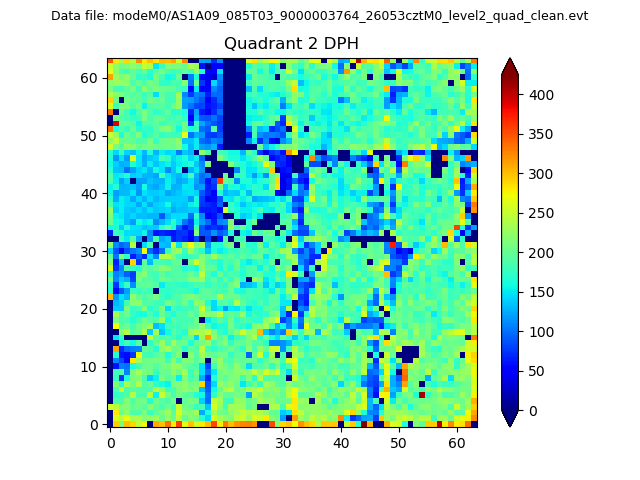
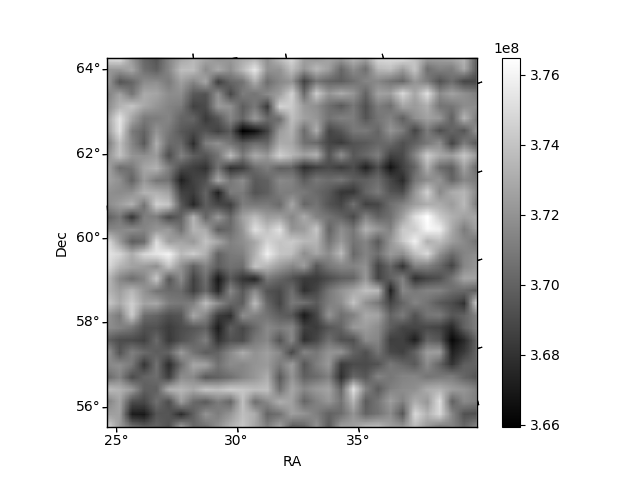
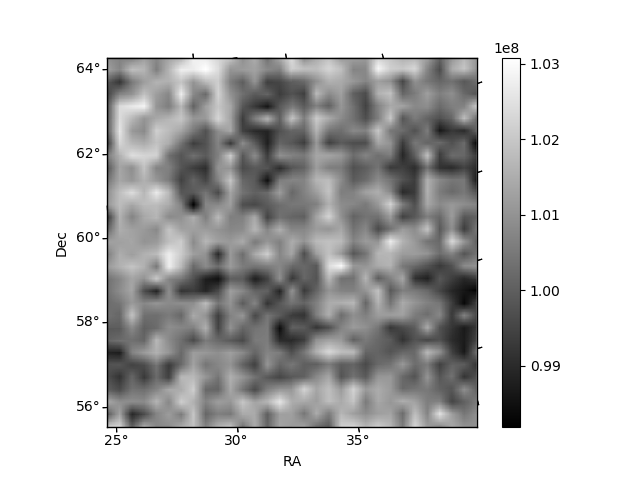
Histogram calculated using DETX and DETY for each event in the final _common_clean file
| Quadrant A | 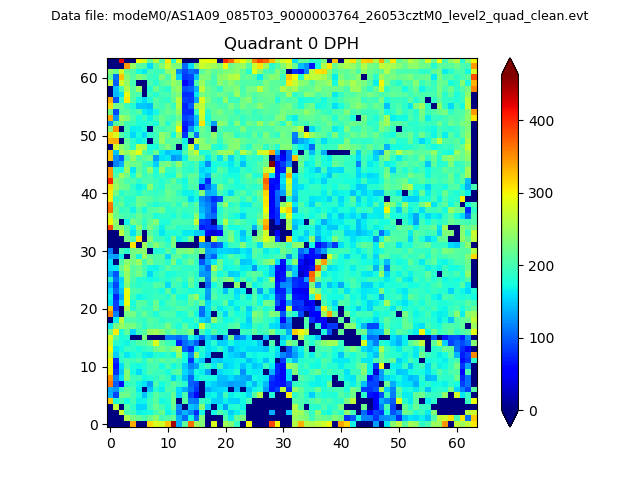 |
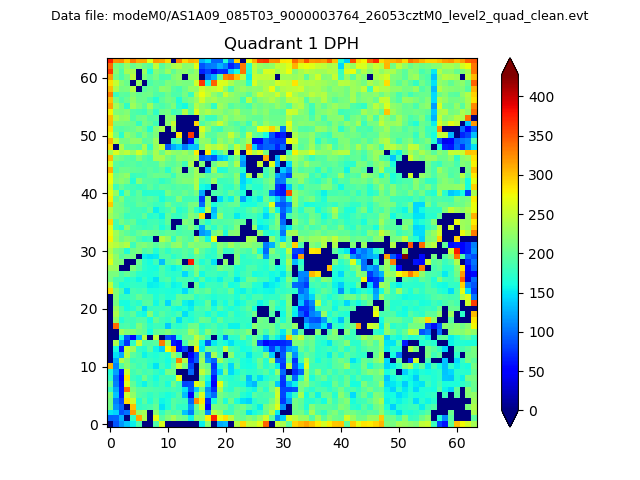 |
Quadrant B |
|---|---|---|---|
| Quadrant D | 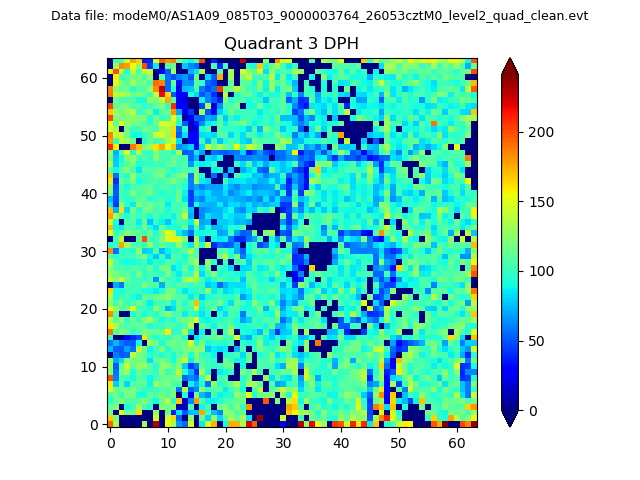 |
 |
Quadrant C |
| Plot type | Count rate plots | Images |
|---|---|---|
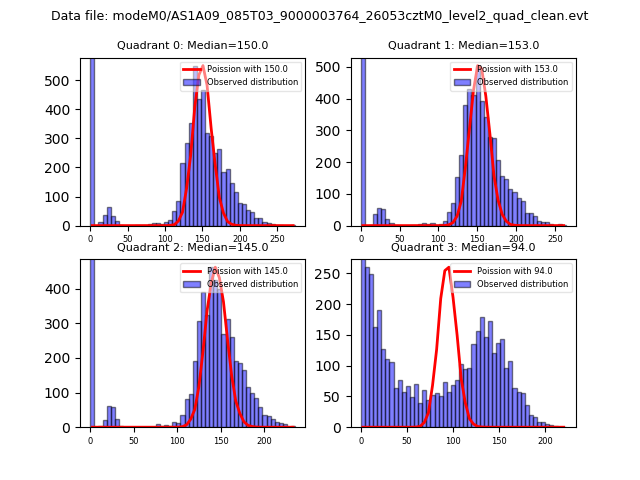
| Comparison with Poisson distribution Blue bars denote a histogram of data divided into 1 sec bins. Red curve is a Poisson curve with rate = median count rate of data. |
 |
 |
| Quadrant-wise count rates Data is divided into 100 sec bins |
 |
|
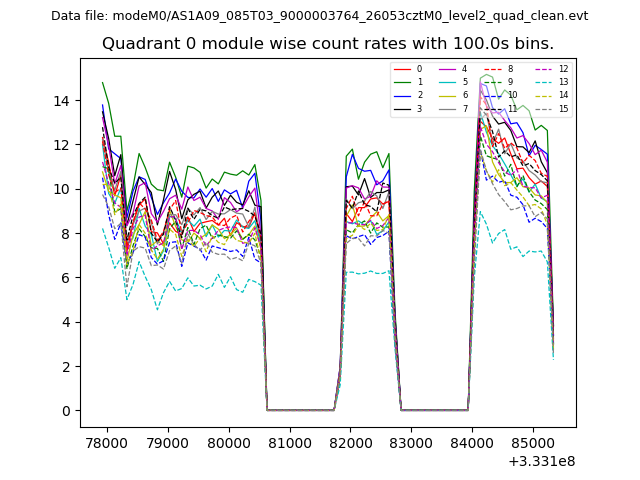
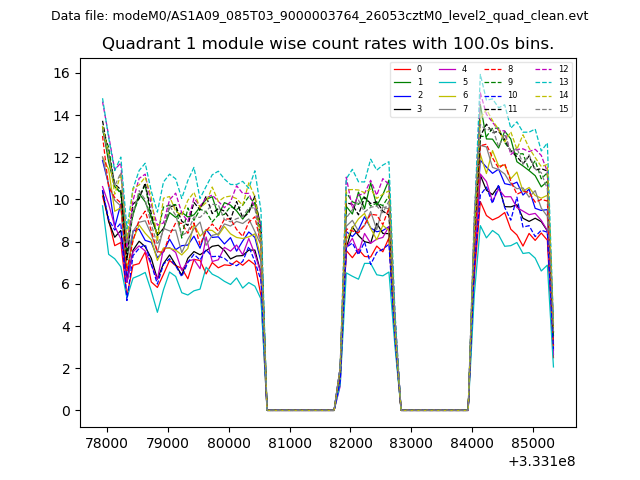
| Module-wise count rates for Quadrant A Data is divided into 100 sec bins |
 |
 |
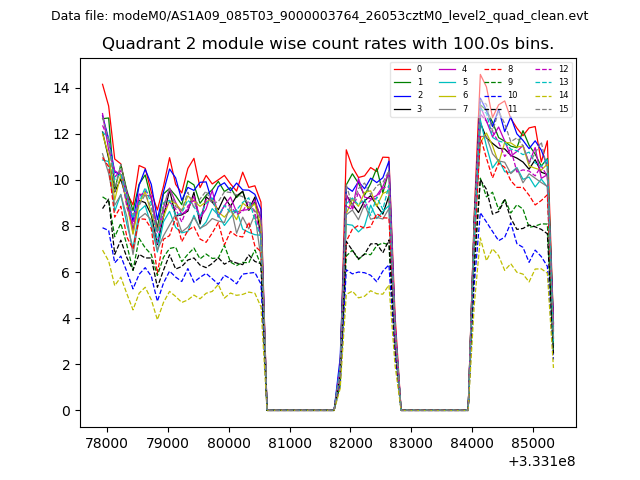
| Module-wise count rates for Quadrant B Data is divided into 100 sec bins |
 |
 |
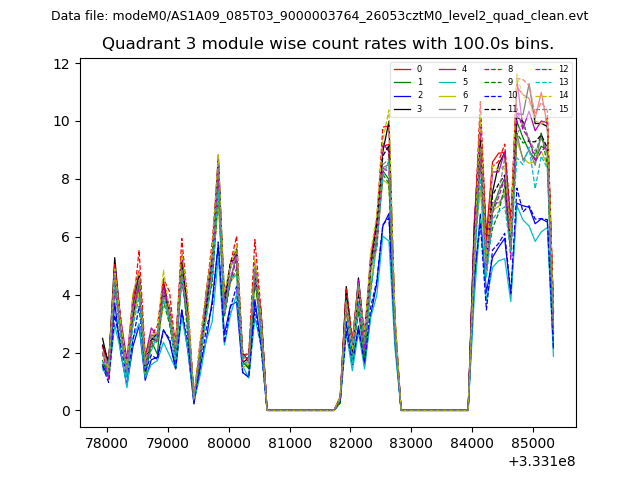
| Module-wise count rates for Quadrant C Data is divided into 100 sec bins |
 |
 |
| Module-wise count rates for Quadrant D Data is divided into 100 sec bins |
 |
 |
| Parameter | Plot |
|---|---|
| CZT HV Monitor | 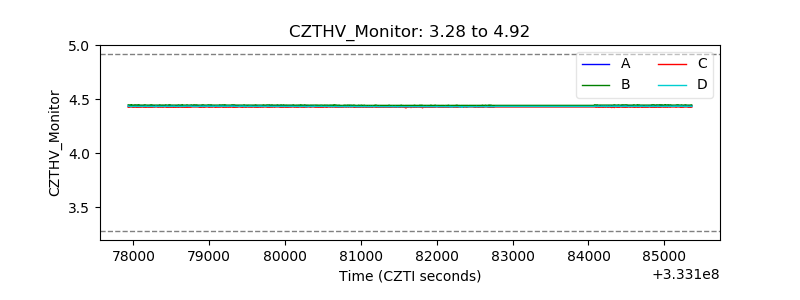 |
| D_VDD | 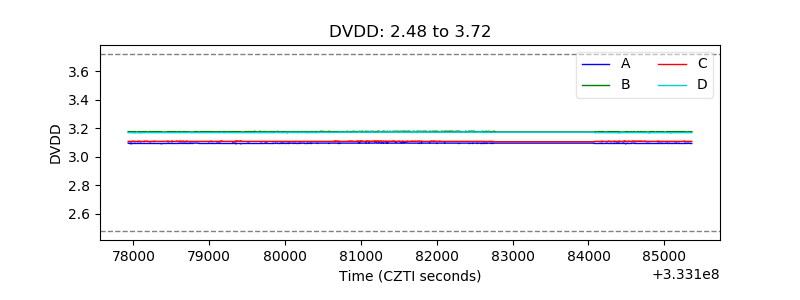 |
| Temperature 1 | 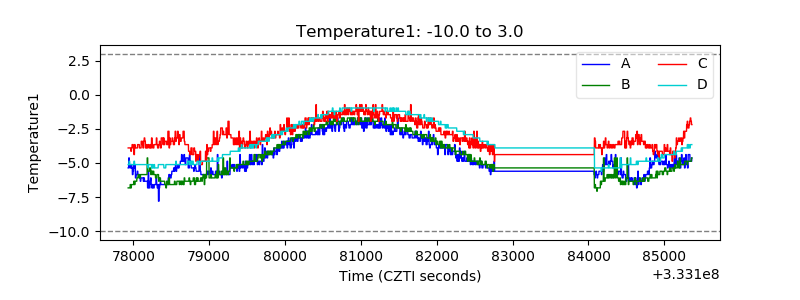 |
| Veto HV Monitor |  |
| Veto LLD | 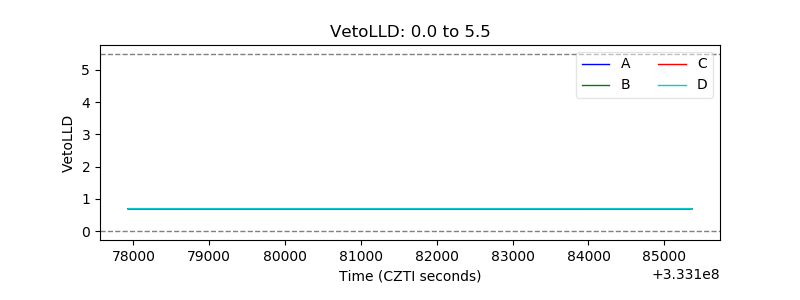 |
| Alpha Counter | 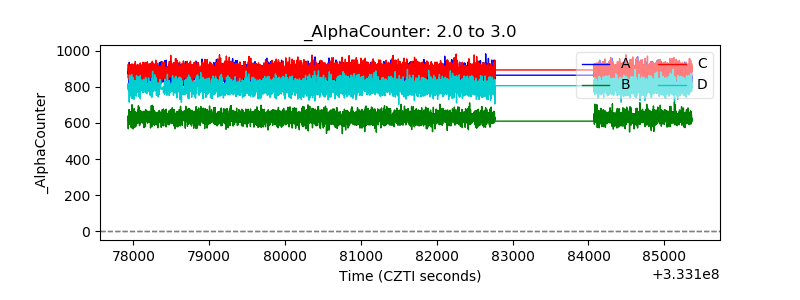 |
| _CPM_Rate | 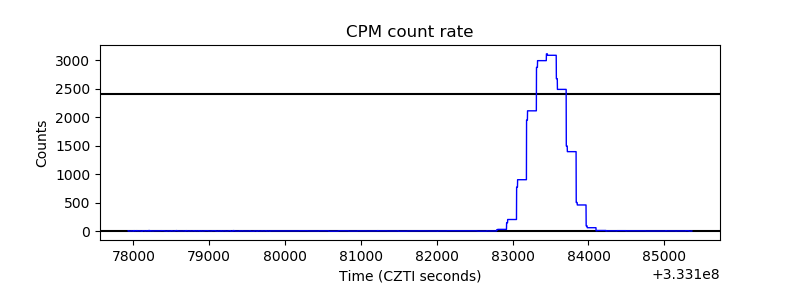 |
| CZT Counter | 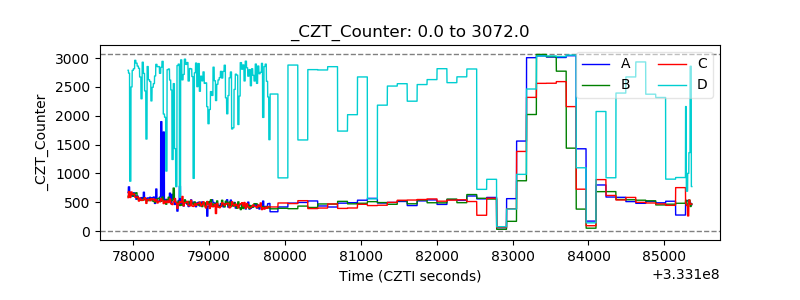 |
| +2.5 Volts monitor |  |
| +5 Volts monitor | 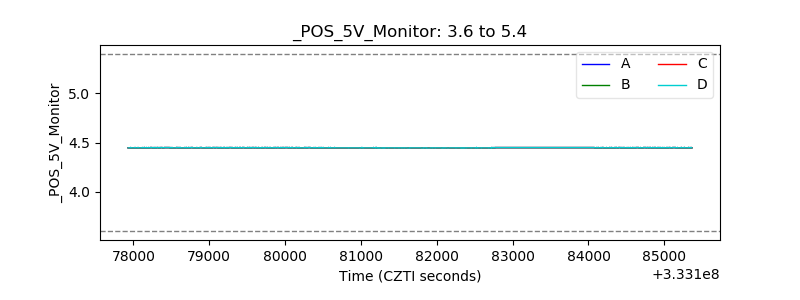 |
| _ROLL_ROT | 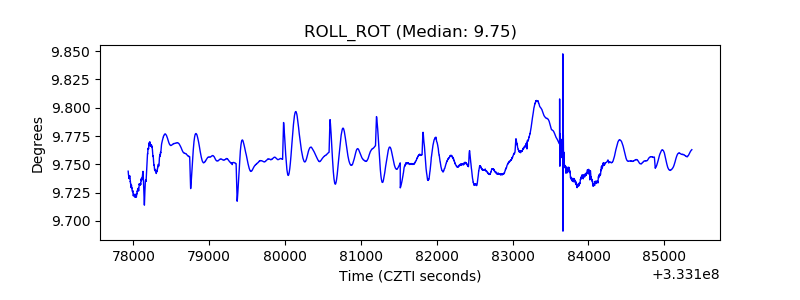 |
| _Roll_DEC | 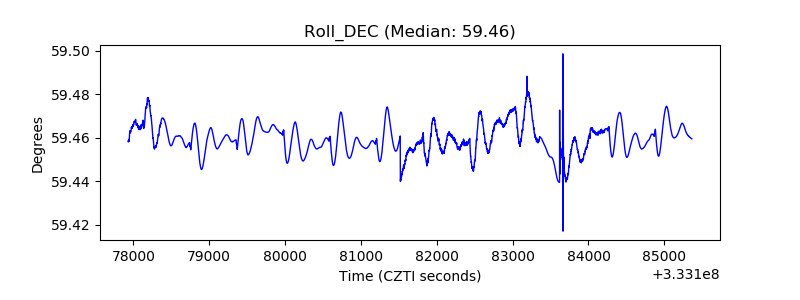 |
| _Roll_RA | 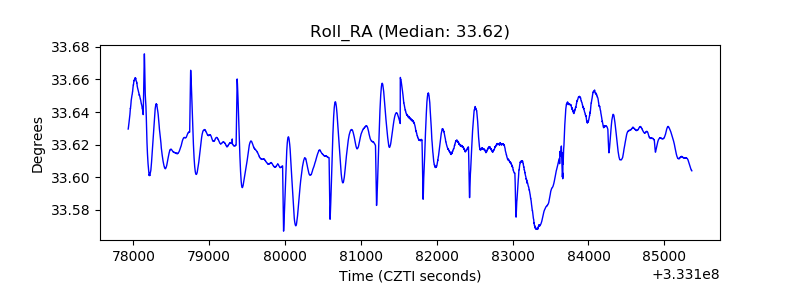 |
| Veto Counter | 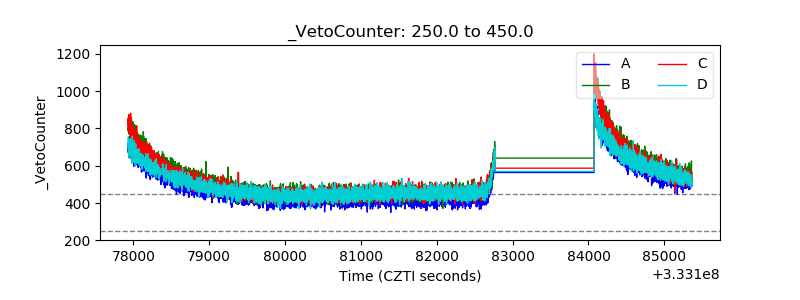 |