| Param | Original file | Final file |
|---|---|---|
| Filename | modeM0/AS1A09_085T03_9000003764_26055cztM0_level2.evt | modeM0/AS1A09_085T03_9000003764_26055cztM0_level2_quad_clean.evt |
| Size (bytes) | 445,962,240 | 103,780,800 |
| Size | 425.3 MB | 99.0 MB |
| Events in quadrant A | 3,183,887 | 703,372 |
| Events in quadrant B | 2,997,422 | 705,507 |
| Events in quadrant C | 2,929,924 | 670,864 |
| Events in quadrant D | 4,007,374 | 664,642 |
| Mode M0 | |||
|---|---|---|---|
| Quadrant | BADHDUFLAG | Total packets | Discarded packets |
| A | 0 | 12711 | 0 |
| B | 0 | 12076 | 0 |
| C | 0 | 11885 | 0 |
| D | 0 | 15461 | 0 |
| Mode M9 | |||
|---|---|---|---|
| Quadrant | BADHDUFLAG | Total packets | Discarded packets |
| A | 0 | 14 | 0 |
| B | 0 | 14 | 0 |
| C | 0 | 14 | 0 |
| D | 0 | 14 | 0 |
| Quadrant | Total seconds | Saturated seconds | Saturation percentage |
|---|---|---|---|
| A | 5711 | 73 | 1.278235% |
| B | 5712 | 49 | 0.857843% |
| C | 5712 | 52 | 0.910364% |
| D | 5712 | 189 | 3.308824% |
Noise dominated data is calculated using 1-second bins in cleaned event files. If a bin has >2000 counts, and if more than 50% of those come from <1% of pixels, then it is considered to be noise-dominated and hence unusable.
| Quadrant | # 1 sec bins | Bins with >0 counts | Bins with >2000 counts | High rate bins dominated by noise | Noise dominated (total time) | Noise dominated (detector-on time) | Marked lightcurve |
|---|---|---|---|---|---|---|---|
| A | 7086 | 5712 | 26 | 26 | 0.37% | 0.46% | 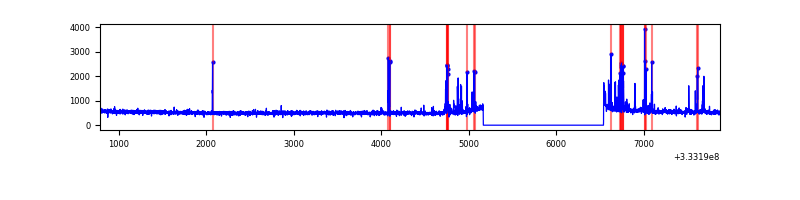 |
| B | 7087 | 5712 | 2 | 2 | 0.03% | 0.04% | 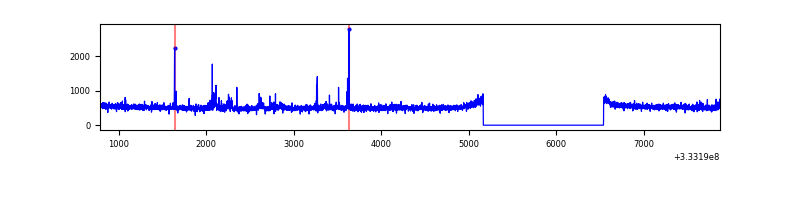 |
| C | 7087 | 5713 | 0 | 0 | 0.00% | 0.00% | 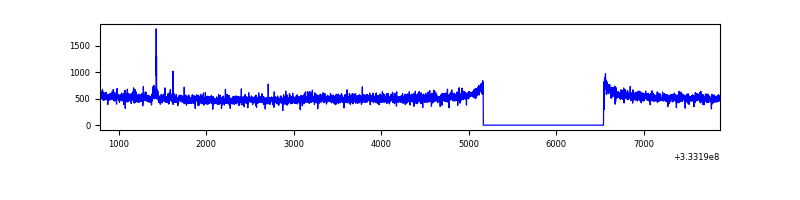 |
| D | 7087 | 5712 | 134 | 134 | 1.89% | 2.35% | 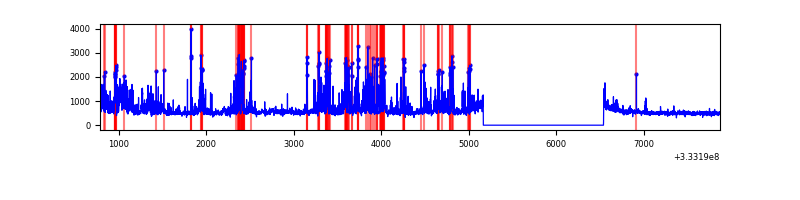 |
Top three noisy pixels from each quadrant. If the there are fewer than three noisy pixels in the level2.evt file, extra rows are filled as -1
| Pixel properties | Quadrant properties | ||||||
|---|---|---|---|---|---|---|---|
| Quadrant | DetID | PixID | Counts | Sigma | Mean | Median | Sigma |
| A | 0 | 13 | 218477 | 1442.41 | 766 | 753 | 150.9 |
| A | 13 | 254 | 8418 | 50.78 | 766 | 753 | 150.9 |
| A | 4 | 208 | 7972 | 47.83 | 766 | 753 | 150.9 |
| B | 0 | 190 | 48594 | 348.65 | 746 | 729 | 137.3 |
| B | 15 | 33 | 22341 | 157.42 | 746 | 729 | 137.3 |
| B | 12 | 111 | 15825 | 109.96 | 746 | 729 | 137.3 |
| C | 14 | 238 | 119378 | 726.68 | 714 | 719 | 163.3 |
| C | 3 | 233 | 14781 | 86.12 | 714 | 719 | 163.3 |
| C | 2 | 16 | 12776 | 73.84 | 714 | 719 | 163.3 |
| D | 1 | 52 | 1076373 | 5627.02 | 730 | 714 | 191.2 |
| D | 12 | 1 | 46387 | 238.92 | 730 | 714 | 191.2 |
| D | 12 | 233 | 38437 | 197.34 | 730 | 714 | 191.2 |
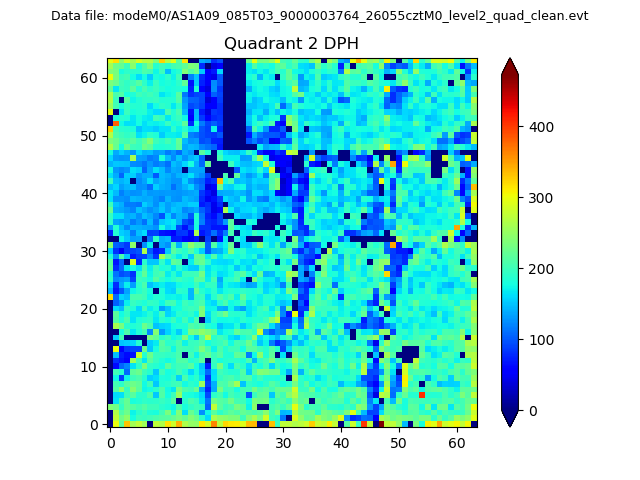
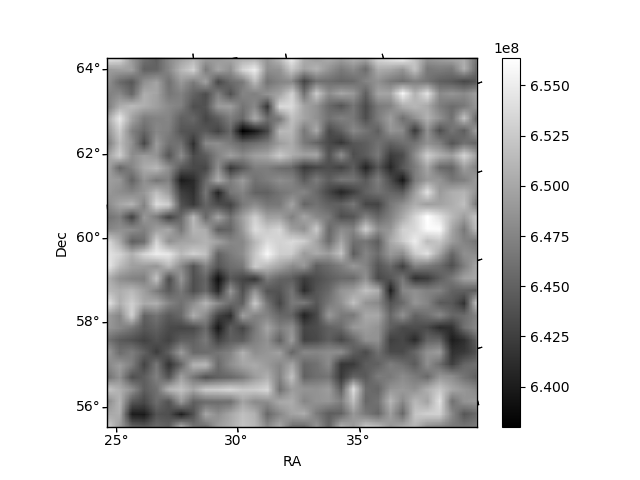
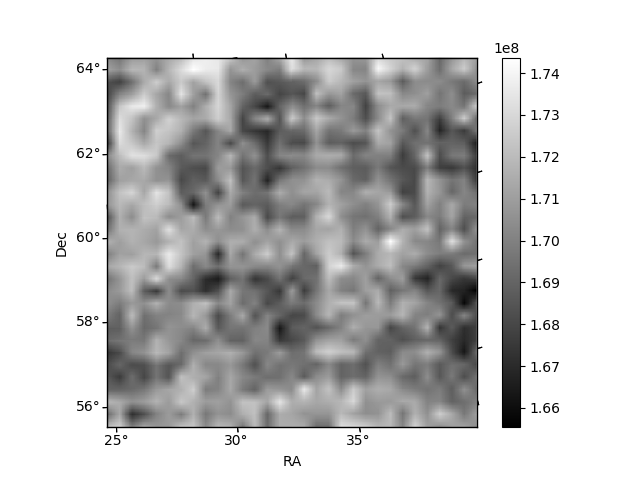
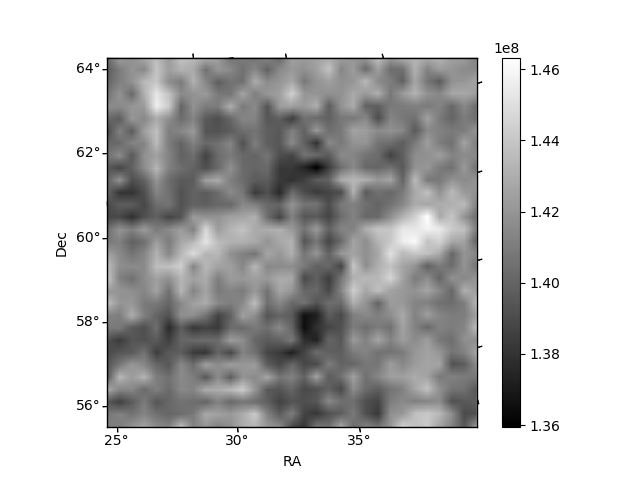
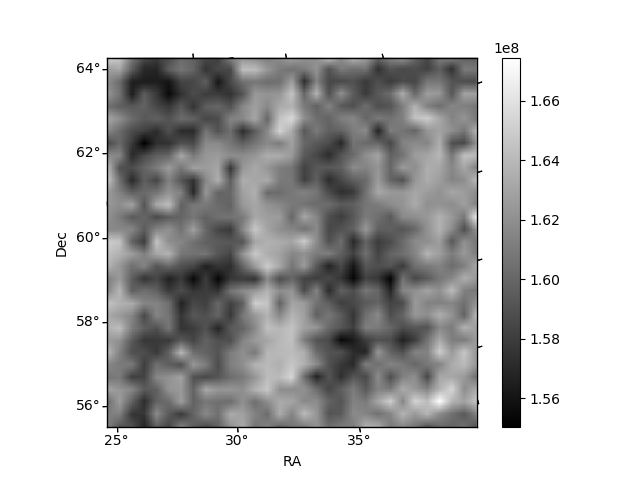
Histogram calculated using DETX and DETY for each event in the final _common_clean file
| Quadrant A | 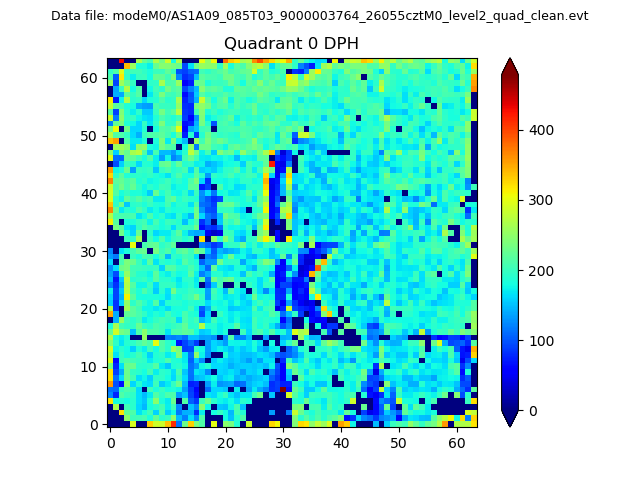 |
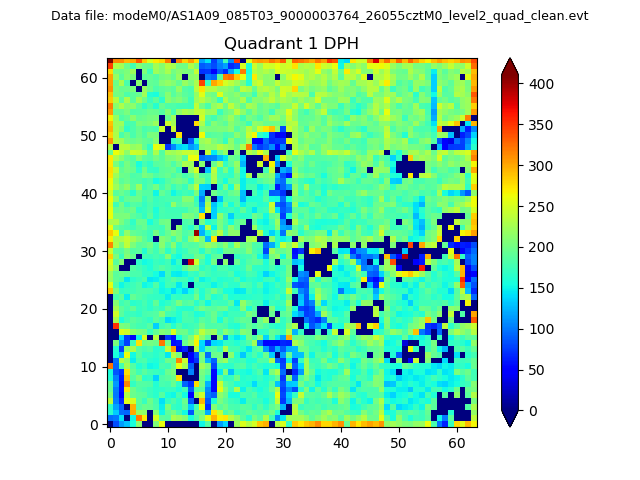 |
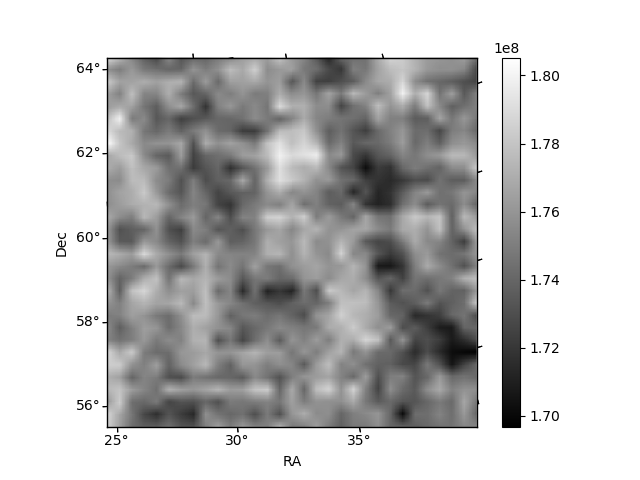
Quadrant B |
|---|---|---|---|
| Quadrant D | 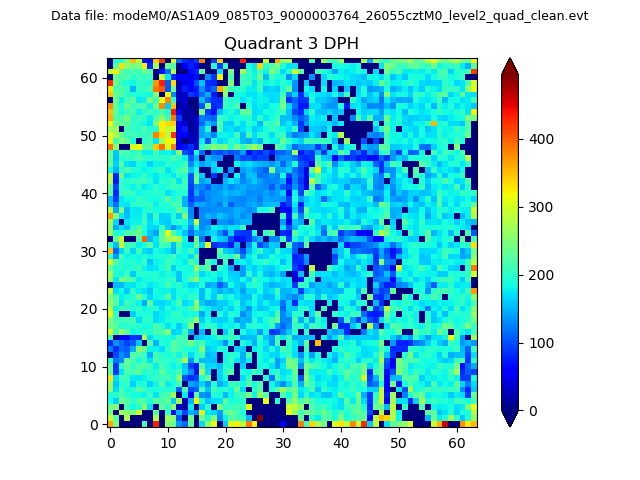 |
 |
Quadrant C |
| Plot type | Count rate plots | Images |
|---|---|---|
| Comparison with Poisson distribution Blue bars denote a histogram of data divided into 1 sec bins. Red curve is a Poisson curve with rate = median count rate of data. |
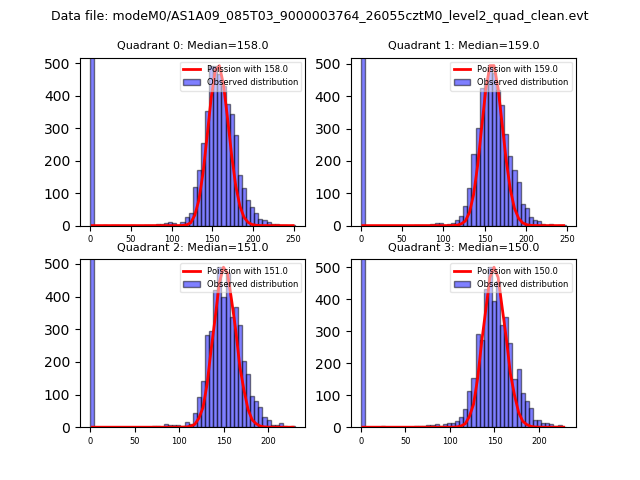 |
 |
| Quadrant-wise count rates Data is divided into 100 sec bins |
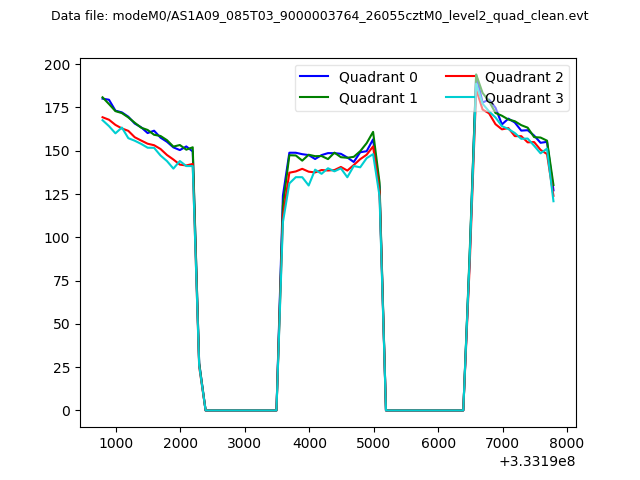 |
|
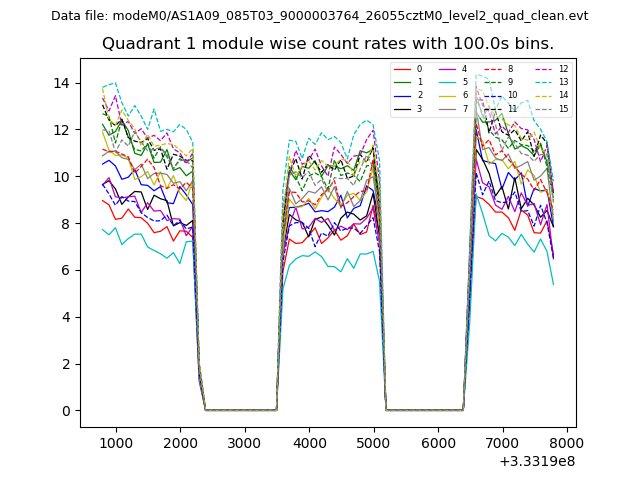
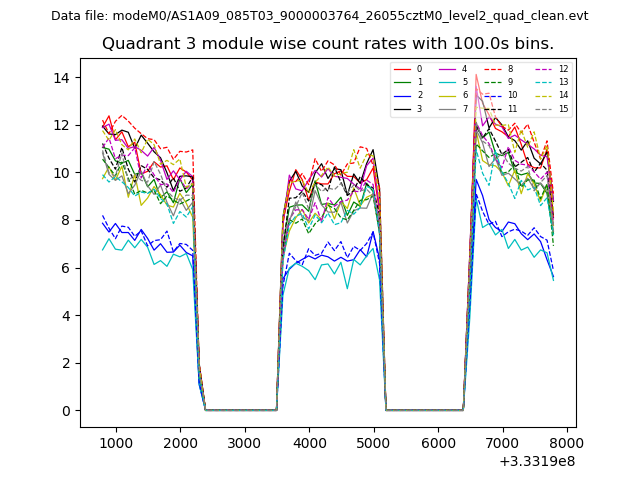
| Module-wise count rates for Quadrant A Data is divided into 100 sec bins |
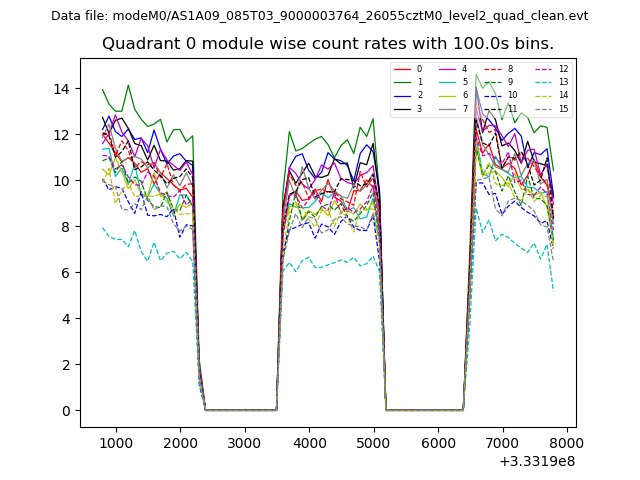 |
 |
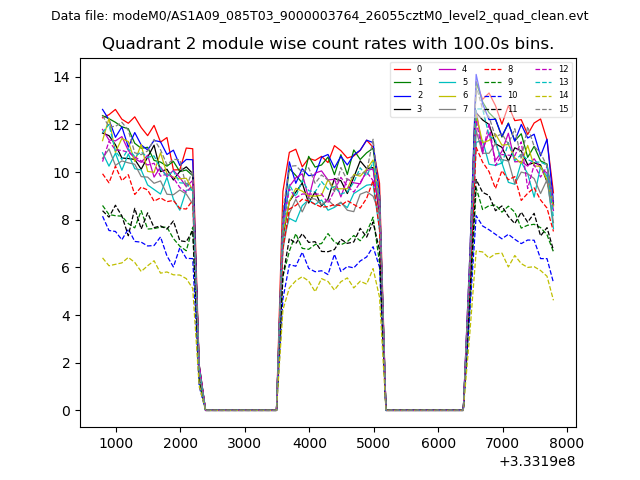
| Module-wise count rates for Quadrant B Data is divided into 100 sec bins |
 |
 |
| Module-wise count rates for Quadrant C Data is divided into 100 sec bins |
 |
 |
| Module-wise count rates for Quadrant D Data is divided into 100 sec bins |
 |
 |
| Parameter | Plot |
|---|---|
| CZT HV Monitor | 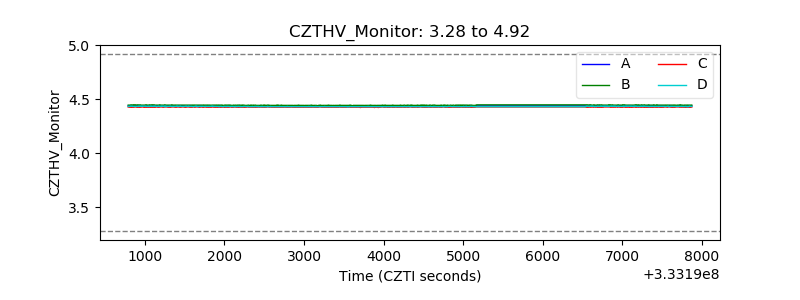 |
| D_VDD | 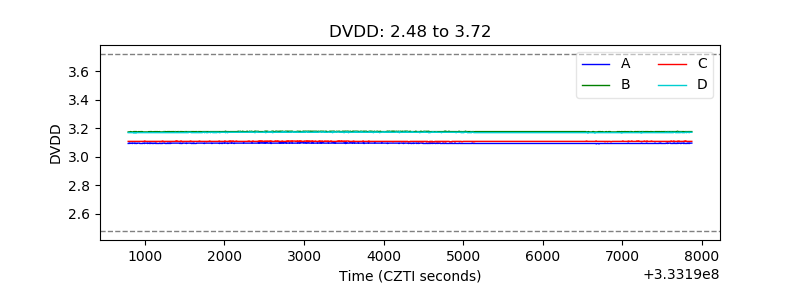 |
| Temperature 1 | 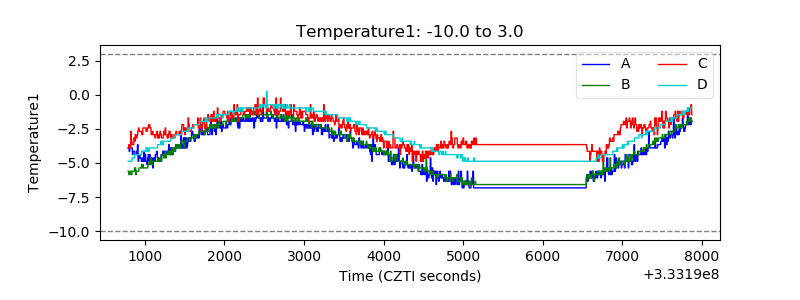 |
| Veto HV Monitor | 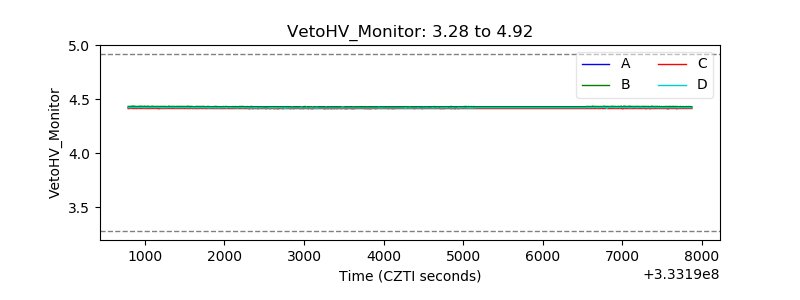 |
| Veto LLD |  |
| Alpha Counter |  |
| _CPM_Rate | 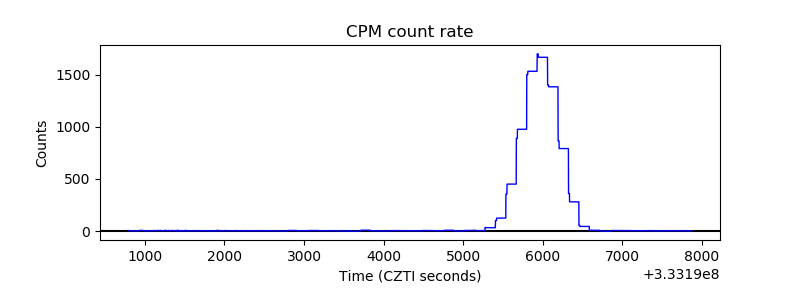 |
| CZT Counter | 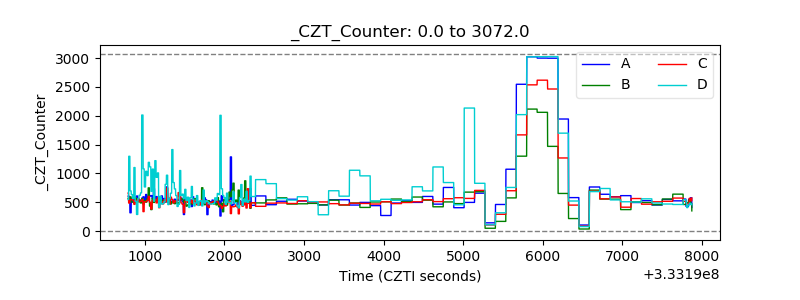 |
| +2.5 Volts monitor | 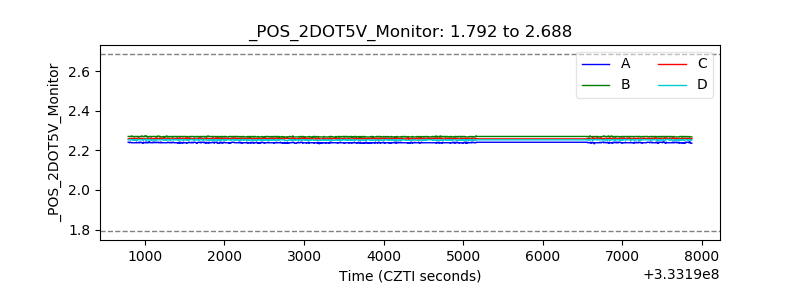 |
| +5 Volts monitor |  |
| _ROLL_ROT | 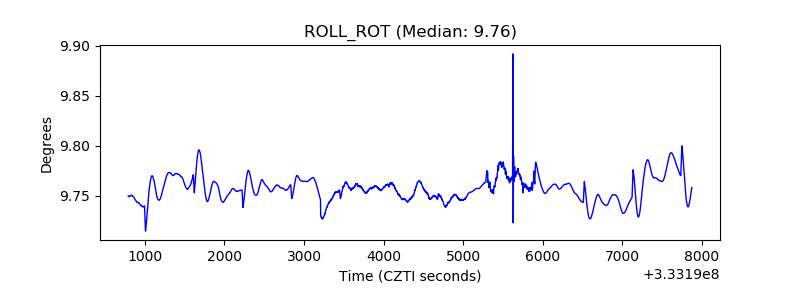 |
| _Roll_DEC | 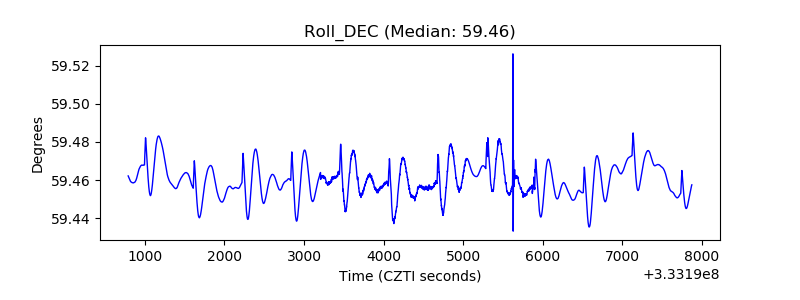 |
| _Roll_RA | 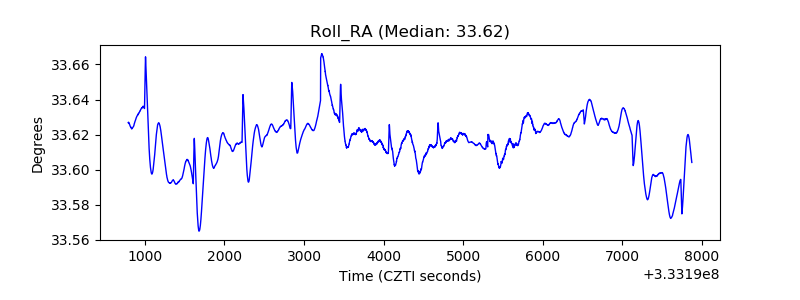 |
| Veto Counter | 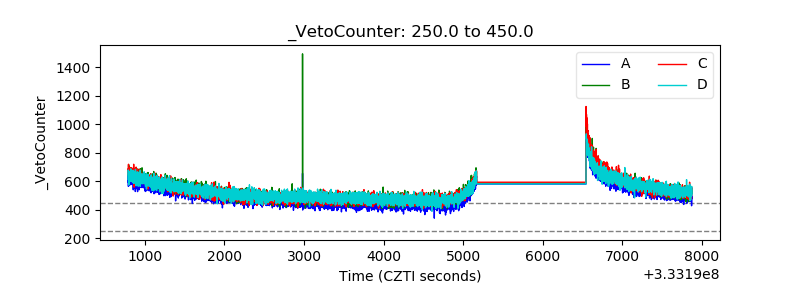 |