| Param | Original file | Final file |
|---|---|---|
| Filename | modeM0/AS1A09_085T03_9000003764_26057cztM0_level2.evt | modeM0/AS1A09_085T03_9000003764_26057cztM0_level2_quad_clean.evt |
| Size (bytes) | 694,607,040 | 93,850,560 |
| Size | 662.4 MB | 89.5 MB |
| Events in quadrant A | 3,741,501 | 614,535 |
| Events in quadrant B | 3,366,720 | 623,262 |
| Events in quadrant C | 3,205,929 | 598,698 |
| Events in quadrant D | 10,275,397 | 544,291 |
| Mode M0 | |||
|---|---|---|---|
| Quadrant | BADHDUFLAG | Total packets | Discarded packets |
| A | 0 | 15135 | 0 |
| B | 0 | 13987 | 0 |
| C | 0 | 13494 | 0 |
| D | 0 | 35167 | 0 |
| Mode M9 | |||
|---|---|---|---|
| Quadrant | BADHDUFLAG | Total packets | Discarded packets |
| A | 0 | 9 | 0 |
| B | 0 | 9 | 0 |
| C | 0 | 9 | 0 |
| D | 0 | 9 | 0 |
| Quadrant | Total seconds | Saturated seconds | Saturation percentage |
|---|---|---|---|
| A | 6609 | 192 | 2.905129% |
| B | 6610 | 118 | 1.785174% |
| C | 6610 | 151 | 2.284418% |
| D | 6610 | 1774 | 26.838124% |
Noise dominated data is calculated using 1-second bins in cleaned event files. If a bin has >2000 counts, and if more than 50% of those come from <1% of pixels, then it is considered to be noise-dominated and hence unusable.
| Quadrant | # 1 sec bins | Bins with >0 counts | Bins with >2000 counts | High rate bins dominated by noise | Noise dominated (total time) | Noise dominated (detector-on time) | Marked lightcurve |
|---|---|---|---|---|---|---|---|
| A | 7509 | 6609 | 68 | 68 | 0.91% | 1.03% | 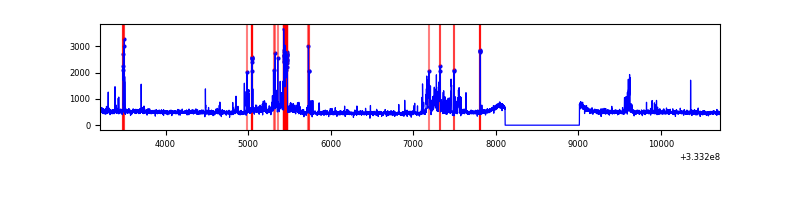 |
| B | 7510 | 6610 | 0 | 0 | 0.00% | 0.00% | 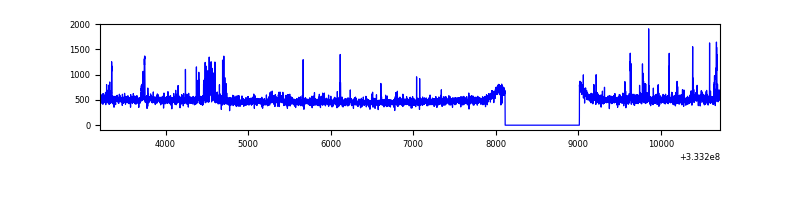 |
| C | 7510 | 6610 | 0 | 0 | 0.00% | 0.00% | 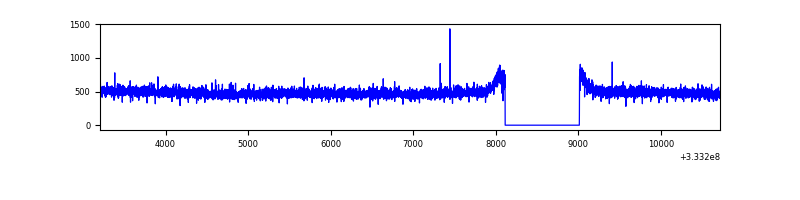 |
| D | 7509 | 6609 | 1908 | 1908 | 25.41% | 28.87% | 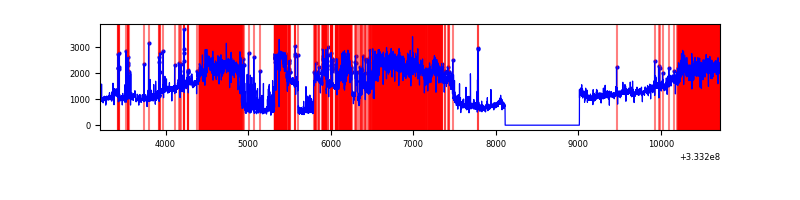 |
Top three noisy pixels from each quadrant. If the there are fewer than three noisy pixels in the level2.evt file, extra rows are filled as -1
| Pixel properties | Quadrant properties | ||||||
|---|---|---|---|---|---|---|---|
| Quadrant | DetID | PixID | Counts | Sigma | Mean | Median | Sigma |
| A | 0 | 13 | 534640 | 3224.3 | 826 | 809 | 165.6 |
| A | 13 | 254 | 10459 | 58.29 | 826 | 809 | 165.6 |
| A | 6 | 16 | 7503 | 40.43 | 826 | 809 | 165.6 |
| B | 0 | 190 | 85181 | 546.51 | 817 | 796 | 154.4 |
| B | 0 | 245 | 37070 | 234.93 | 817 | 796 | 154.4 |
| B | 5 | 172 | 20915 | 130.3 | 817 | 796 | 154.4 |
| C | 14 | 238 | 128698 | 706.35 | 786 | 790 | 181.1 |
| C | 3 | 233 | 8565 | 42.94 | 786 | 790 | 181.1 |
| C | 13 | 61 | 5366 | 25.27 | 786 | 790 | 181.1 |
| D | 1 | 3 | 6798620 | 37043.09 | 762 | 743 | 183.5 |
| D | 12 | 233 | 314447 | 1709.44 | 762 | 743 | 183.5 |
| D | 1 | 52 | 241398 | 1311.38 | 762 | 743 | 183.5 |
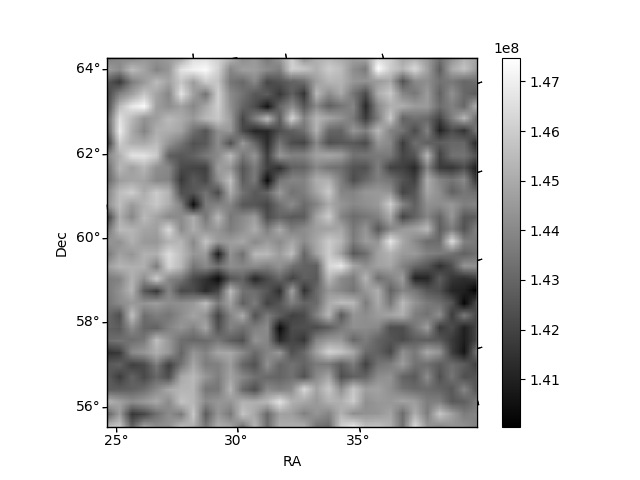
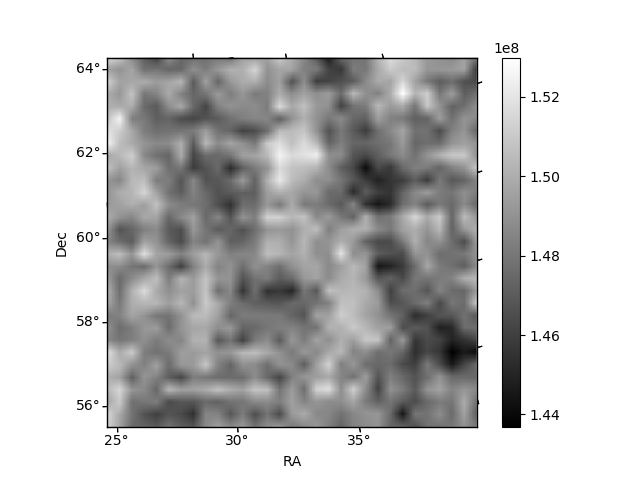
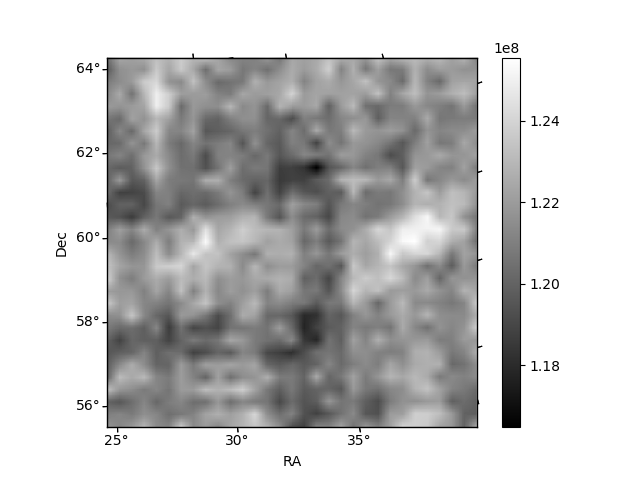
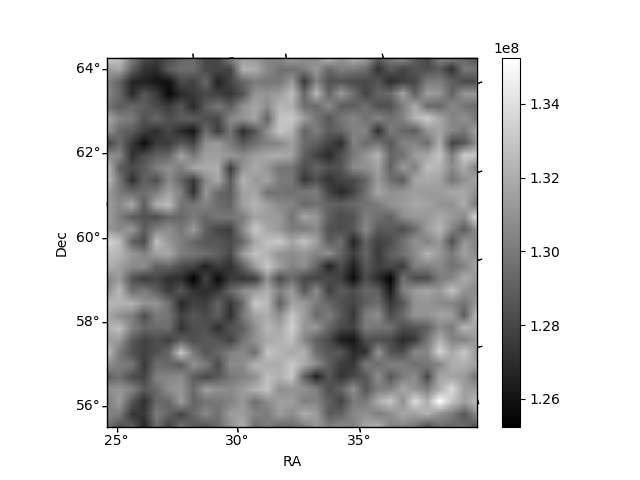
Histogram calculated using DETX and DETY for each event in the final _common_clean file
| Quadrant A |  |
 |
Quadrant B |
|---|---|---|---|
| Quadrant D |  |
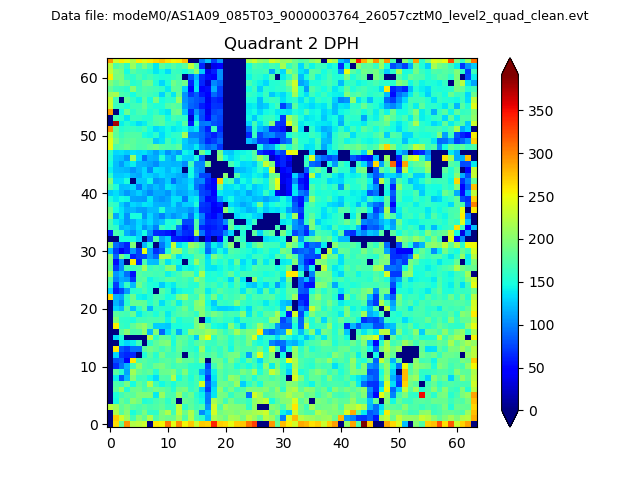 |
Quadrant C |
| Plot type | Count rate plots | Images |
|---|---|---|
| Comparison with Poisson distribution Blue bars denote a histogram of data divided into 1 sec bins. Red curve is a Poisson curve with rate = median count rate of data. |
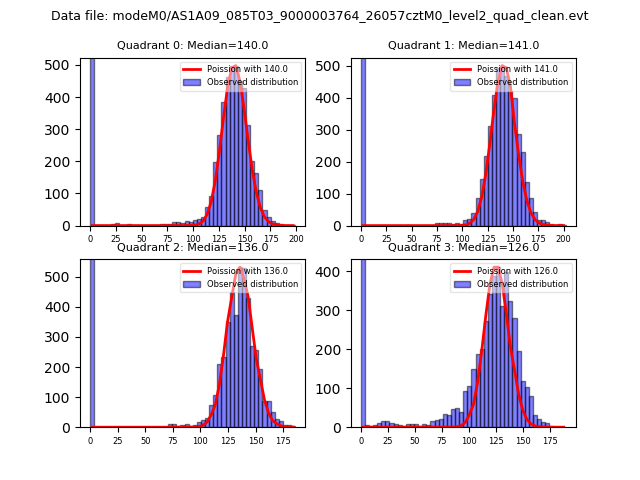 |
 |
| Quadrant-wise count rates Data is divided into 100 sec bins |
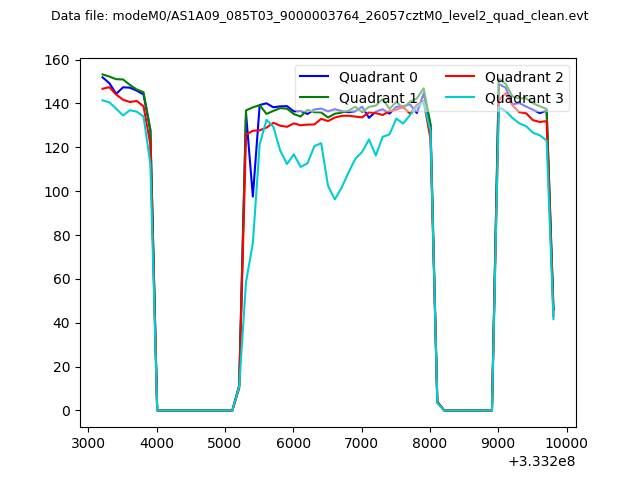 |
|
| Module-wise count rates for Quadrant A Data is divided into 100 sec bins |
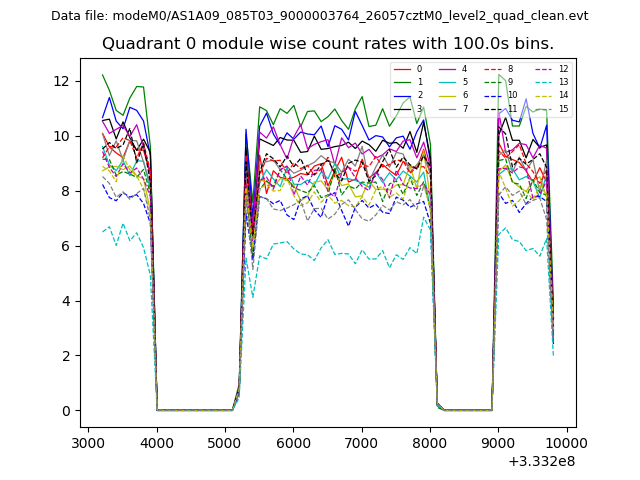 |
 |
| Module-wise count rates for Quadrant B Data is divided into 100 sec bins |
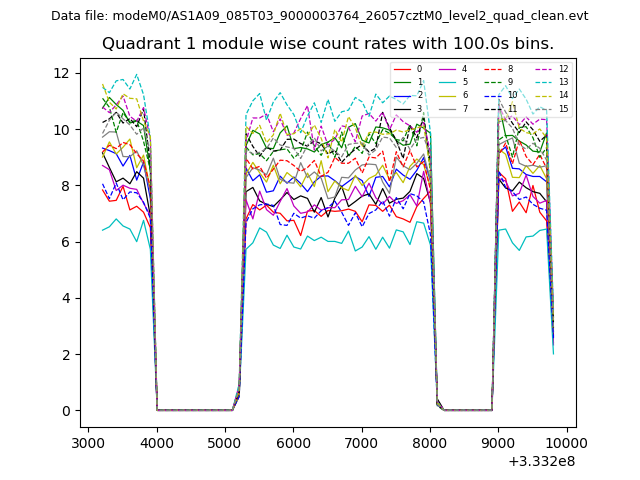 |
 |
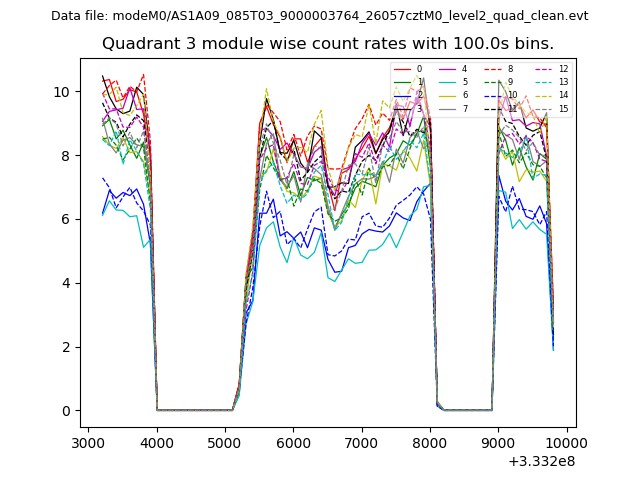
| Module-wise count rates for Quadrant C Data is divided into 100 sec bins |
 |
 |
| Module-wise count rates for Quadrant D Data is divided into 100 sec bins |
 |
 |
| Parameter | Plot |
|---|---|
| CZT HV Monitor |  |
| D_VDD | 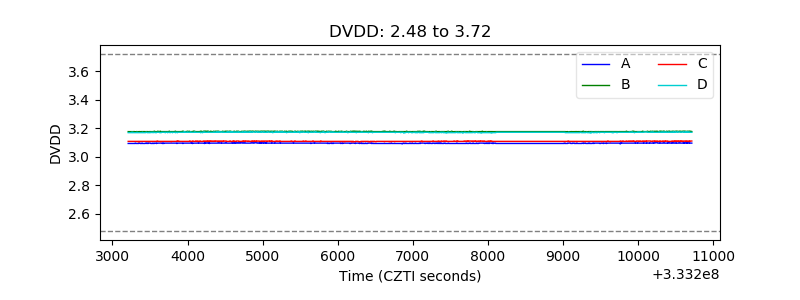 |
| Temperature 1 | 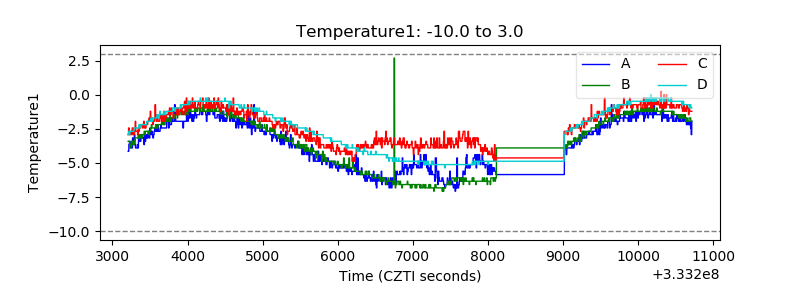 |
| Veto HV Monitor | 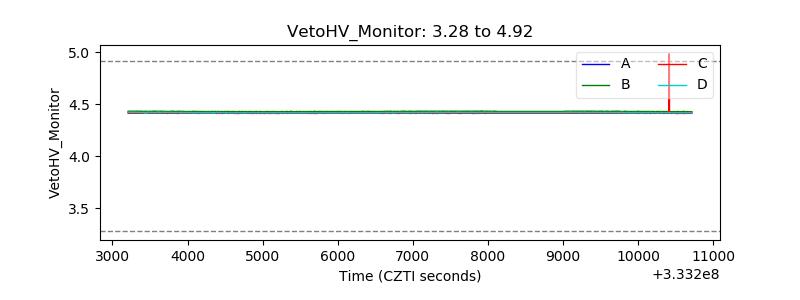 |
| Veto LLD | 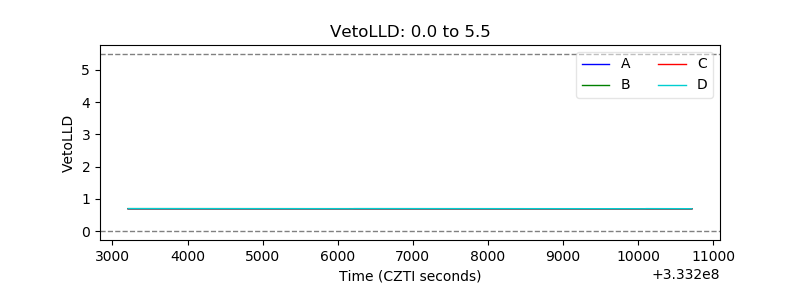 |
| Alpha Counter | 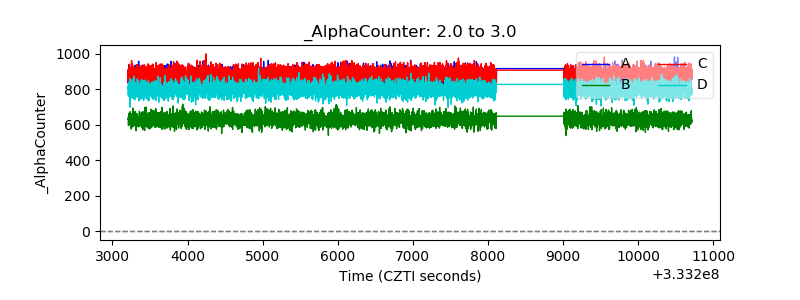 |
| _CPM_Rate | 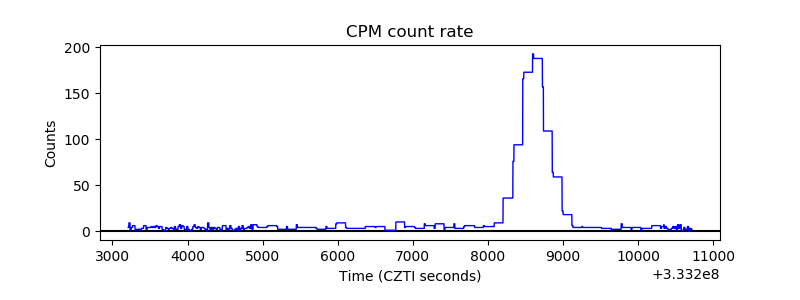 |
| CZT Counter | 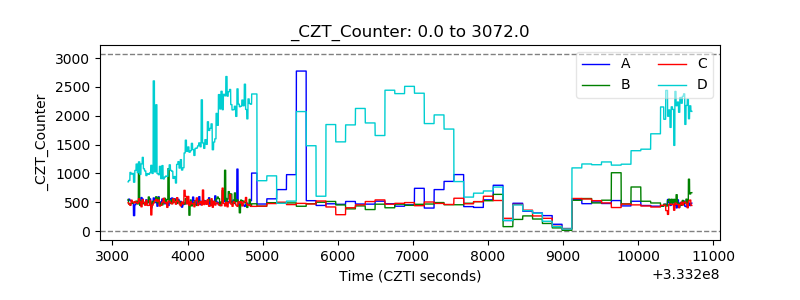 |
| +2.5 Volts monitor |  |
| +5 Volts monitor | 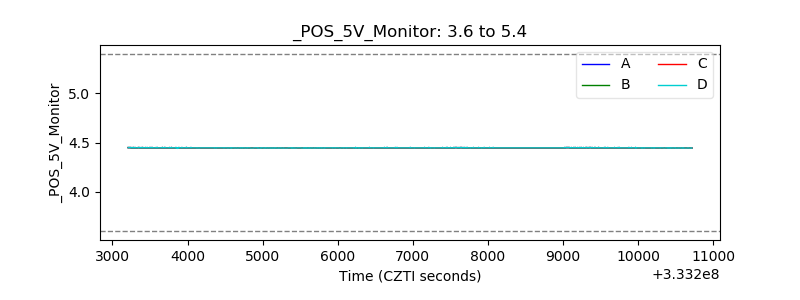 |
| _ROLL_ROT | 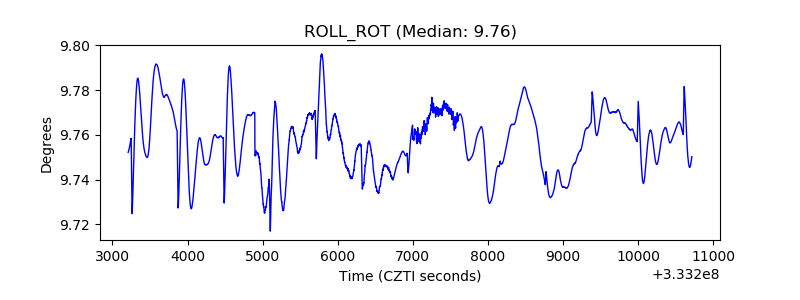 |
| _Roll_DEC | 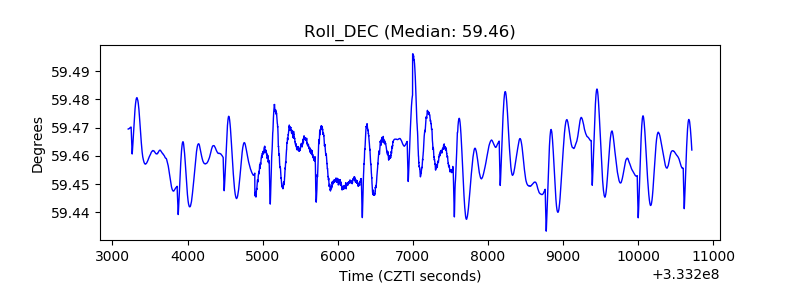 |
| _Roll_RA | 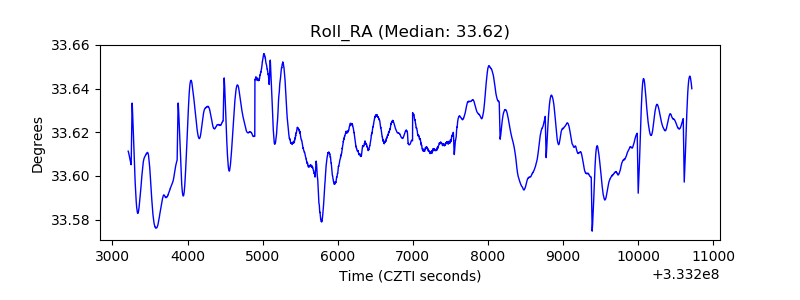 |
| Veto Counter | 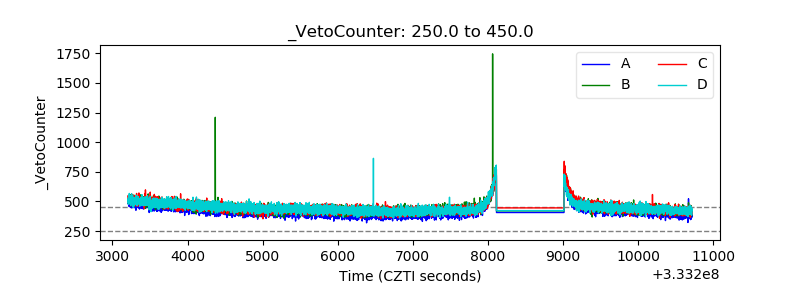 |