| Param | Original file | Final file |
|---|---|---|
| Filename | modeM0/AS1A09_085T03_9000003764_26058cztM0_level2.evt | modeM0/AS1A09_085T03_9000003764_26058cztM0_level2_quad_clean.evt |
| Size (bytes) | 245,485,440 | 27,178,560 |
| Size | 234.1 MB | 25.9 MB |
| Events in quadrant A | 1,226,450 | 165,142 |
| Events in quadrant B | 1,338,938 | 165,089 |
| Events in quadrant C | 1,187,232 | 156,807 |
| Events in quadrant D | 3,506,089 | 151,573 |
| Mode M0 | |||
|---|---|---|---|
| Quadrant | BADHDUFLAG | Total packets | Discarded packets |
| A | 0 | 5251 | 0 |
| B | 0 | 5570 | 0 |
| C | 0 | 5128 | 0 |
| D | 0 | 12121 | 0 |
| Quadrant | Total seconds | Saturated seconds | Saturation percentage |
|---|---|---|---|
| A | 2559 | 6 | 0.234467% |
| B | 2560 | 27 | 1.054688% |
| C | 2560 | 14 | 0.546875% |
| D | 2560 | 720 | 28.125000% |
Noise dominated data is calculated using 1-second bins in cleaned event files. If a bin has >2000 counts, and if more than 50% of those come from <1% of pixels, then it is considered to be noise-dominated and hence unusable.
| Quadrant | # 1 sec bins | Bins with >0 counts | Bins with >2000 counts | High rate bins dominated by noise | Noise dominated (total time) | Noise dominated (detector-on time) | Marked lightcurve |
|---|---|---|---|---|---|---|---|
| A | 2559 | 2559 | 0 | 0 | 0.00% | 0.00% | 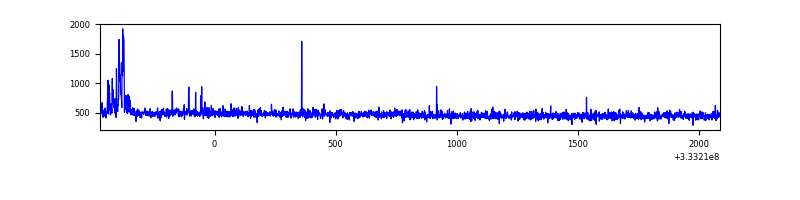 |
| B | 2560 | 2560 | 15 | 15 | 0.59% | 0.59% | 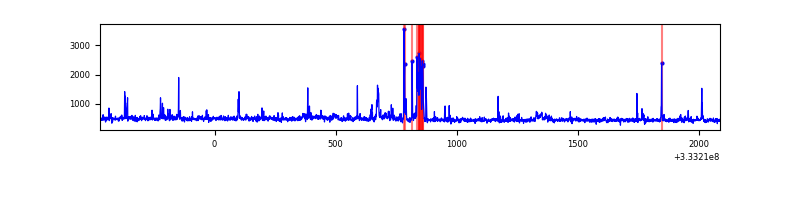 |
| C | 2560 | 2560 | 0 | 0 | 0.00% | 0.00% | 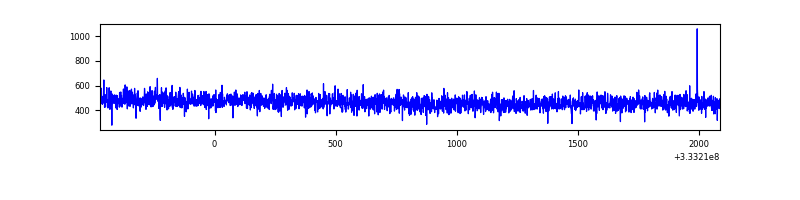 |
| D | 2560 | 2560 | 720 | 720 | 28.12% | 28.12% | 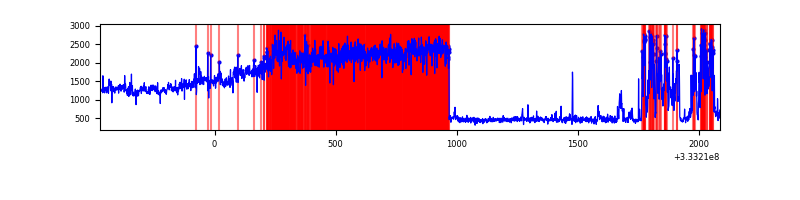 |
Top three noisy pixels from each quadrant. If the there are fewer than three noisy pixels in the level2.evt file, extra rows are filled as -1
| Pixel properties | Quadrant properties | ||||||
|---|---|---|---|---|---|---|---|
| Quadrant | DetID | PixID | Counts | Sigma | Mean | Median | Sigma |
| A | 0 | 13 | 39439 | 612.02 | 307 | 302 | 63.9 |
| A | 13 | 254 | 4224 | 61.33 | 307 | 302 | 63.9 |
| A | 0 | 226 | 2771 | 38.61 | 307 | 302 | 63.9 |
| B | 5 | 172 | 88832 | 1545.82 | 300 | 294 | 57.3 |
| B | 0 | 190 | 36857 | 638.37 | 300 | 294 | 57.3 |
| B | 0 | 245 | 28077 | 485.08 | 300 | 294 | 57.3 |
| C | 14 | 238 | 46926 | 679.3 | 291 | 292 | 68.6 |
| C | 8 | 222 | 2261 | 28.68 | 291 | 292 | 68.6 |
| C | 13 | 61 | 2050 | 25.61 | 291 | 292 | 68.6 |
| D | 1 | 3 | 2015471 | 26946.35 | 283 | 275 | 74.8 |
| D | 12 | 233 | 322585 | 4309.79 | 283 | 275 | 74.8 |
| D | 1 | 52 | 70476 | 938.7 | 283 | 275 | 74.8 |
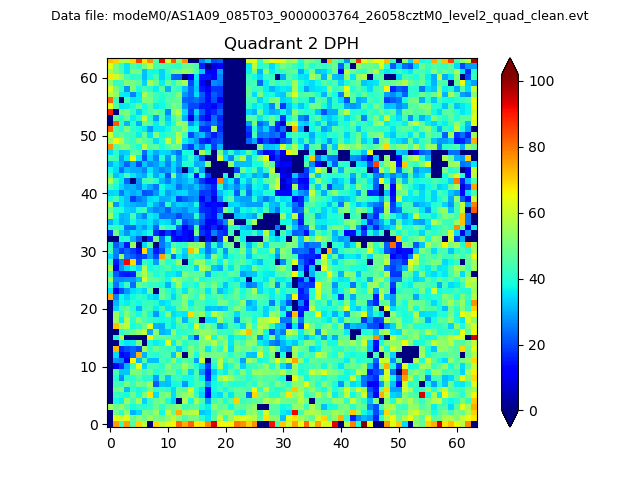
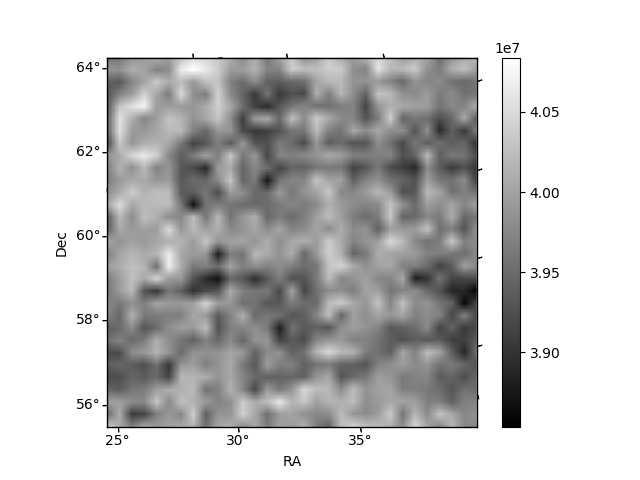
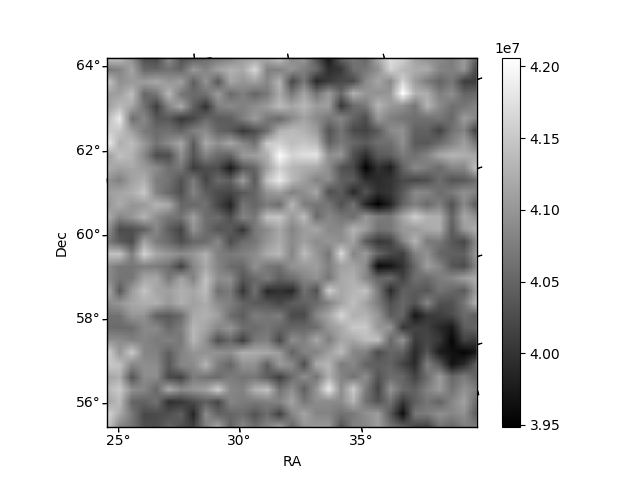
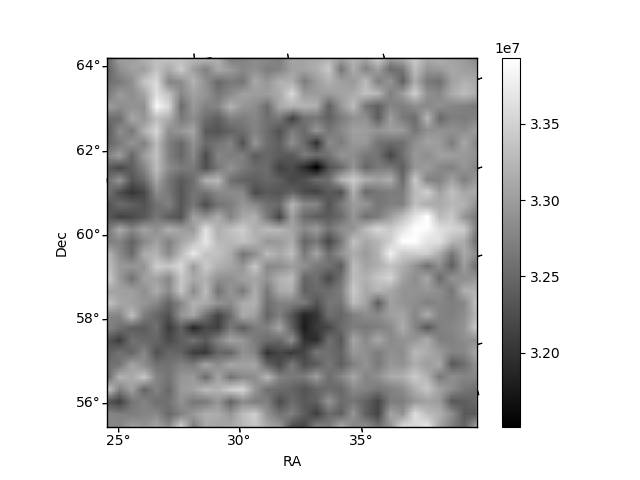
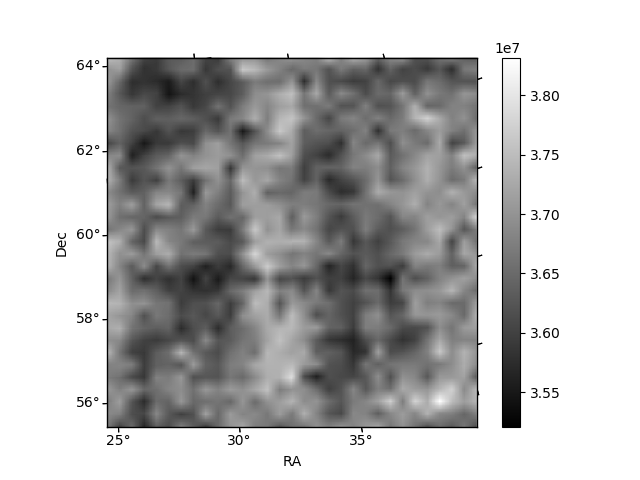
Histogram calculated using DETX and DETY for each event in the final _common_clean file
| Quadrant A |  |
 |
Quadrant B |
|---|---|---|---|
| Quadrant D | 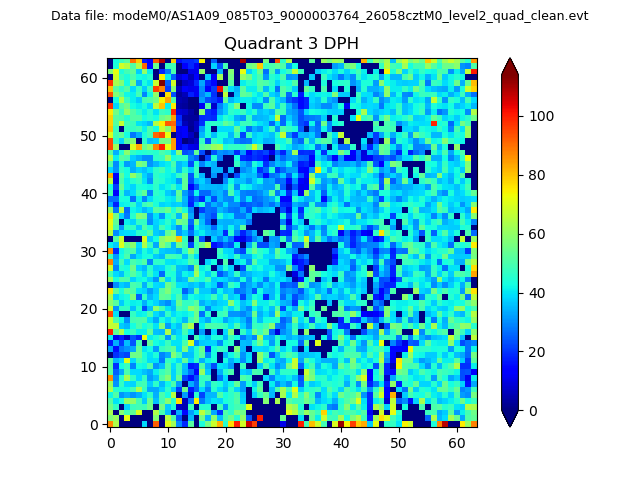 |
 |
Quadrant C |
| Plot type | Count rate plots | Images |
|---|---|---|
| Comparison with Poisson distribution Blue bars denote a histogram of data divided into 1 sec bins. Red curve is a Poisson curve with rate = median count rate of data. |
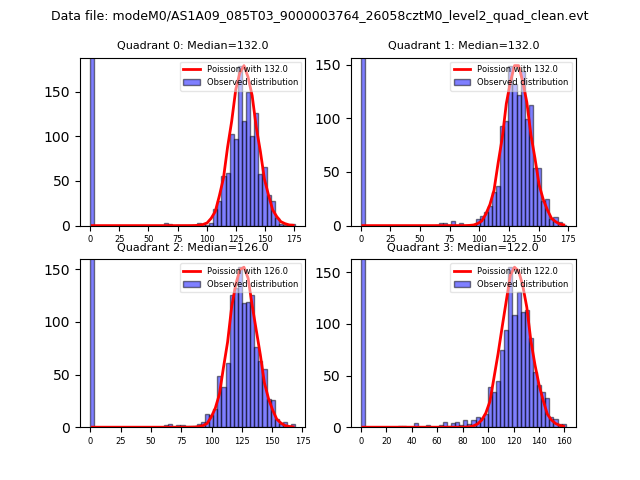 |
 |
| Quadrant-wise count rates Data is divided into 100 sec bins |
 |
|
| Module-wise count rates for Quadrant A Data is divided into 100 sec bins |
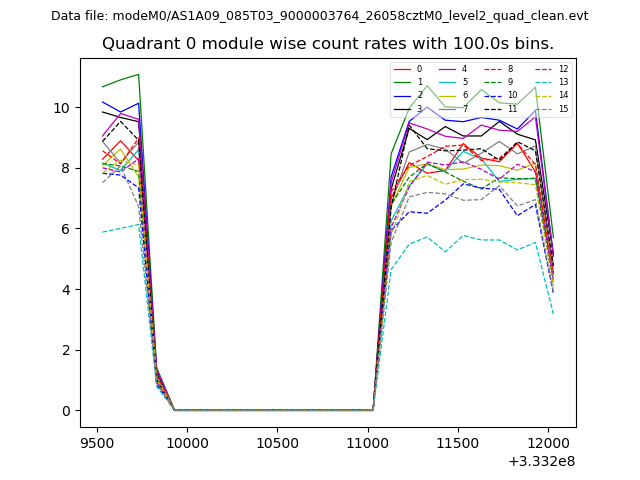 |
 |
| Module-wise count rates for Quadrant B Data is divided into 100 sec bins |
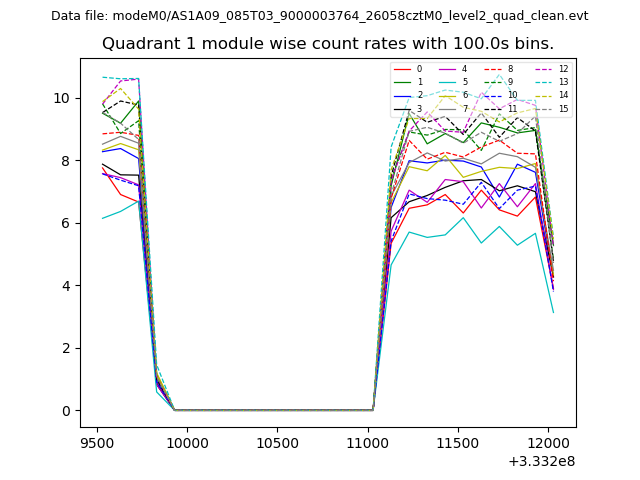 |
 |
| Module-wise count rates for Quadrant C Data is divided into 100 sec bins |
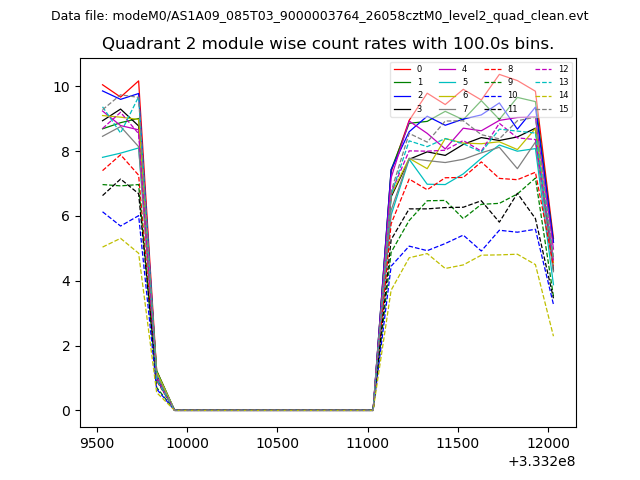 |
 |
| Module-wise count rates for Quadrant D Data is divided into 100 sec bins |
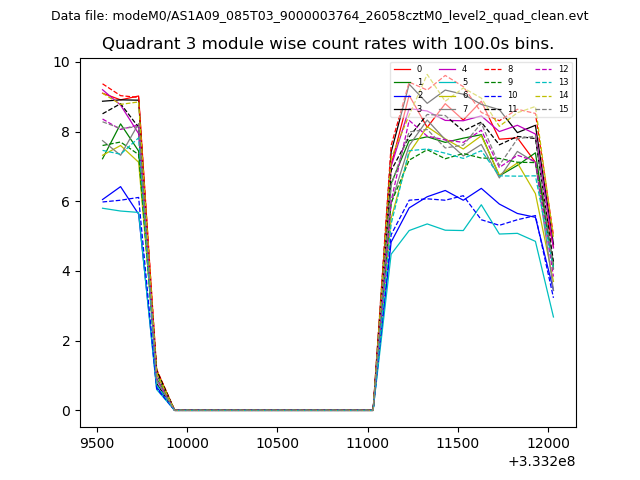 |
 |
| Parameter | Plot |
|---|---|
| CZT HV Monitor | 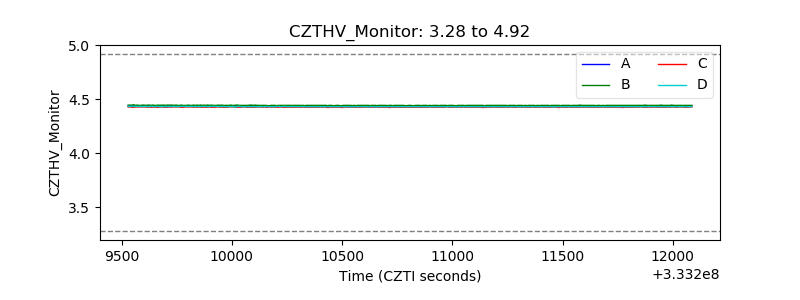 |
| D_VDD | 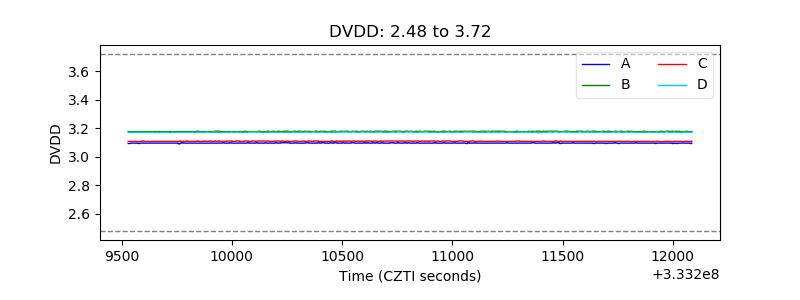 |
| Temperature 1 | 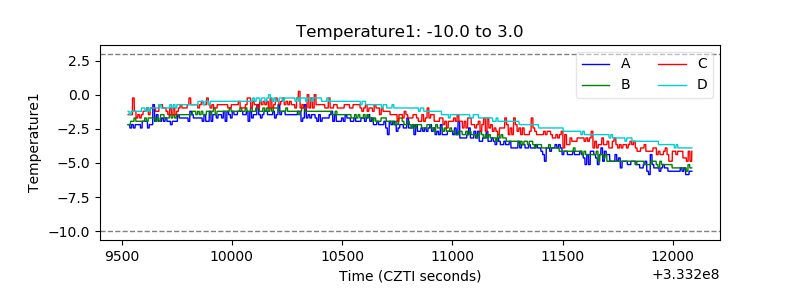 |
| Veto HV Monitor | 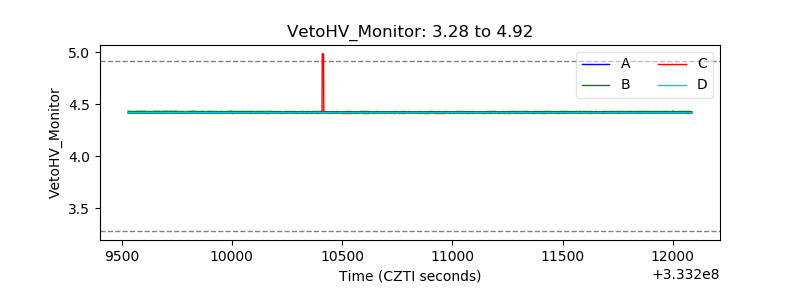 |
| Veto LLD | 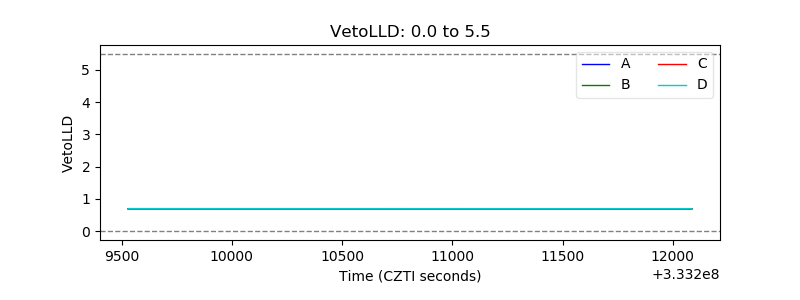 |
| Alpha Counter |  |
| _CPM_Rate | 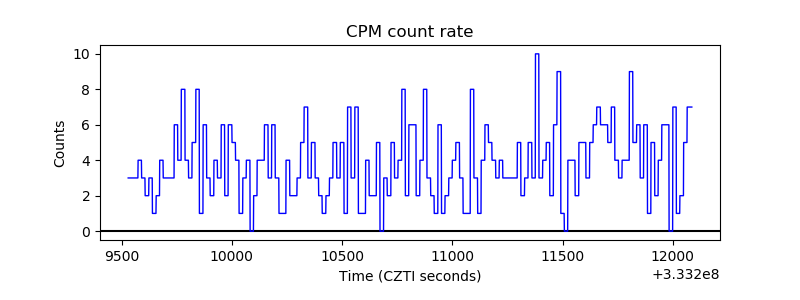 |
| CZT Counter | 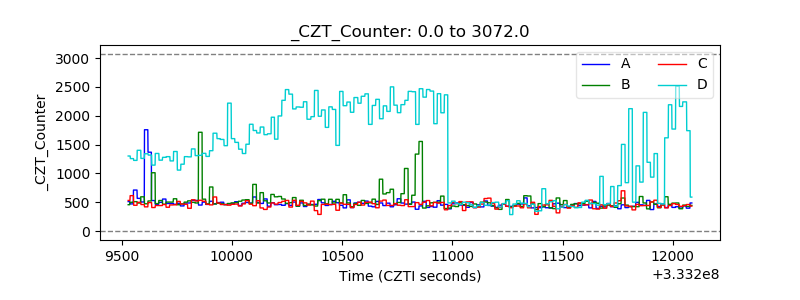 |
| +2.5 Volts monitor |  |
| +5 Volts monitor | 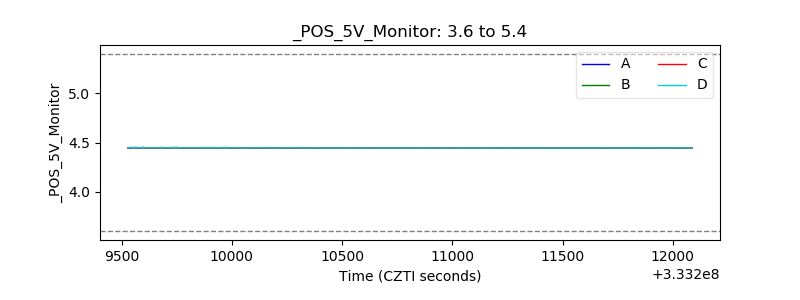 |
| _ROLL_ROT | 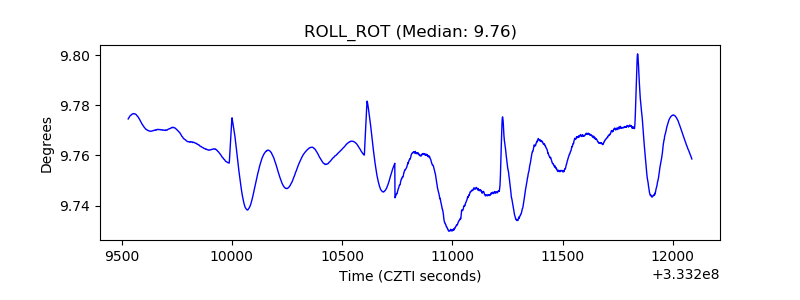 |
| _Roll_DEC | 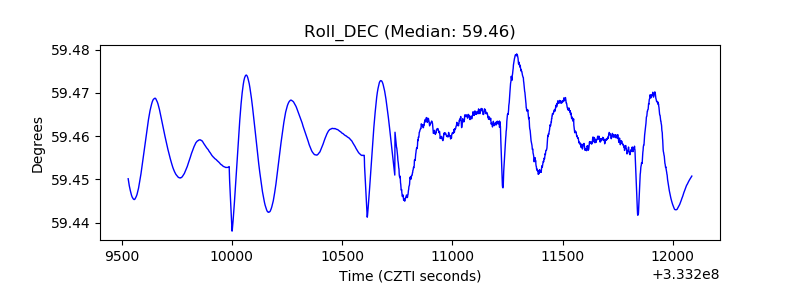 |
| _Roll_RA |  |
| Veto Counter | 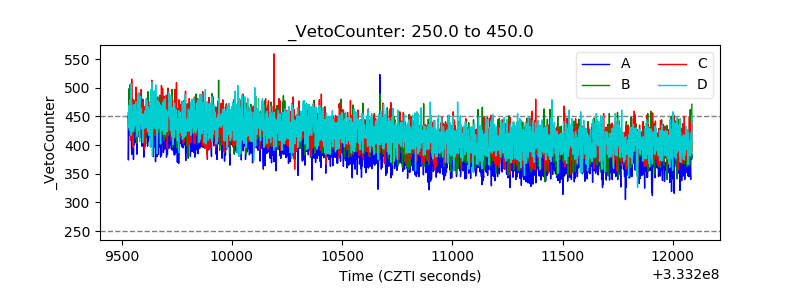 |