| Param | Original file | Final file |
|---|---|---|
| Filename | modeM0/AS1A09_142T01_9000003766cztM0_level2.fits | modeM0/AS1A09_142T01_9000003766cztM0_level2_quad_clean.evt |
| Size (bytes) | 676,618,560 | 562,982,400 |
| Size | 645.3 MB | 536.9 MB |
| Events in quadrant A | 4,391,678 | 3,535,482 |
| Events in quadrant B | 4,133,038 | 3,502,226 |
| Events in quadrant C | 4,149,938 | 3,291,101 |
| Events in quadrant D | 3,092,562 | 2,002,561 |
| Mode M9 | |||
|---|---|---|---|
| Quadrant | BADHDUFLAG | Total packets | Discarded packets |
| A | 0 | 114 | 0 |
| B | 0 | 114 | 0 |
| C | 0 | 114 | 0 |
| D | 0 | 114 | 0 |
| Mode SS | |||
|---|---|---|---|
| Quadrant | BADHDUFLAG | Total packets | Discarded packets |
| A | 0 | 1406 | 0 |
| B | 0 | 1406 | 0 |
| C | 0 | 1406 | 0 |
| D | 0 | 1406 | 0 |
| Mode M0 | |||
|---|---|---|---|
| Quadrant | BADHDUFLAG | Total packets | Discarded packets |
| A | 0 | 144041 | 0 |
| B | 0 | 146725 | 0 |
| C | 0 | 143124 | 0 |
| D | 0 | 288099 | 0 |
| Quadrant | Total seconds | Saturated seconds | Saturation percentage |
|---|---|---|---|
| A | 68753 | 671 | 0.975957% |
| B | 68753 | 918 | 1.335214% |
| C | 68753 | 1028 | 1.495207% |
| D | 68753 | 19142 | 27.841694% |
Noise dominated data is calculated using 1-second bins in cleaned event files. If a bin has >2000 counts, and if more than 50% of those come from <1% of pixels, then it is considered to be noise-dominated and hence unusable.
| Quadrant | # 1 sec bins | Bins with >0 counts | Bins with >2000 counts | High rate bins dominated by noise | Noise dominated (total time) | Noise dominated (detector-on time) | Marked lightcurve |
|---|---|---|---|---|---|---|---|
| A | 80383 | 68743 | 0 | 0 | 0.00% | 0.00% |  |
| B | 80383 | 68743 | 0 | 0 | 0.00% | 0.00% |  |
| C | 80383 | 68744 | 0 | 0 | 0.00% | 0.00% |  |
| D | 80383 | 67499 | 0 | 0 | 0.00% | 0.00% |  |
Top three noisy pixels from each quadrant. If the there are fewer than three noisy pixels in the level2.evt file, extra rows are filled as -1
| Pixel properties | Quadrant properties | ||||||
|---|---|---|---|---|---|---|---|
| Quadrant | DetID | PixID | Counts | Sigma | Mean | Median | Sigma |
| A | 0 | 29 | 3715 | 9.46 | 1145 | 1082 | 278.4 |
| A | 7 | 110 | 3409 | 8.36 | 1145 | 1082 | 278.4 |
| A | 9 | 19 | 3394 | 8.3 | 1145 | 1082 | 278.4 |
| B | 2 | 9 | 3313 | 10.79 | 1093 | 1049 | 209.8 |
| B | 2 | 8 | 2723 | 7.98 | 1093 | 1049 | 209.8 |
| B | 5 | 255 | 2701 | 7.88 | 1093 | 1049 | 209.8 |
| C | 12 | 241 | 2875 | 6.73 | 1097 | 1030 | 274.1 |
| C | 3 | 126 | 2843 | 6.61 | 1097 | 1030 | 274.1 |
| C | 3 | 187 | 2748 | 6.27 | 1097 | 1030 | 274.1 |
| D | 6 | 231 | 2225 | 6.03 | 886 | 811 | 234.4 |
| D | 10 | 189 | 2181 | 5.85 | 886 | 811 | 234.4 |
| D | 4 | 160 | 2141 | 5.67 | 886 | 811 | 234.4 |
Histogram calculated using DETX and DETY for each event in the final _common_clean file
| Quadrant A | 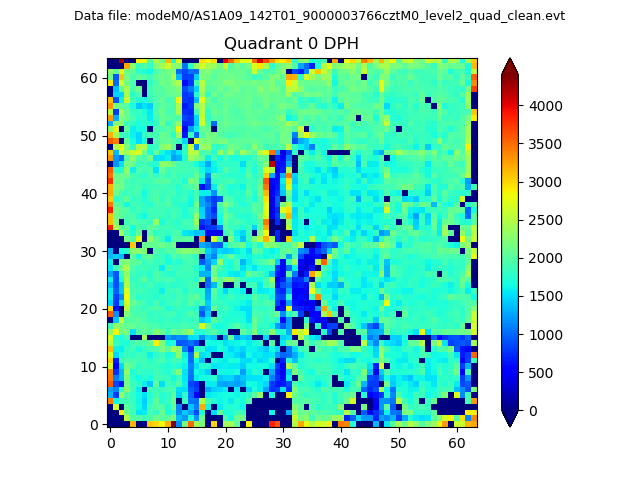 |
 |
Quadrant B |
|---|---|---|---|
| Quadrant D | 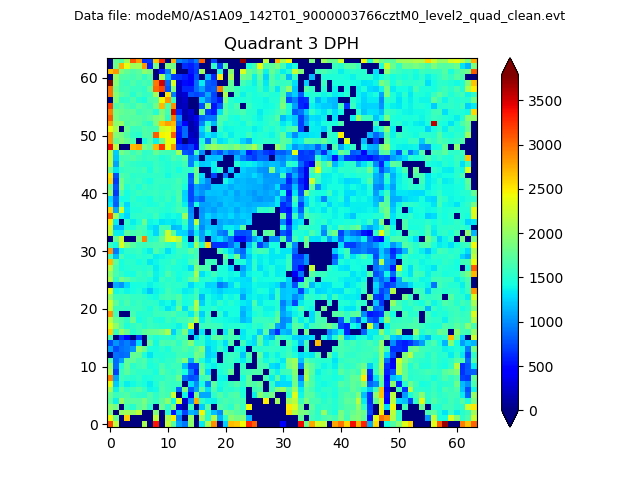 |
 |
Quadrant C |
| Plot type | Count rate plots | Images |
|---|---|---|
| Comparison with Poisson distribution Blue bars denote a histogram of data divided into 1 sec bins. Red curve is a Poisson curve with rate = median count rate of data. |
 |
 |
| Quadrant-wise count rates Data is divided into 100 sec bins |
 |
|
| Module-wise count rates for Quadrant A Data is divided into 100 sec bins |
 |
 |
| Module-wise count rates for Quadrant B Data is divided into 100 sec bins |
 |
 |
| Module-wise count rates for Quadrant C Data is divided into 100 sec bins |
 |
 |
| Module-wise count rates for Quadrant D Data is divided into 100 sec bins |
 |
 |
| Parameter | Plot |
|---|---|
| CZT HV Monitor |  |
| D_VDD |  |
| Temperature 1 |  |
| Veto HV Monitor |  |
| Veto LLD |  |
| Alpha Counter |  |
| _CPM_Rate |  |
| CZT Counter |  |
| +2.5 Volts monitor |  |
| +5 Volts monitor |  |
| _ROLL_ROT |  |
| _Roll_DEC |  |
| _Roll_RA |  |
| Veto Counter |  |