| Param | Original file | Final file |
|---|---|---|
| Filename | modeM0/AS1A09_142T01_9000003766_26058cztM0_level2.evt | modeM0/AS1A09_142T01_9000003766_26058cztM0_level2_quad_clean.evt |
| Size (bytes) | 320,538,240 | 43,104,960 |
| Size | 305.7 MB | 41.1 MB |
| Events in quadrant A | 1,687,556 | 289,443 |
| Events in quadrant B | 1,710,893 | 290,324 |
| Events in quadrant C | 1,682,795 | 276,709 |
| Events in quadrant D | 4,399,076 | 212,070 |
| Mode M9 | |||
|---|---|---|---|
| Quadrant | BADHDUFLAG | Total packets | Discarded packets |
| A | 0 | 5 | 0 |
| B | 0 | 5 | 0 |
| C | 0 | 5 | 0 |
| D | 0 | 5 | 0 |
| Mode M0 | |||
|---|---|---|---|
| Quadrant | BADHDUFLAG | Total packets | Discarded packets |
| A | 0 | 7025 | 0 |
| B | 0 | 7079 | 0 |
| C | 0 | 6979 | 0 |
| D | 0 | 15243 | 0 |
| Quadrant | Total seconds | Saturated seconds | Saturation percentage |
|---|---|---|---|
| A | 3317 | 45 | 1.356648% |
| B | 3317 | 56 | 1.688273% |
| C | 3317 | 71 | 2.140488% |
| D | 3316 | 1387 | 41.827503% |
Noise dominated data is calculated using 1-second bins in cleaned event files. If a bin has >2000 counts, and if more than 50% of those come from <1% of pixels, then it is considered to be noise-dominated and hence unusable.
| Quadrant | # 1 sec bins | Bins with >0 counts | Bins with >2000 counts | High rate bins dominated by noise | Noise dominated (total time) | Noise dominated (detector-on time) | Marked lightcurve |
|---|---|---|---|---|---|---|---|
| A | 3857 | 3317 | 0 | 0 | 0.00% | 0.00% | 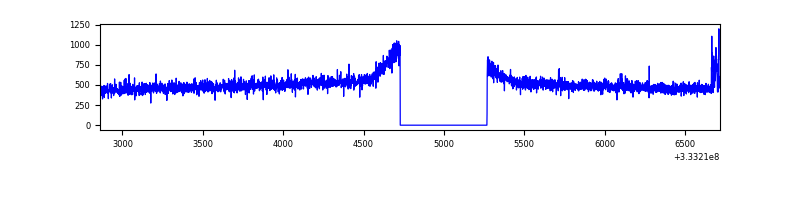 |
| B | 3857 | 3317 | 0 | 0 | 0.00% | 0.00% | 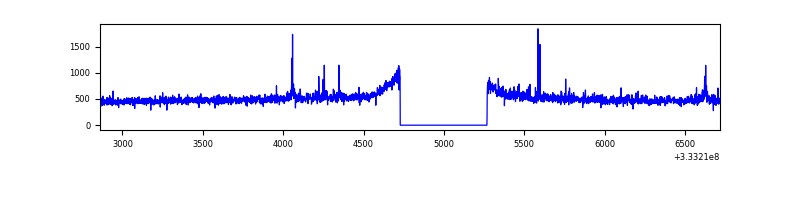 |
| C | 3857 | 3317 | 0 | 0 | 0.00% | 0.00% | 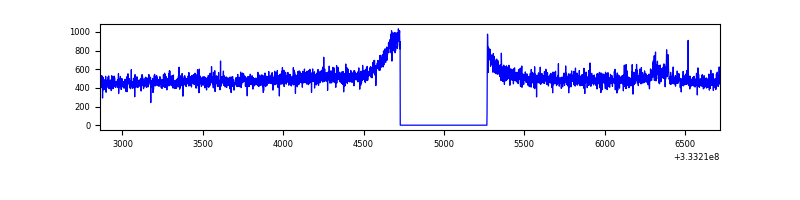 |
| D | 3855 | 3315 | 1149 | 1149 | 29.81% | 34.66% | 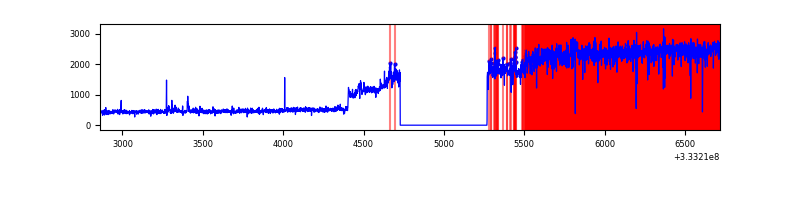 |
Top three noisy pixels from each quadrant. If the there are fewer than three noisy pixels in the level2.evt file, extra rows are filled as -1
| Pixel properties | Quadrant properties | ||||||
|---|---|---|---|---|---|---|---|
| Quadrant | DetID | PixID | Counts | Sigma | Mean | Median | Sigma |
| A | 0 | 13 | 20871 | 232.72 | 431 | 422 | 87.9 |
| A | 13 | 254 | 4716 | 48.87 | 431 | 422 | 87.9 |
| A | 3 | 137 | 3955 | 40.21 | 431 | 422 | 87.9 |
| B | 12 | 17 | 13844 | 161.7 | 423 | 411 | 83.1 |
| B | 12 | 111 | 9783 | 112.82 | 423 | 411 | 83.1 |
| B | 0 | 219 | 9549 | 110.0 | 423 | 411 | 83.1 |
| C | 14 | 238 | 63826 | 658.23 | 408 | 410 | 96.3 |
| C | 8 | 208 | 19452 | 197.65 | 408 | 410 | 96.3 |
| C | 3 | 233 | 6371 | 61.87 | 408 | 410 | 96.3 |
| D | 1 | 3 | 2787723 | 30732.78 | 369 | 359 | 90.7 |
| D | 1 | 52 | 60266 | 660.52 | 369 | 359 | 90.7 |
| D | 12 | 6 | 56260 | 616.35 | 369 | 359 | 90.7 |
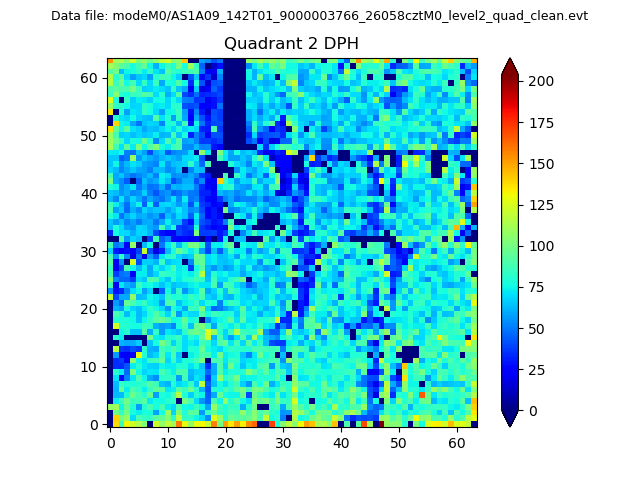
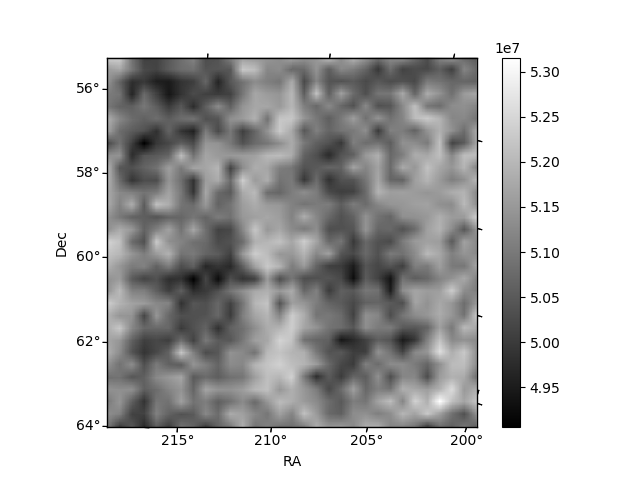
Histogram calculated using DETX and DETY for each event in the final _common_clean file
| Quadrant A |  |
 |
Quadrant B |
|---|---|---|---|
| Quadrant D | 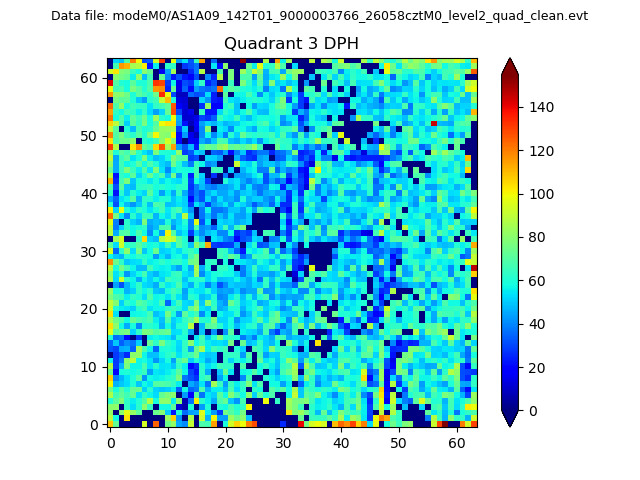 |
 |
Quadrant C |
| Plot type | Count rate plots | Images |
|---|---|---|
| Comparison with Poisson distribution Blue bars denote a histogram of data divided into 1 sec bins. Red curve is a Poisson curve with rate = median count rate of data. |
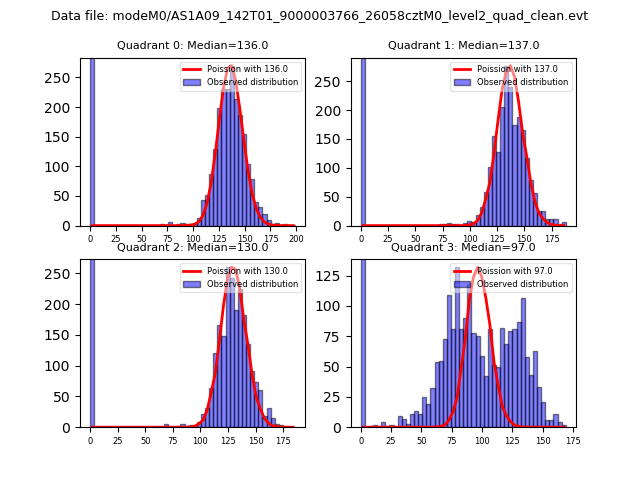 |
 |
| Quadrant-wise count rates Data is divided into 100 sec bins |
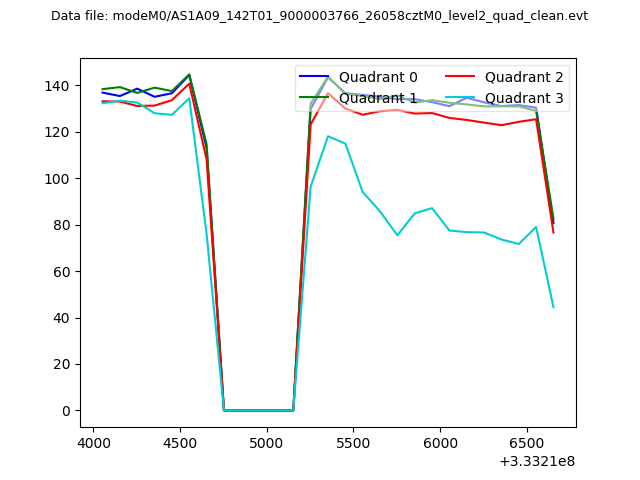 |
|
| Module-wise count rates for Quadrant A Data is divided into 100 sec bins |
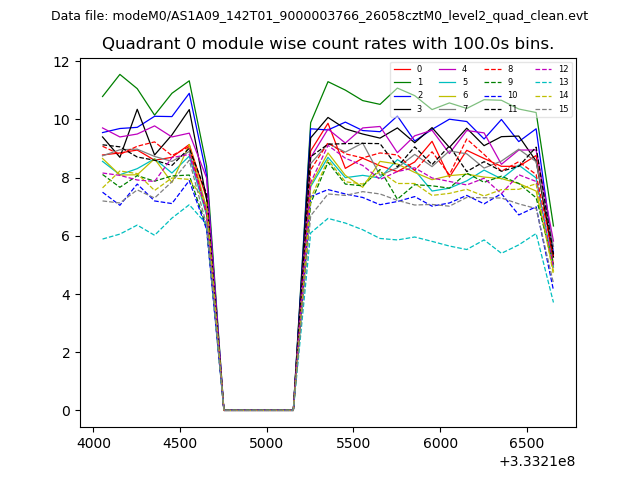 |
 |
| Module-wise count rates for Quadrant B Data is divided into 100 sec bins |
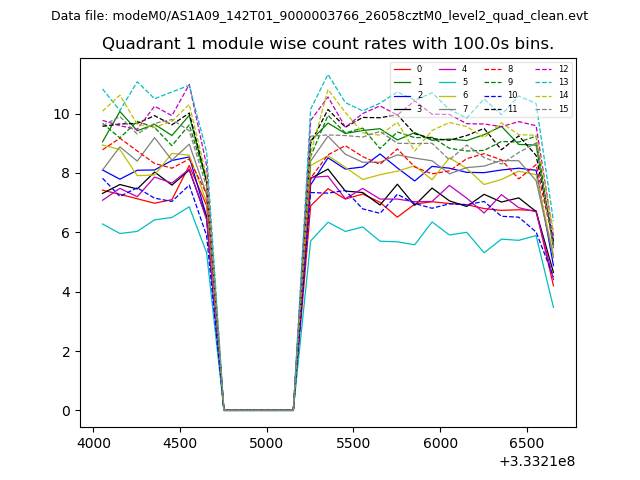 |
 |
| Module-wise count rates for Quadrant C Data is divided into 100 sec bins |
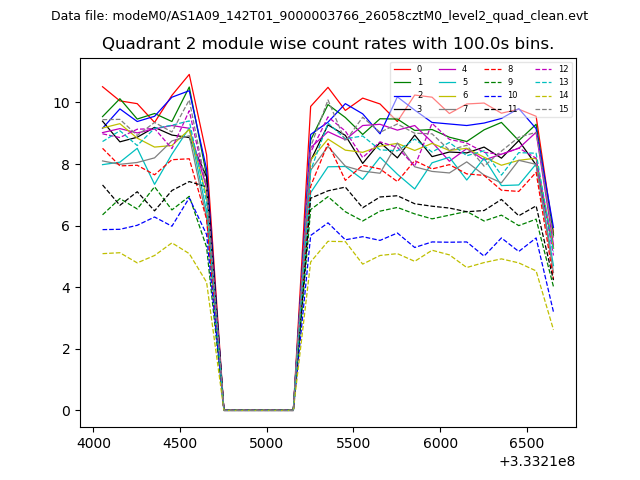 |
 |
| Module-wise count rates for Quadrant D Data is divided into 100 sec bins |
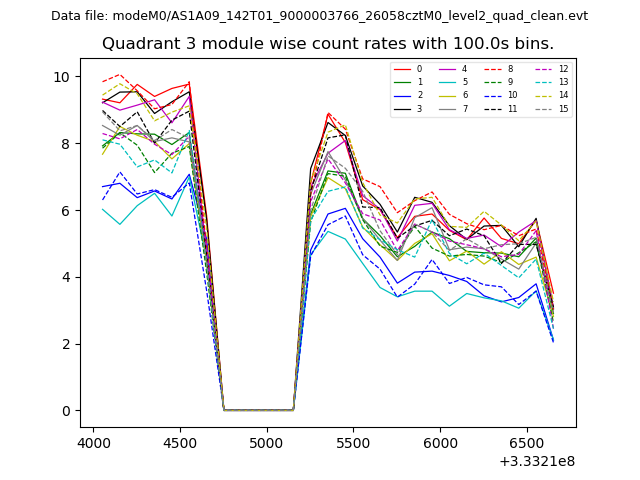 |
 |
| Parameter | Plot |
|---|---|
| CZT HV Monitor | 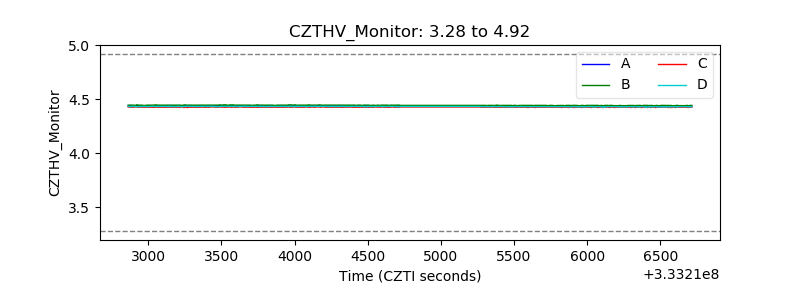 |
| D_VDD | 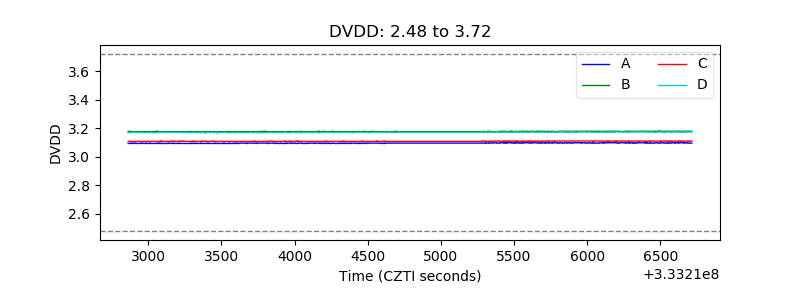 |
| Temperature 1 | 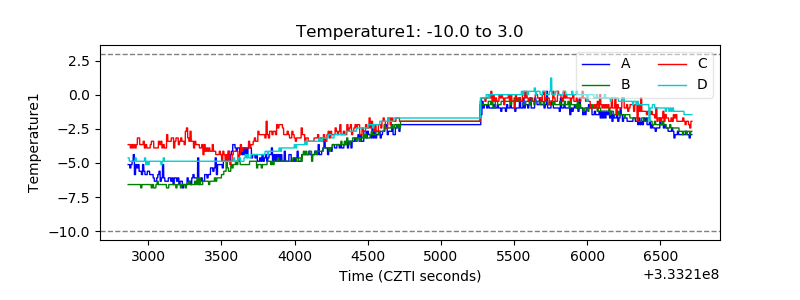 |
| Veto HV Monitor | 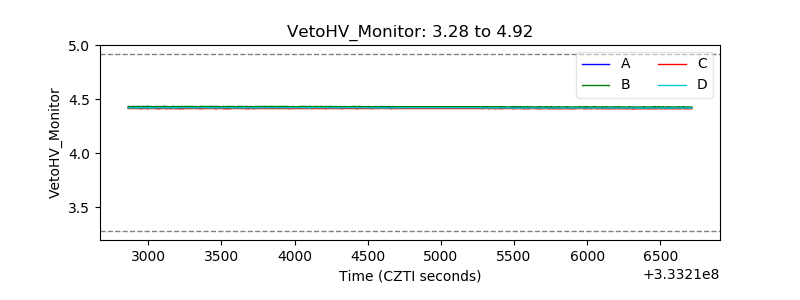 |
| Veto LLD | 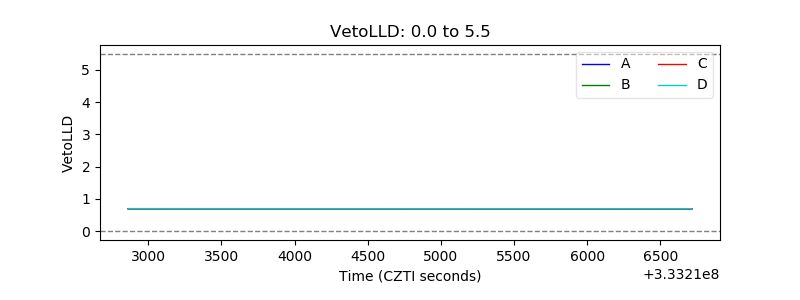 |
| Alpha Counter | 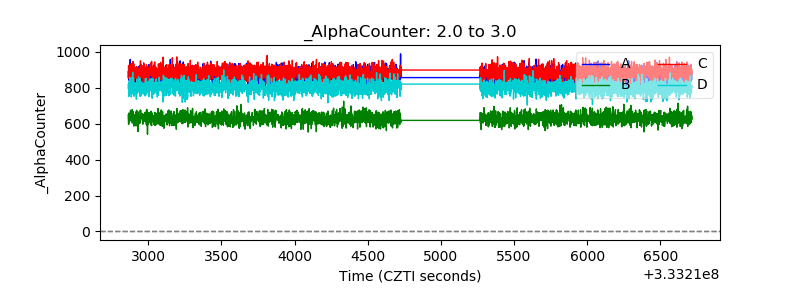 |
| _CPM_Rate |  |
| CZT Counter | 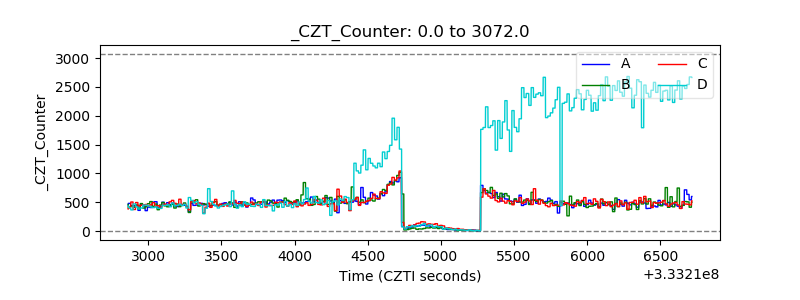 |
| +2.5 Volts monitor |  |
| +5 Volts monitor | 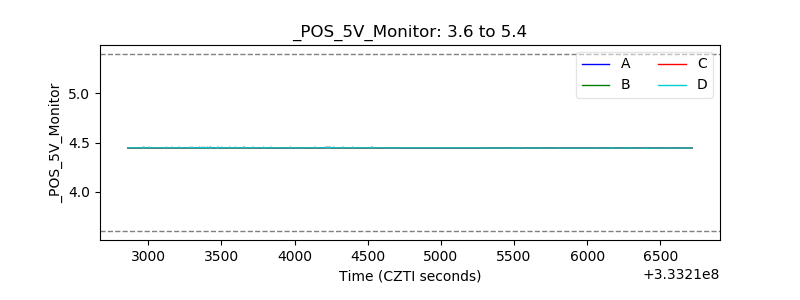 |
| _ROLL_ROT | 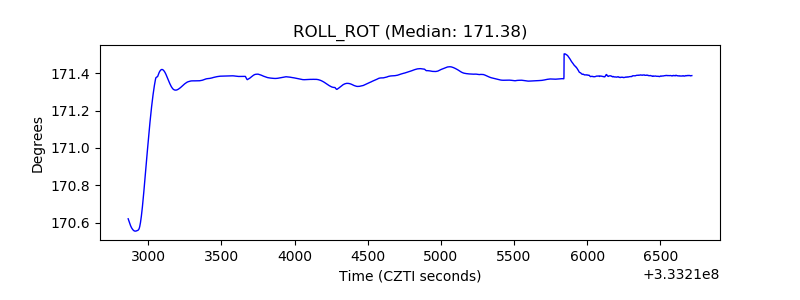 |
| _Roll_DEC | 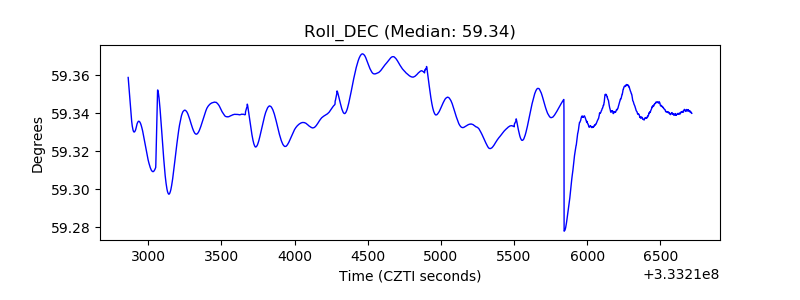 |
| _Roll_RA | 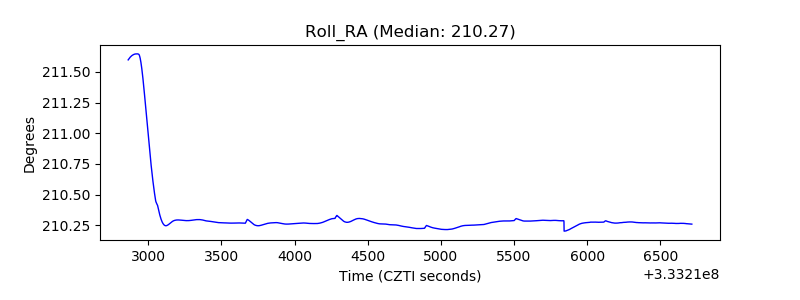 |
| Veto Counter | 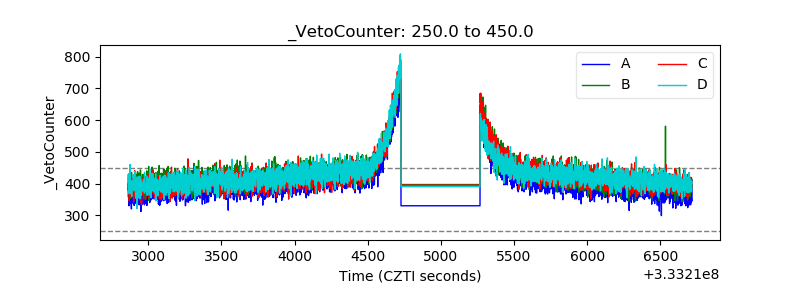 |