| Param | Original file | Final file |
|---|---|---|
| Filename | modeM0/AS1A09_142T01_9000003766_26060cztM0_level2.evt | modeM0/AS1A09_142T01_9000003766_26060cztM0_level2_quad_clean.evt |
| Size (bytes) | 547,799,040 | 105,390,720 |
| Size | 522.4 MB | 100.5 MB |
| Events in quadrant A | 3,332,103 | 700,280 |
| Events in quadrant B | 3,499,428 | 701,679 |
| Events in quadrant C | 3,366,244 | 668,045 |
| Events in quadrant D | 5,904,900 | 621,304 |
| Mode M9 | |||
|---|---|---|---|
| Quadrant | BADHDUFLAG | Total packets | Discarded packets |
| A | 0 | 3 | 0 |
| B | 0 | 3 | 0 |
| C | 0 | 3 | 0 |
| D | 0 | 3 | 0 |
| Mode M0 | |||
|---|---|---|---|
| Quadrant | BADHDUFLAG | Total packets | Discarded packets |
| A | 0 | 14692 | 0 |
| B | 0 | 15243 | 0 |
| C | 0 | 14676 | 0 |
| D | 0 | 22489 | 0 |
| Quadrant | Total seconds | Saturated seconds | Saturation percentage |
|---|---|---|---|
| A | 7179 | 29 | 0.403956% |
| B | 7180 | 61 | 0.849582% |
| C | 7180 | 78 | 1.086351% |
| D | 7180 | 747 | 10.403900% |
Noise dominated data is calculated using 1-second bins in cleaned event files. If a bin has >2000 counts, and if more than 50% of those come from <1% of pixels, then it is considered to be noise-dominated and hence unusable.
| Quadrant | # 1 sec bins | Bins with >0 counts | Bins with >2000 counts | High rate bins dominated by noise | Noise dominated (total time) | Noise dominated (detector-on time) | Marked lightcurve |
|---|---|---|---|---|---|---|---|
| A | 7494 | 7180 | 1 | 1 | 0.01% | 0.01% | 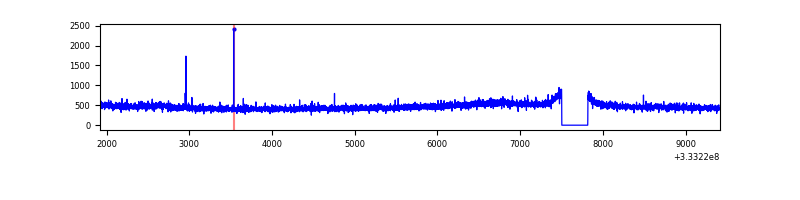 |
| B | 7495 | 7180 | 6 | 6 | 0.08% | 0.08% | 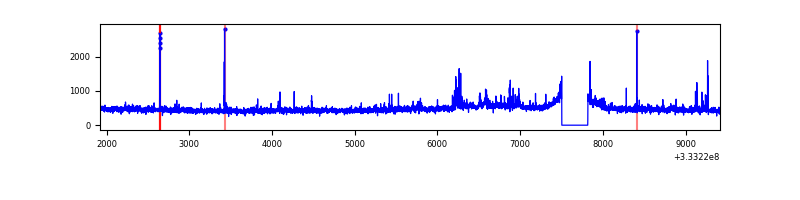 |
| C | 7495 | 7181 | 2 | 2 | 0.03% | 0.03% | 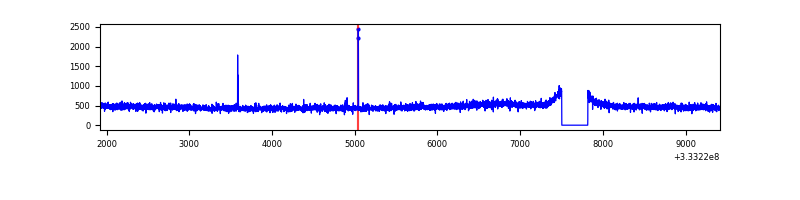 |
| D | 7495 | 7181 | 698 | 698 | 9.31% | 9.72% | 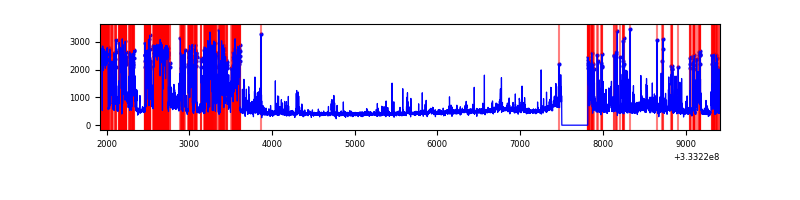 |
Top three noisy pixels from each quadrant. If the there are fewer than three noisy pixels in the level2.evt file, extra rows are filled as -1
| Pixel properties | Quadrant properties | ||||||
|---|---|---|---|---|---|---|---|
| Quadrant | DetID | PixID | Counts | Sigma | Mean | Median | Sigma |
| A | 0 | 13 | 26144 | 146.94 | 853 | 833 | 172.3 |
| A | 13 | 254 | 12645 | 68.57 | 853 | 833 | 172.3 |
| A | 7 | 16 | 8450 | 44.22 | 853 | 833 | 172.3 |
| B | 0 | 229 | 64851 | 395.63 | 846 | 823 | 161.8 |
| B | 5 | 172 | 38400 | 232.19 | 846 | 823 | 161.8 |
| B | 0 | 190 | 33380 | 201.17 | 846 | 823 | 161.8 |
| C | 14 | 238 | 129187 | 664.2 | 821 | 826 | 193.3 |
| C | 2 | 16 | 16072 | 78.89 | 821 | 826 | 193.3 |
| C | 8 | 128 | 8914 | 41.85 | 821 | 826 | 193.3 |
| D | 7 | 38 | 1337947 | 6545.56 | 795 | 774 | 204.3 |
| D | 1 | 3 | 703824 | 3441.48 | 795 | 774 | 204.3 |
| D | 1 | 52 | 491773 | 2403.48 | 795 | 774 | 204.3 |
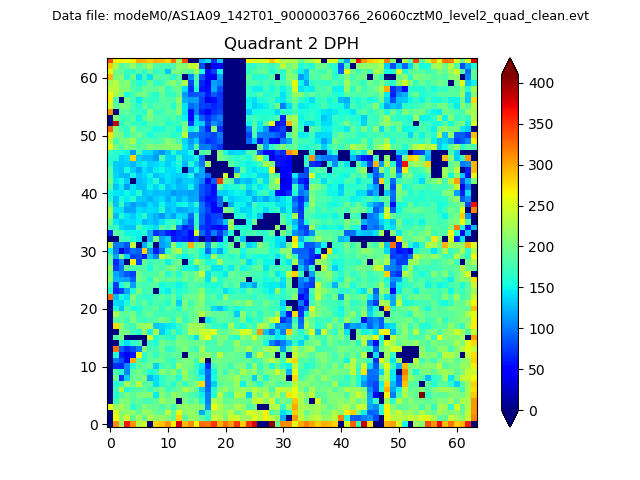
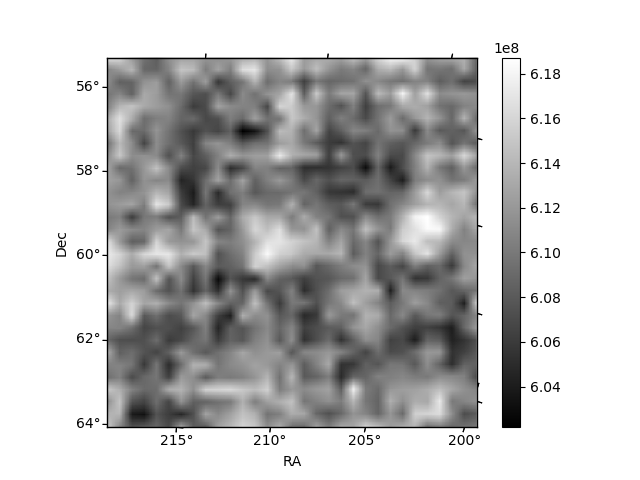
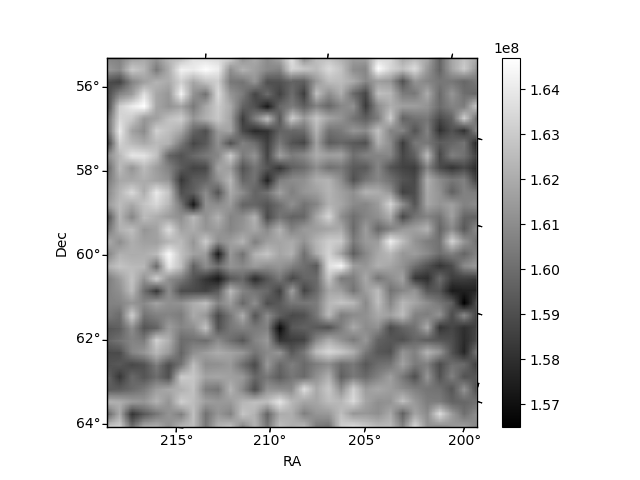
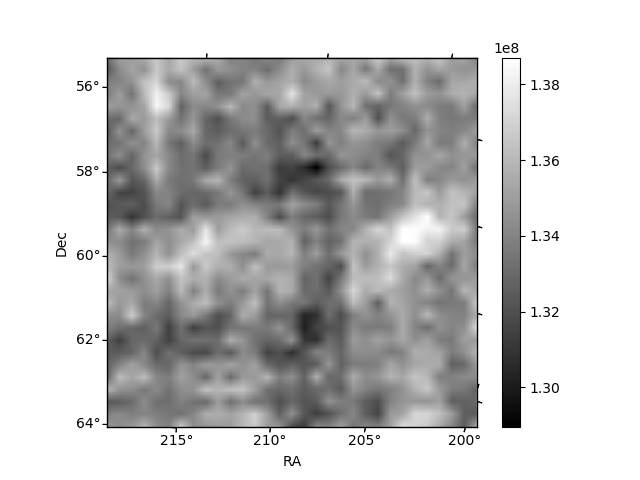
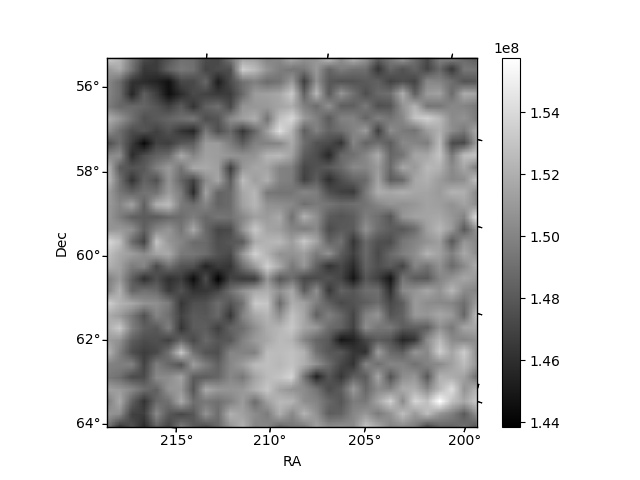
Histogram calculated using DETX and DETY for each event in the final _common_clean file
| Quadrant A | 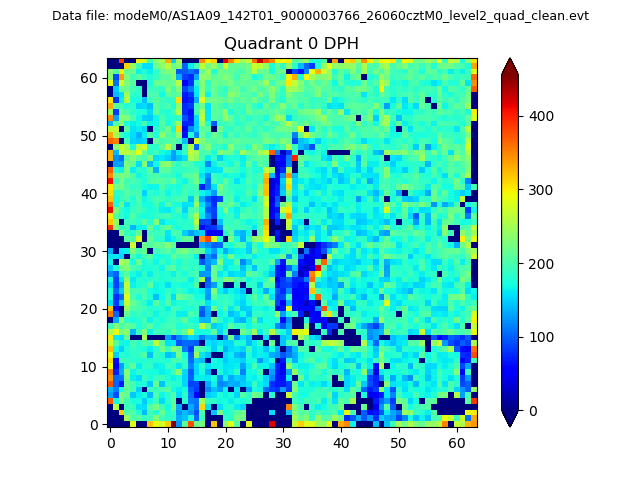 |
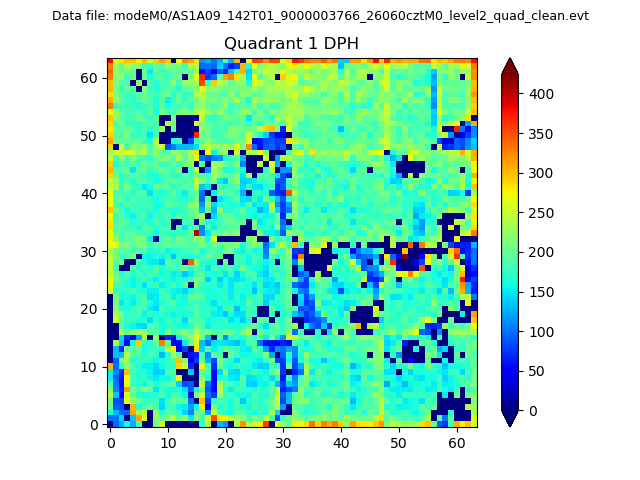 |
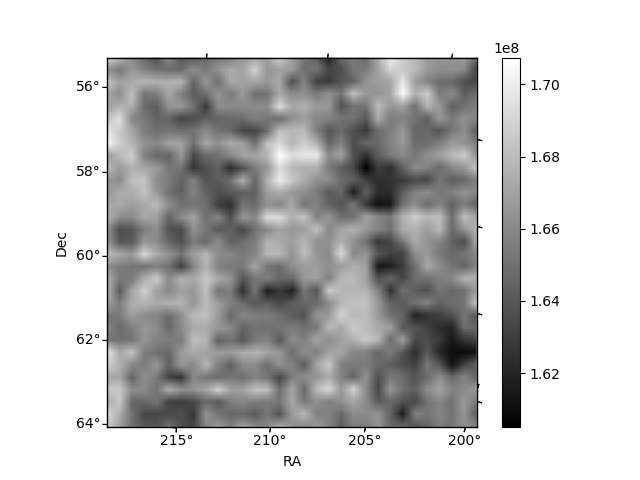
Quadrant B |
|---|---|---|---|
| Quadrant D | 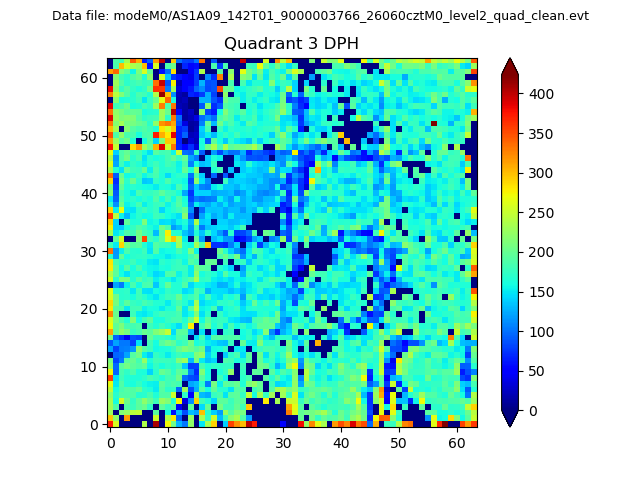 |
 |
Quadrant C |
| Plot type | Count rate plots | Images |
|---|---|---|
| Comparison with Poisson distribution Blue bars denote a histogram of data divided into 1 sec bins. Red curve is a Poisson curve with rate = median count rate of data. |
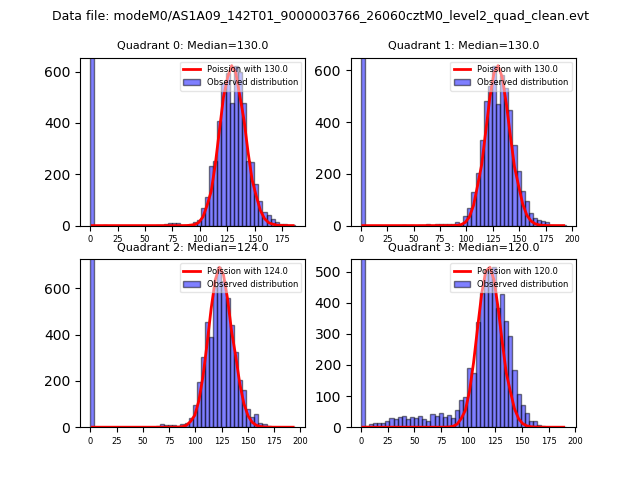 |
 |
| Quadrant-wise count rates Data is divided into 100 sec bins |
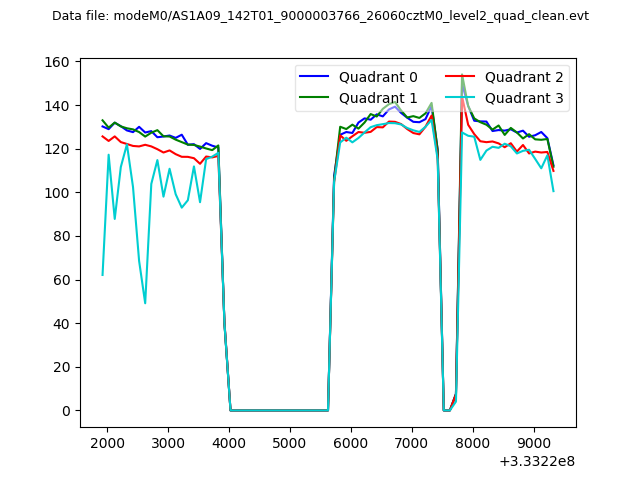 |
|
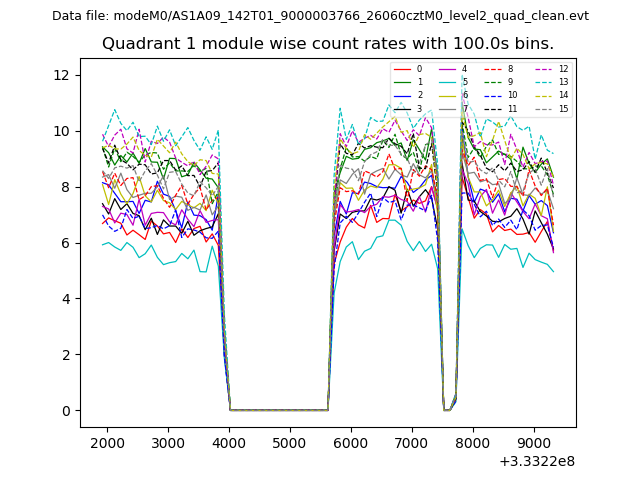
| Module-wise count rates for Quadrant A Data is divided into 100 sec bins |
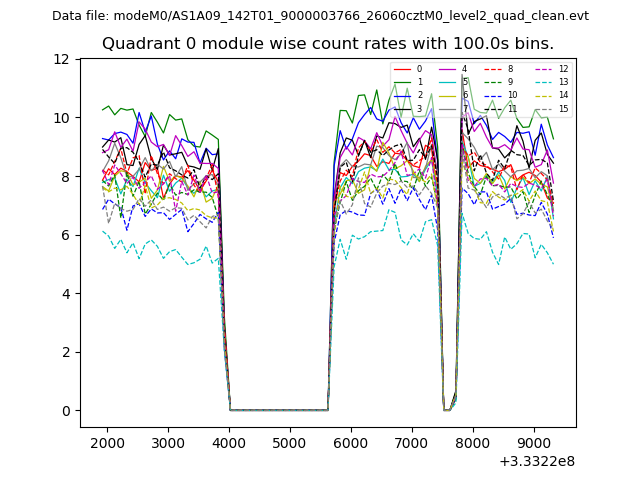 |
 |
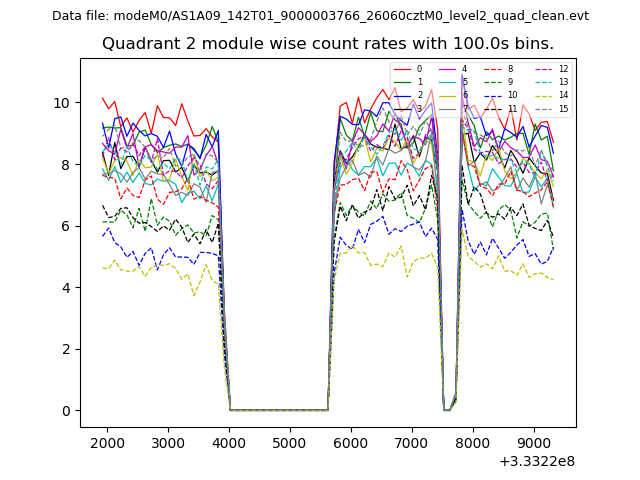
| Module-wise count rates for Quadrant B Data is divided into 100 sec bins |
 |
 |
| Module-wise count rates for Quadrant C Data is divided into 100 sec bins |
 |
 |
| Module-wise count rates for Quadrant D Data is divided into 100 sec bins |
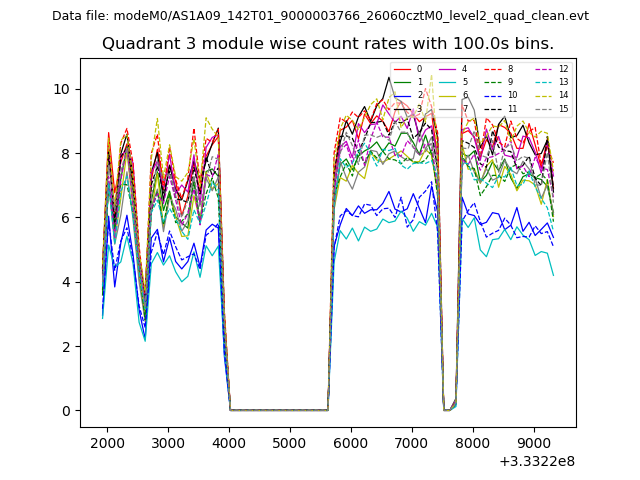 |
 |
| Parameter | Plot |
|---|---|
| CZT HV Monitor |  |
| D_VDD | 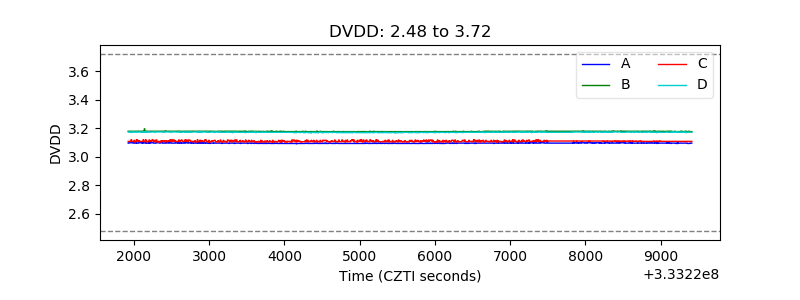 |
| Temperature 1 | 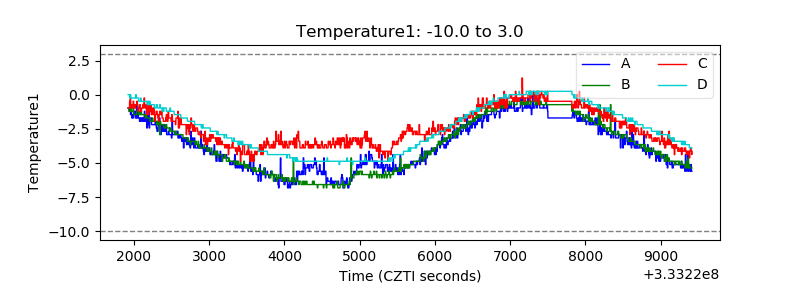 |
| Veto HV Monitor | 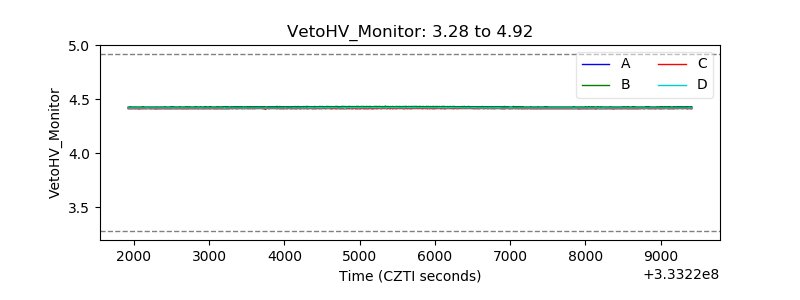 |
| Veto LLD | 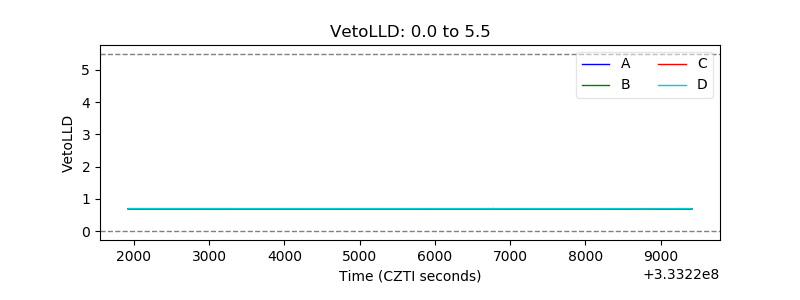 |
| Alpha Counter | 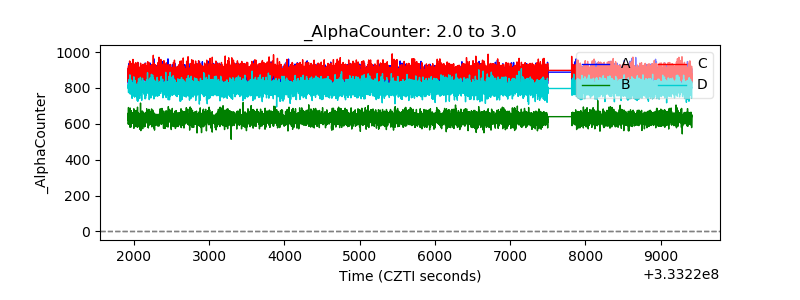 |
| _CPM_Rate | 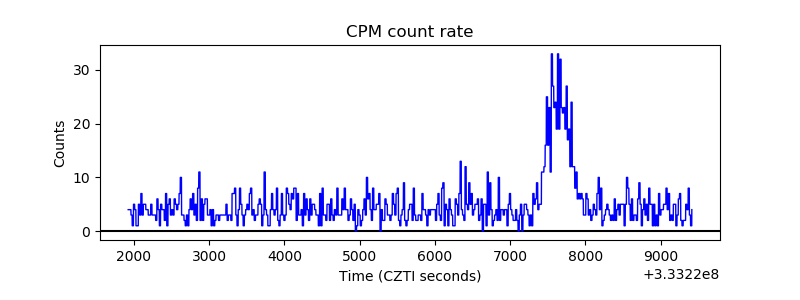 |
| CZT Counter | 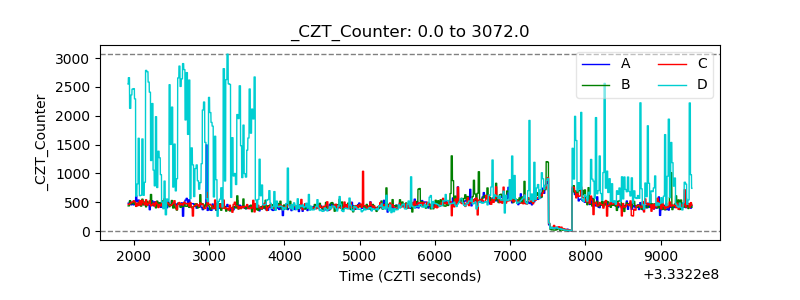 |
| +2.5 Volts monitor |  |
| +5 Volts monitor |  |
| _ROLL_ROT | 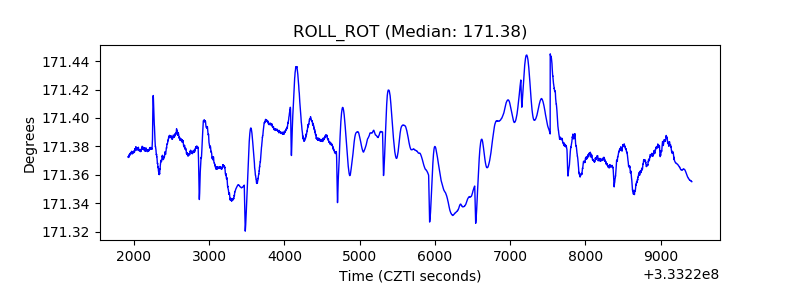 |
| _Roll_DEC |  |
| _Roll_RA | 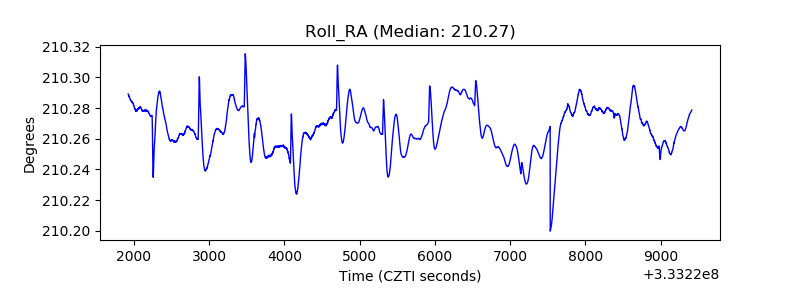 |
| Veto Counter | 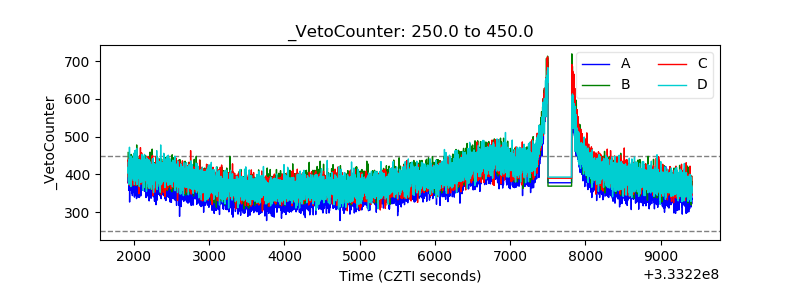 |