| Param | Original file | Final file |
|---|---|---|
| Filename | modeM0/AS1A09_142T01_9000003766_26063cztM0_level2.evt | modeM0/AS1A09_142T01_9000003766_26063cztM0_level2_quad_clean.evt |
| Size (bytes) | 1,693,964,160 | 232,732,800 |
| Size | 1.6 GB | 222.0 MB |
| Events in quadrant A | 8,459,560 | 1,579,868 |
| Events in quadrant B | 8,851,909 | 1,583,917 |
| Events in quadrant C | 8,650,337 | 1,518,446 |
| Events in quadrant D | 24,096,051 | 1,094,261 |
| Mode M9 | |||
|---|---|---|---|
| Quadrant | BADHDUFLAG | Total packets | Discarded packets |
| A | 0 | 20 | 0 |
| B | 0 | 21 | 0 |
| C | 0 | 21 | 0 |
| D | 0 | 21 | 0 |
| Mode M0 | |||
|---|---|---|---|
| Quadrant | BADHDUFLAG | Total packets | Discarded packets |
| A | 0 | 37446 | 0 |
| B | 0 | 38400 | 0 |
| C | 0 | 37696 | 0 |
| D | 0 | 84512 | 0 |
| Quadrant | Total seconds | Saturated seconds | Saturation percentage |
|---|---|---|---|
| A | 18429 | 54 | 0.293016% |
| B | 18429 | 150 | 0.813935% |
| C | 18429 | 178 | 0.965869% |
| D | 18429 | 5978 | 32.438005% |
Noise dominated data is calculated using 1-second bins in cleaned event files. If a bin has >2000 counts, and if more than 50% of those come from <1% of pixels, then it is considered to be noise-dominated and hence unusable.
| Quadrant | # 1 sec bins | Bins with >0 counts | Bins with >2000 counts | High rate bins dominated by noise | Noise dominated (total time) | Noise dominated (detector-on time) | Marked lightcurve |
|---|---|---|---|---|---|---|---|
| A | 20494 | 18431 | 0 | 0 | 0.00% | 0.00% | 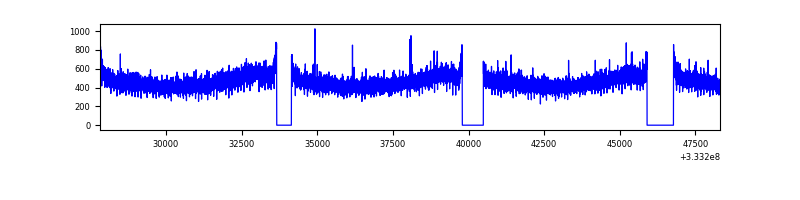 |
| B | 20494 | 18431 | 28 | 28 | 0.14% | 0.15% | 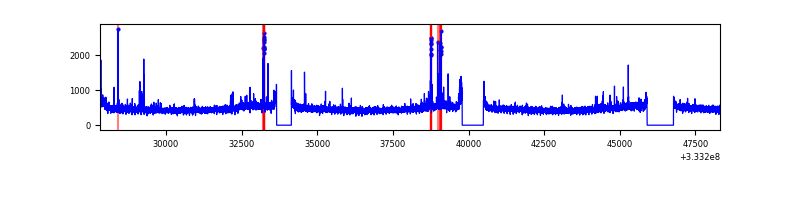 |
| C | 20494 | 18431 | 0 | 0 | 0.00% | 0.00% | 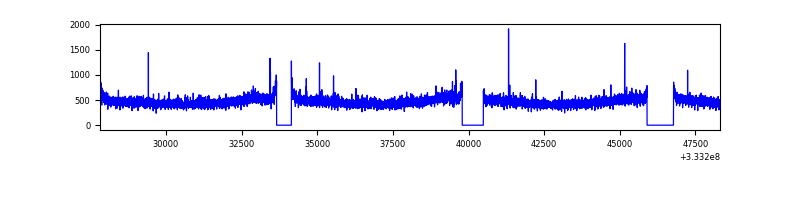 |
| D | 20493 | 18428 | 5835 | 5835 | 28.47% | 31.66% | 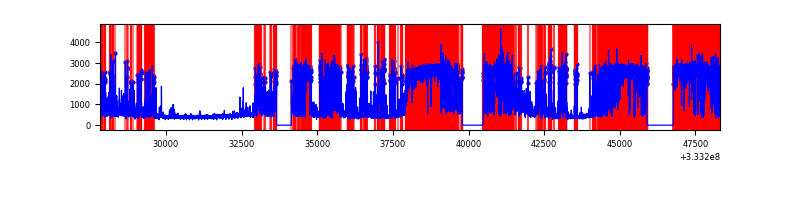 |
Top three noisy pixels from each quadrant. If the there are fewer than three noisy pixels in the level2.evt file, extra rows are filled as -1
| Pixel properties | Quadrant properties | ||||||
|---|---|---|---|---|---|---|---|
| Quadrant | DetID | PixID | Counts | Sigma | Mean | Median | Sigma |
| A | 13 | 254 | 32666 | 69.49 | 2189 | 2137 | 439.3 |
| A | 3 | 137 | 20133 | 40.97 | 2189 | 2137 | 439.3 |
| A | 0 | 226 | 18673 | 37.64 | 2189 | 2137 | 439.3 |
| B | 5 | 172 | 159959 | 382.07 | 2179 | 2123 | 413.1 |
| B | 0 | 190 | 86851 | 205.1 | 2179 | 2123 | 413.1 |
| B | 12 | 111 | 50380 | 116.81 | 2179 | 2123 | 413.1 |
| C | 14 | 238 | 336635 | 678.85 | 2105 | 2120 | 492.8 |
| C | 3 | 233 | 74195 | 146.27 | 2105 | 2120 | 492.8 |
| C | 2 | 16 | 22488 | 41.33 | 2105 | 2120 | 492.8 |
| D | 1 | 3 | 14685364 | 34741.63 | 1708 | 1670 | 422.7 |
| D | 1 | 52 | 2035787 | 4812.72 | 1708 | 1670 | 422.7 |
| D | 7 | 38 | 494943 | 1167.08 | 1708 | 1670 | 422.7 |
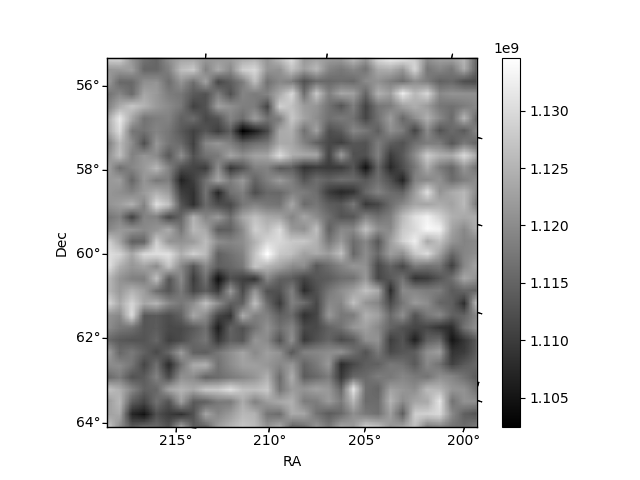
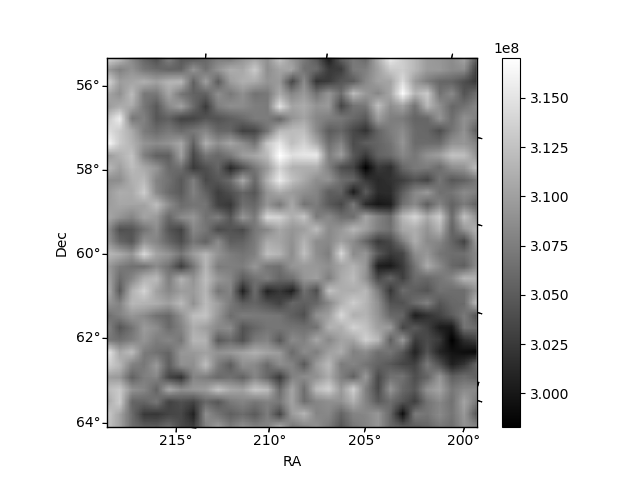
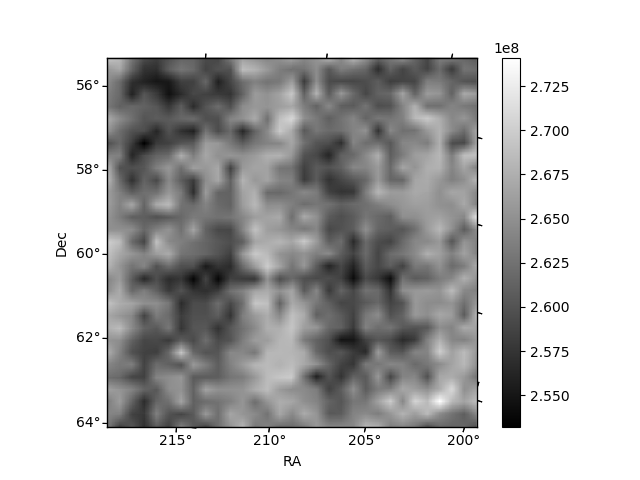
Histogram calculated using DETX and DETY for each event in the final _common_clean file
| Quadrant A | 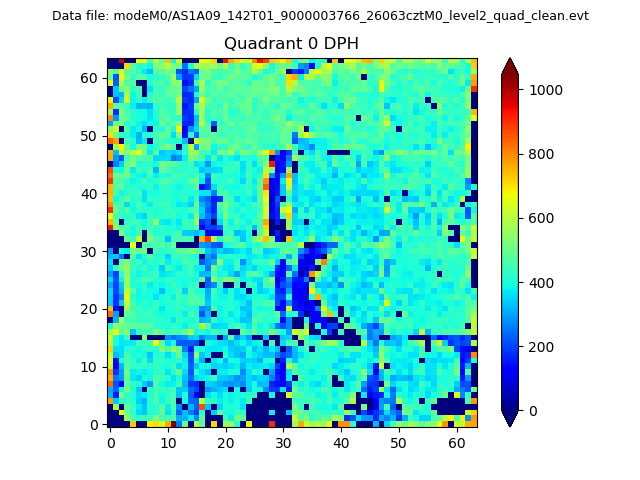 |
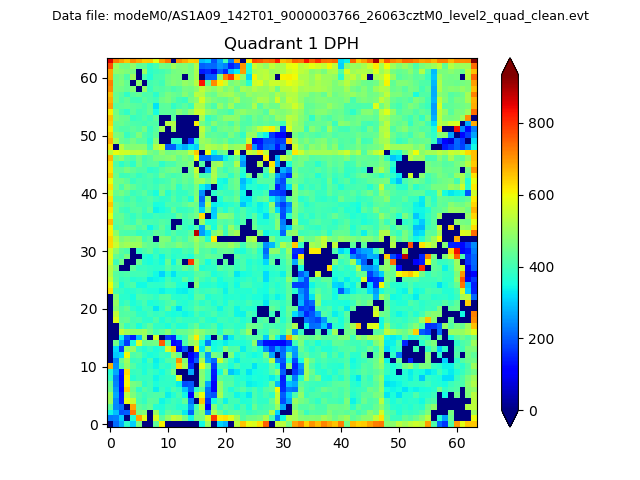 |
Quadrant B |
|---|---|---|---|
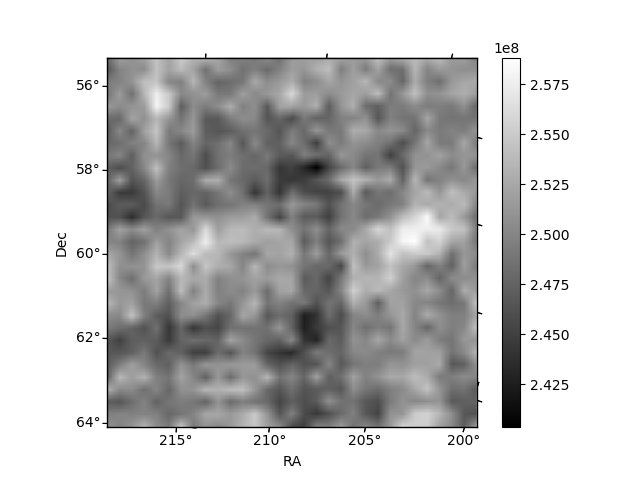
| Quadrant D |  |
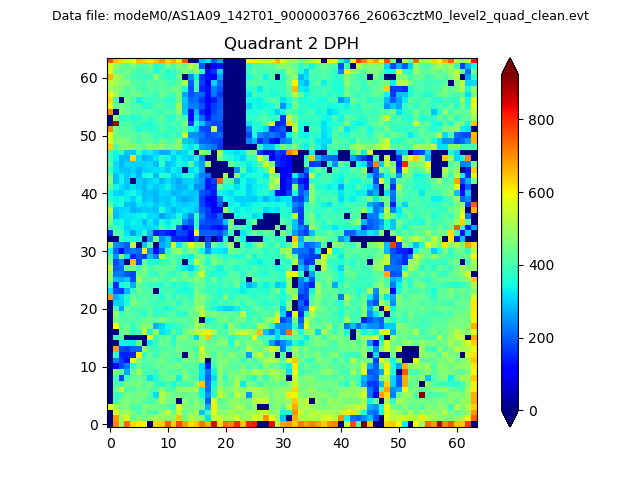 |
Quadrant C |
| Plot type | Count rate plots | Images |
|---|---|---|
| Comparison with Poisson distribution Blue bars denote a histogram of data divided into 1 sec bins. Red curve is a Poisson curve with rate = median count rate of data. |
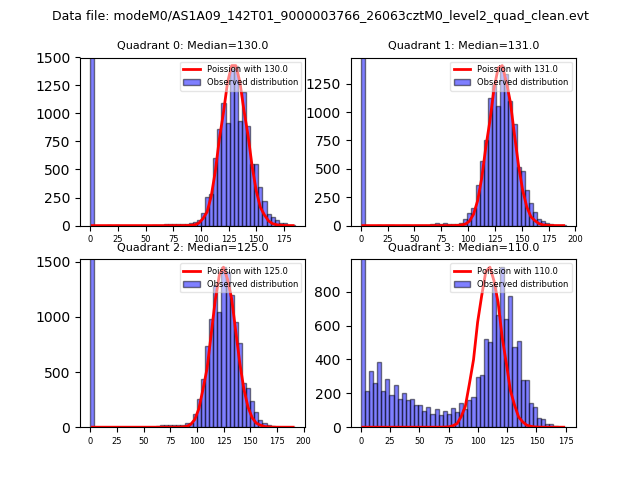 |
 |
| Quadrant-wise count rates Data is divided into 100 sec bins |
 |
|
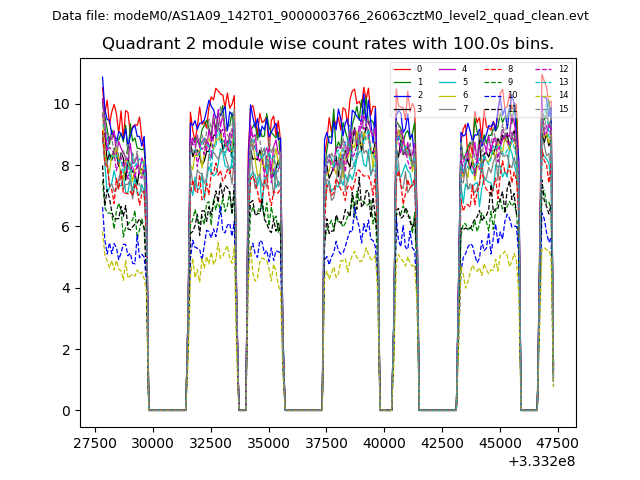
| Module-wise count rates for Quadrant A Data is divided into 100 sec bins |
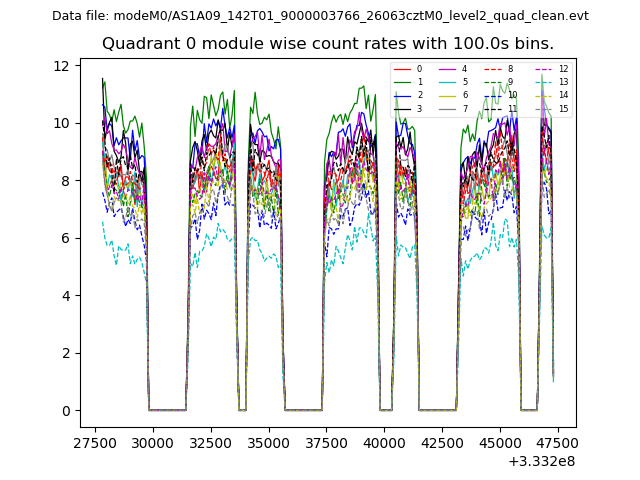 |
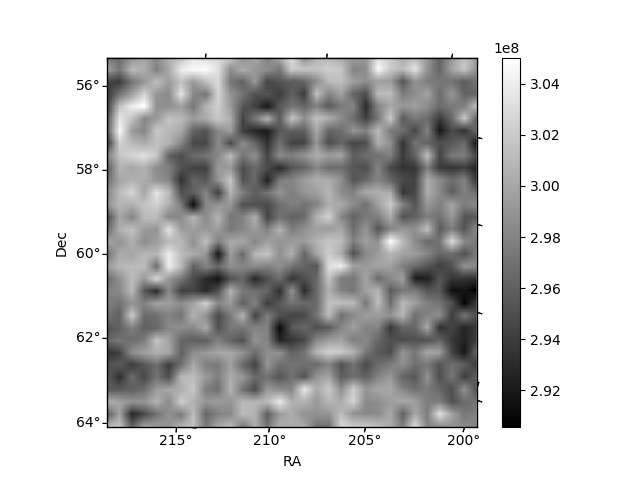 |
| Module-wise count rates for Quadrant B Data is divided into 100 sec bins |
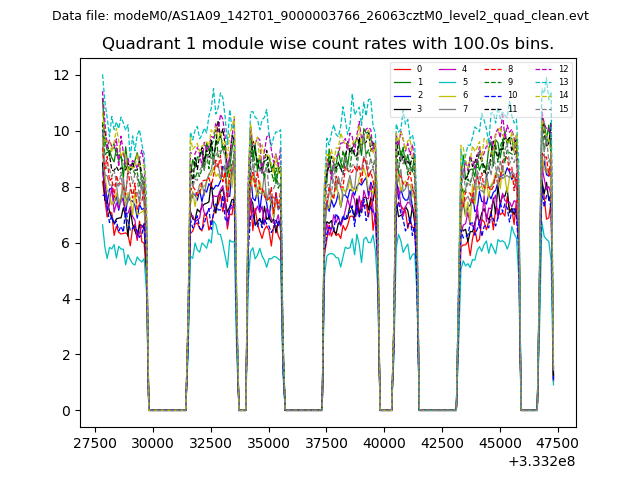 |
 |
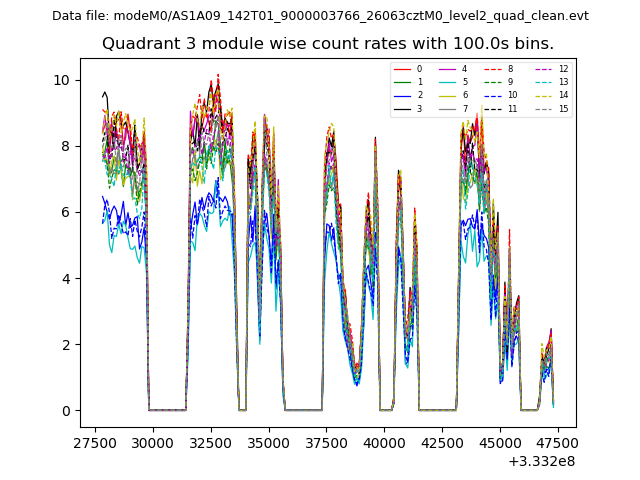
| Module-wise count rates for Quadrant C Data is divided into 100 sec bins |
 |
 |
| Module-wise count rates for Quadrant D Data is divided into 100 sec bins |
 |
 |
| Parameter | Plot |
|---|---|
| CZT HV Monitor | 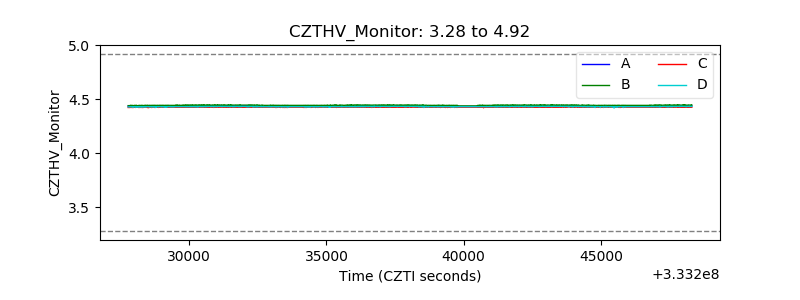 |
| D_VDD | 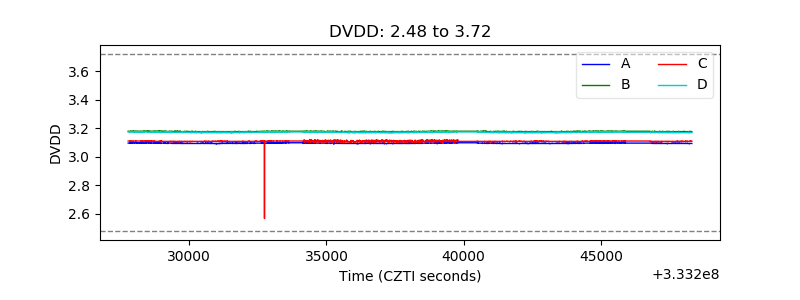 |
| Temperature 1 | 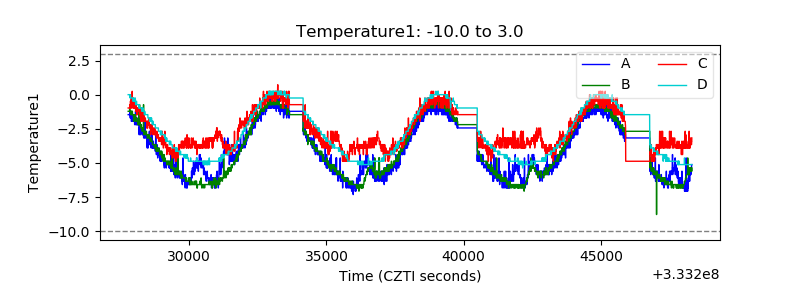 |
| Veto HV Monitor |  |
| Veto LLD | 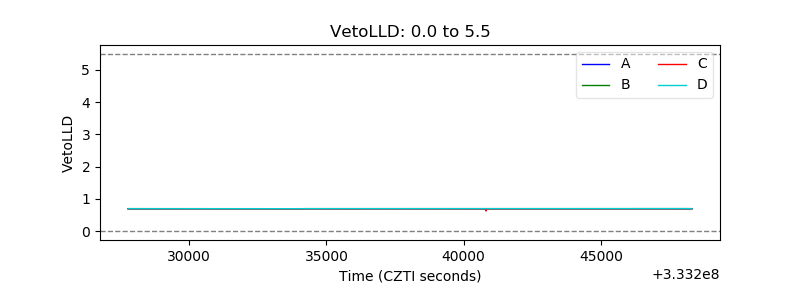 |
| Alpha Counter | 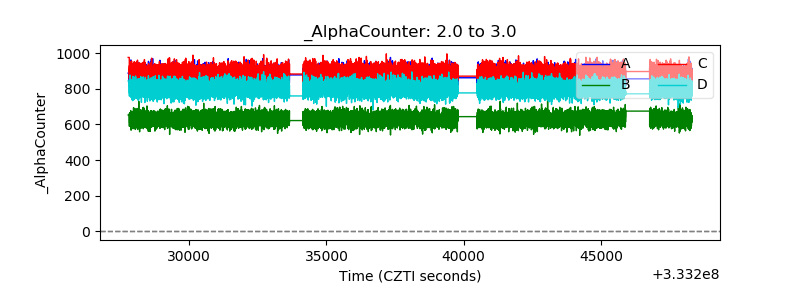 |
| _CPM_Rate |  |
| CZT Counter | 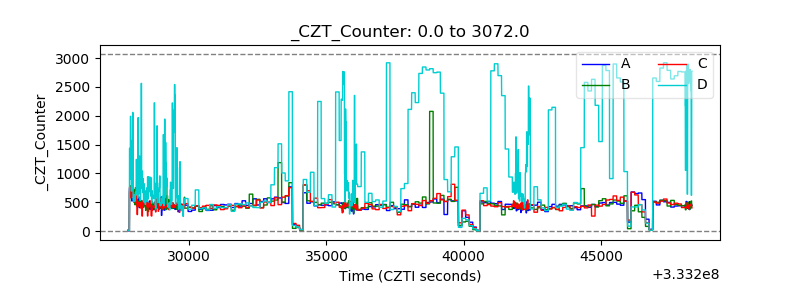 |
| +2.5 Volts monitor | 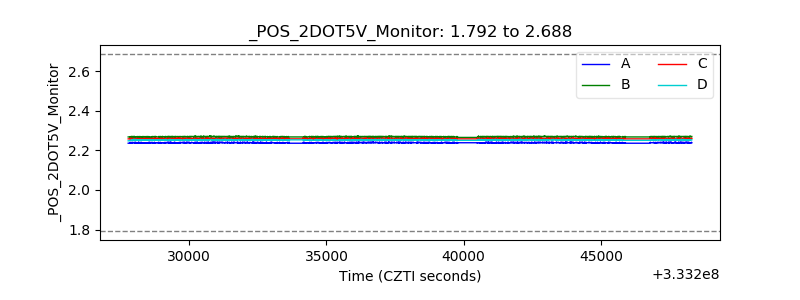 |
| +5 Volts monitor |  |
| _ROLL_ROT | 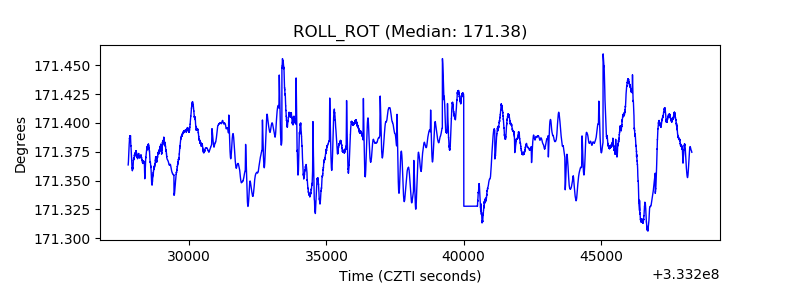 |
| _Roll_DEC | 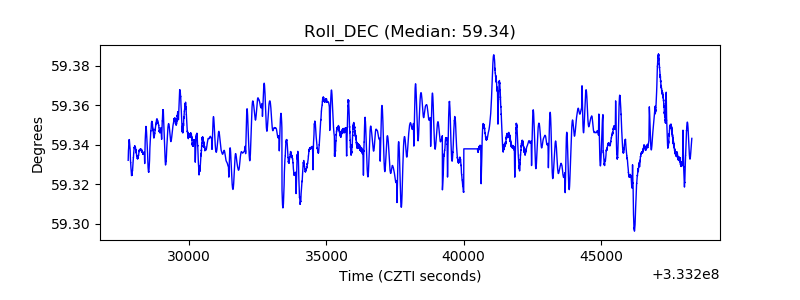 |
| _Roll_RA | 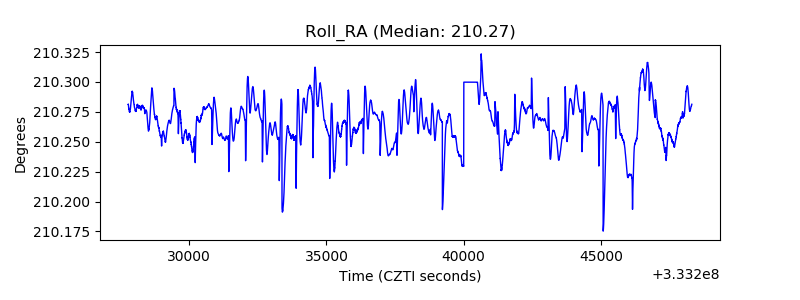 |
| Veto Counter | 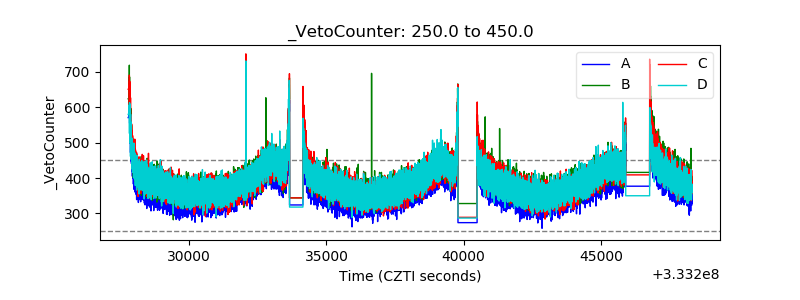 |