| Param | Original file | Final file |
|---|---|---|
| Filename | modeM0/AS1A09_142T01_9000003766_26066cztM0_level2.evt | modeM0/AS1A09_142T01_9000003766_26066cztM0_level2_quad_clean.evt |
| Size (bytes) | 850,806,720 | 64,152,000 |
| Size | 811.4 MB | 61.2 MB |
| Events in quadrant A | 3,218,753 | 449,911 |
| Events in quadrant B | 3,268,644 | 451,685 |
| Events in quadrant C | 3,210,539 | 427,995 |
| Events in quadrant D | 15,630,449 | 159,422 |
| Mode M9 | |||
|---|---|---|---|
| Quadrant | BADHDUFLAG | Total packets | Discarded packets |
| A | 0 | 11 | 0 |
| B | 0 | 12 | 0 |
| C | 0 | 12 | 0 |
| D | 0 | 12 | 0 |
| Mode M0 | |||
|---|---|---|---|
| Quadrant | BADHDUFLAG | Total packets | Discarded packets |
| A | 0 | 13580 | 0 |
| B | 0 | 13757 | 0 |
| C | 0 | 13598 | 0 |
| D | 0 | 50776 | 0 |
| Quadrant | Total seconds | Saturated seconds | Saturation percentage |
|---|---|---|---|
| A | 6470 | 57 | 0.880989% |
| B | 6470 | 68 | 1.051005% |
| C | 6470 | 96 | 1.483771% |
| D | 6470 | 5623 | 86.908810% |
Noise dominated data is calculated using 1-second bins in cleaned event files. If a bin has >2000 counts, and if more than 50% of those come from <1% of pixels, then it is considered to be noise-dominated and hence unusable.
| Quadrant | # 1 sec bins | Bins with >0 counts | Bins with >2000 counts | High rate bins dominated by noise | Noise dominated (total time) | Noise dominated (detector-on time) | Marked lightcurve |
|---|---|---|---|---|---|---|---|
| A | 7625 | 6470 | 0 | 0 | 0.00% | 0.00% | 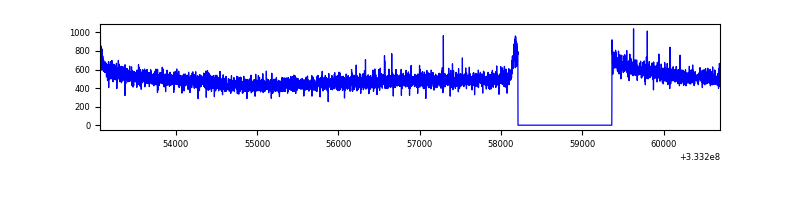 |
| B | 7625 | 6470 | 5 | 5 | 0.07% | 0.08% | 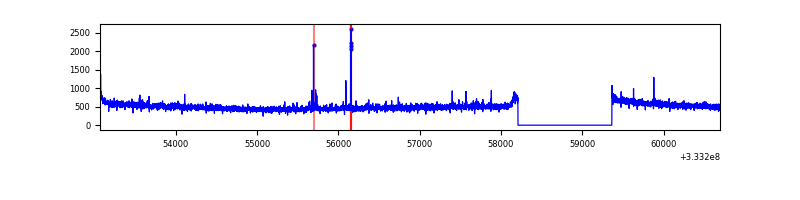 |
| C | 7625 | 6470 | 0 | 0 | 0.00% | 0.00% | 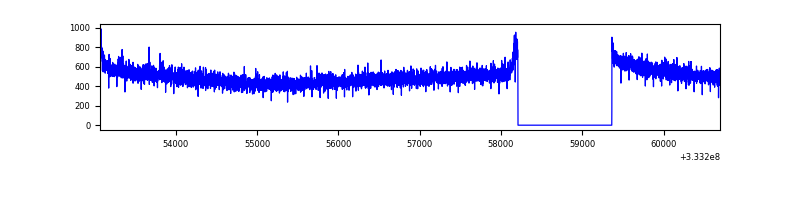 |
| D | 7624 | 6469 | 5576 | 5576 | 73.14% | 86.20% | 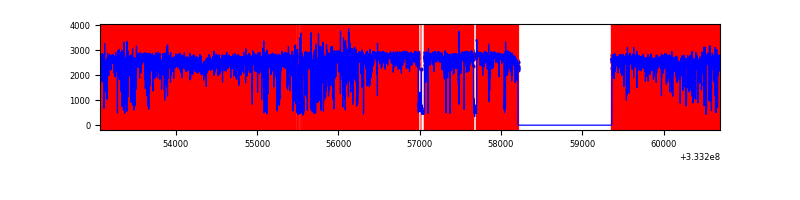 |
Top three noisy pixels from each quadrant. If the there are fewer than three noisy pixels in the level2.evt file, extra rows are filled as -1
| Pixel properties | Quadrant properties | ||||||
|---|---|---|---|---|---|---|---|
| Quadrant | DetID | PixID | Counts | Sigma | Mean | Median | Sigma |
| A | 13 | 254 | 11427 | 63.99 | 833 | 816 | 165.8 |
| A | 0 | 226 | 7317 | 39.2 | 833 | 816 | 165.8 |
| A | 3 | 137 | 7148 | 38.18 | 833 | 816 | 165.8 |
| B | 12 | 111 | 18668 | 113.82 | 826 | 806 | 156.9 |
| B | 11 | 111 | 16791 | 101.86 | 826 | 806 | 156.9 |
| B | 14 | 111 | 14734 | 88.75 | 826 | 806 | 156.9 |
| C | 14 | 238 | 128626 | 702.02 | 788 | 793 | 182.1 |
| C | 3 | 233 | 7107 | 34.67 | 788 | 793 | 182.1 |
| C | 13 | 61 | 5523 | 25.97 | 788 | 793 | 182.1 |
| D | 1 | 3 | 13620196 | 126892.28 | 439 | 429 | 107.3 |
| D | 1 | 52 | 250789 | 2332.55 | 439 | 429 | 107.3 |
| D | 12 | 233 | 39055 | 359.87 | 439 | 429 | 107.3 |
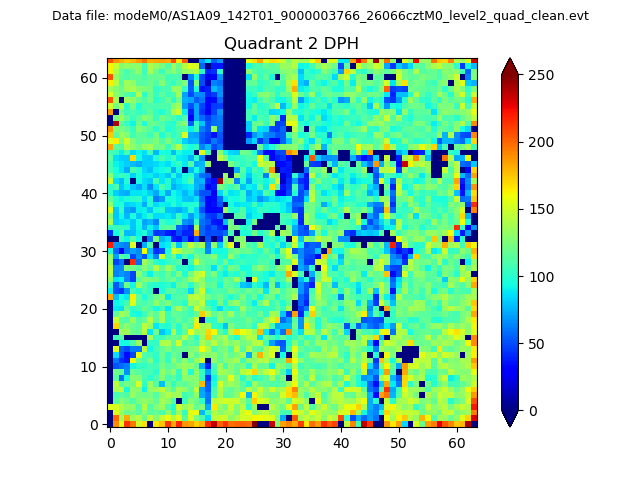
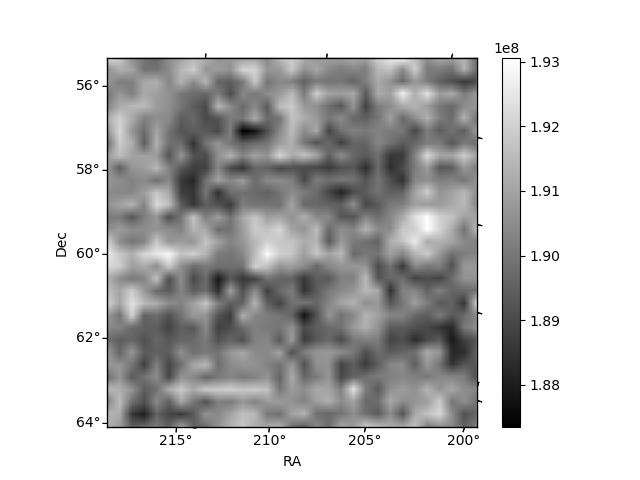
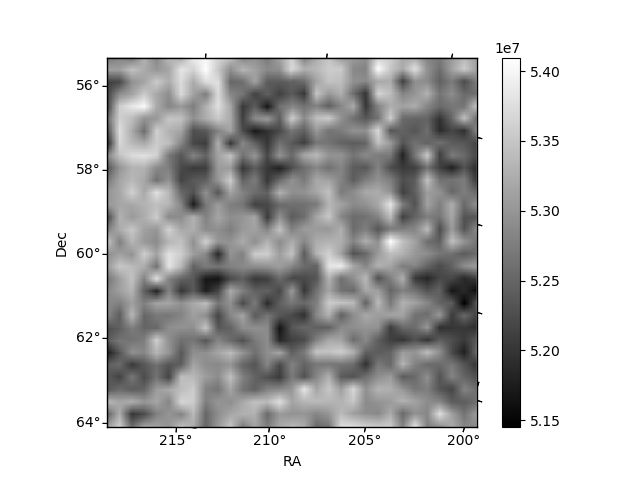
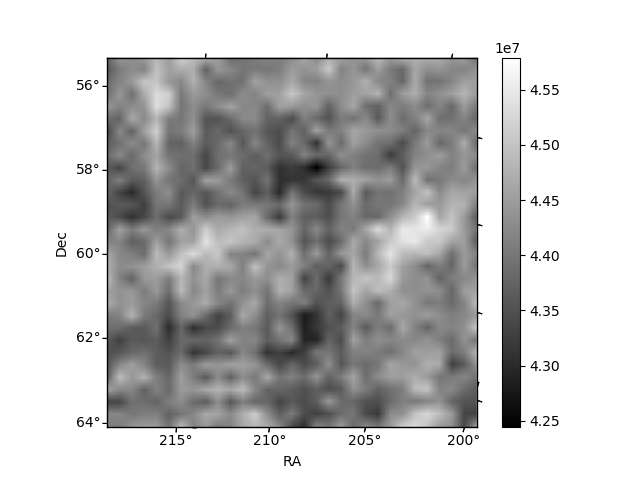
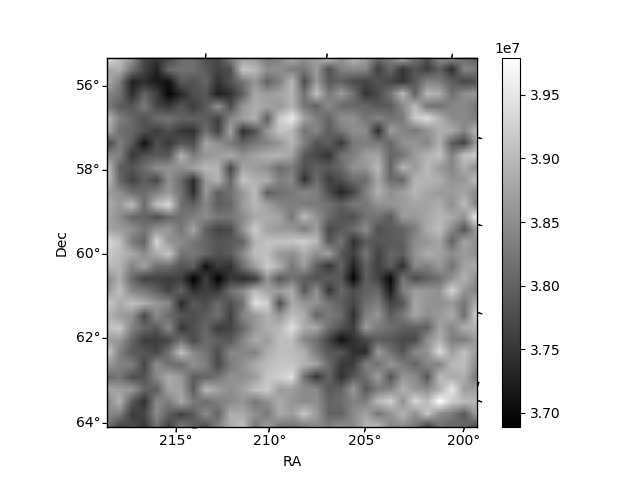
Histogram calculated using DETX and DETY for each event in the final _common_clean file
| Quadrant A | 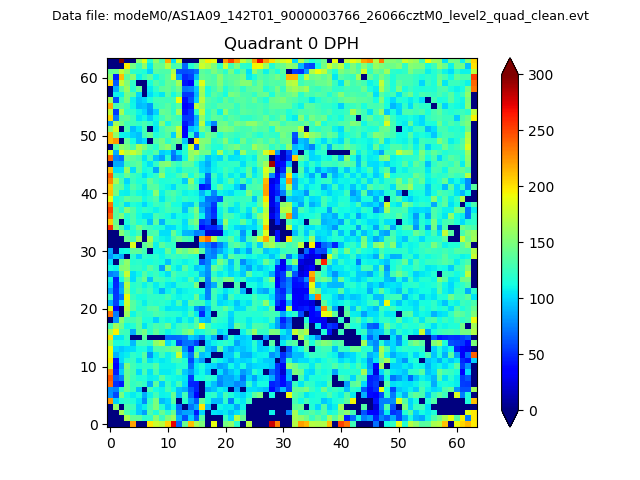 |
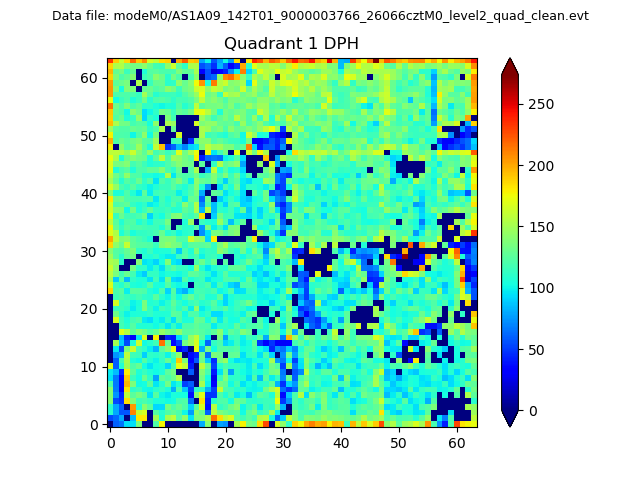 |
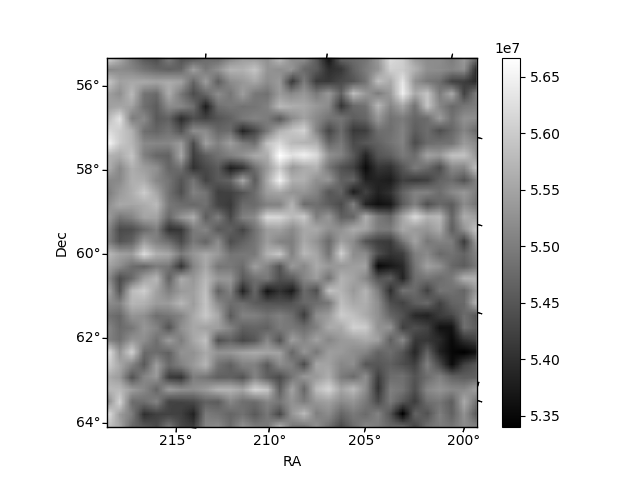
Quadrant B |
|---|---|---|---|
| Quadrant D | 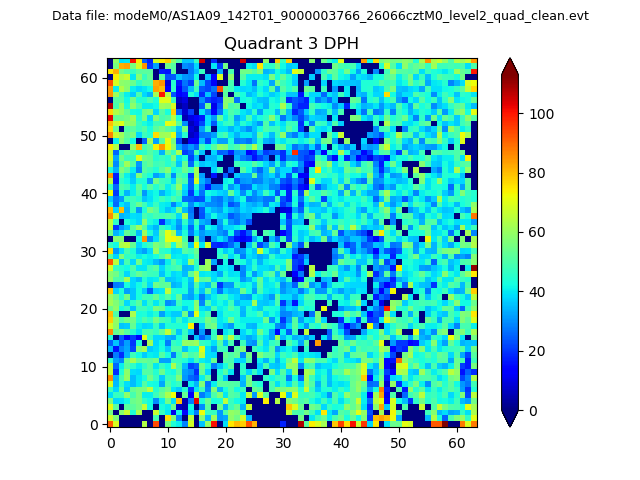 |
 |
Quadrant C |
| Plot type | Count rate plots | Images |
|---|---|---|
| Comparison with Poisson distribution Blue bars denote a histogram of data divided into 1 sec bins. Red curve is a Poisson curve with rate = median count rate of data. |
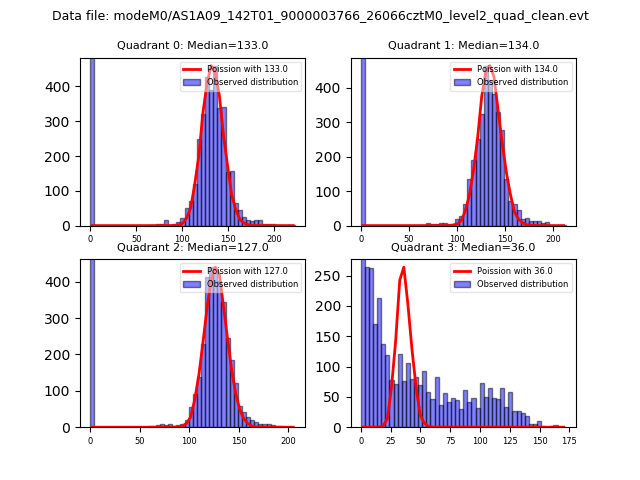 |
 |
| Quadrant-wise count rates Data is divided into 100 sec bins |
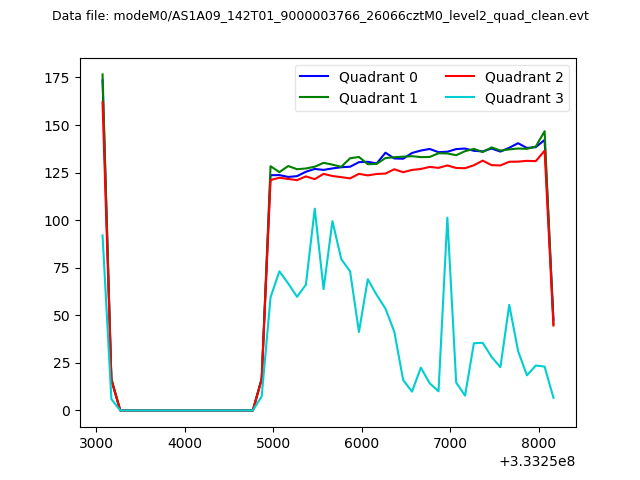 |
|
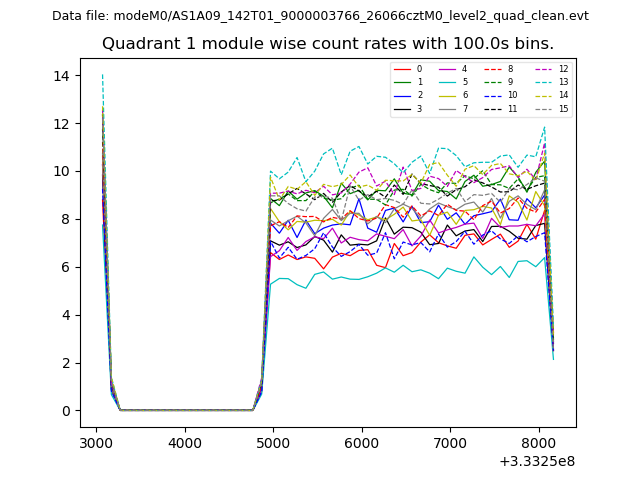
| Module-wise count rates for Quadrant A Data is divided into 100 sec bins |
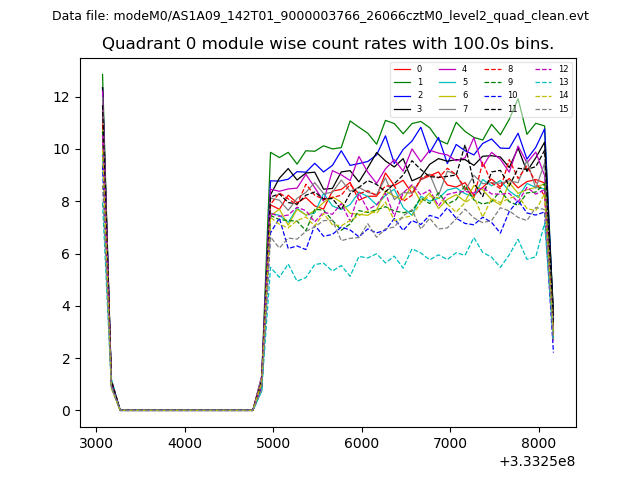 |
 |
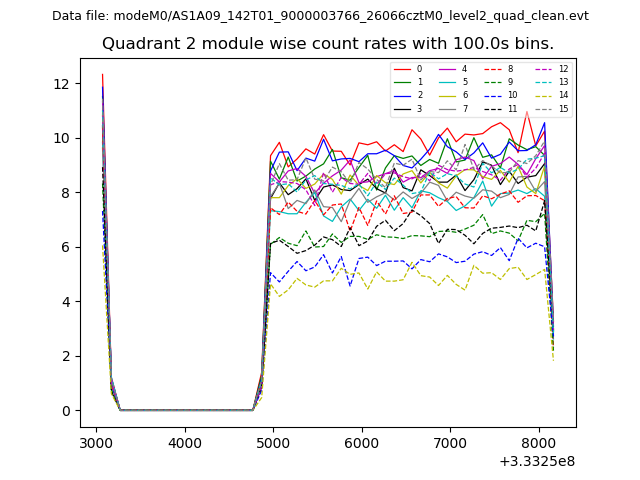
| Module-wise count rates for Quadrant B Data is divided into 100 sec bins |
 |
 |
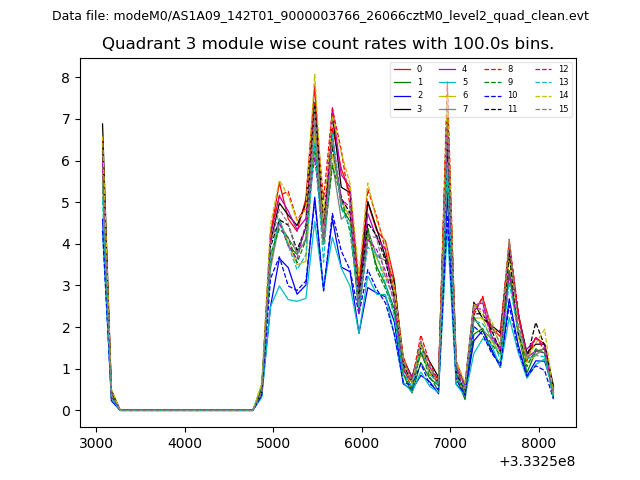
| Module-wise count rates for Quadrant C Data is divided into 100 sec bins |
 |
 |
| Module-wise count rates for Quadrant D Data is divided into 100 sec bins |
 |
 |
| Parameter | Plot |
|---|---|
| CZT HV Monitor | 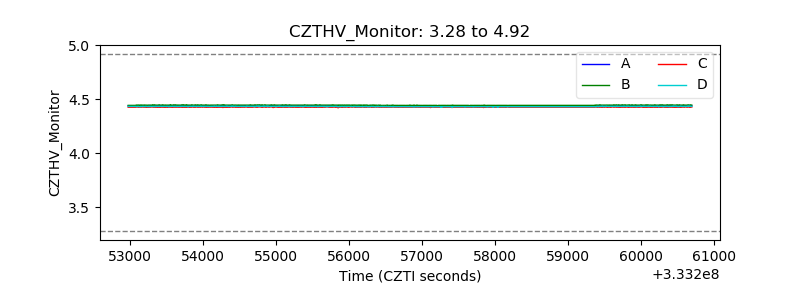 |
| D_VDD | 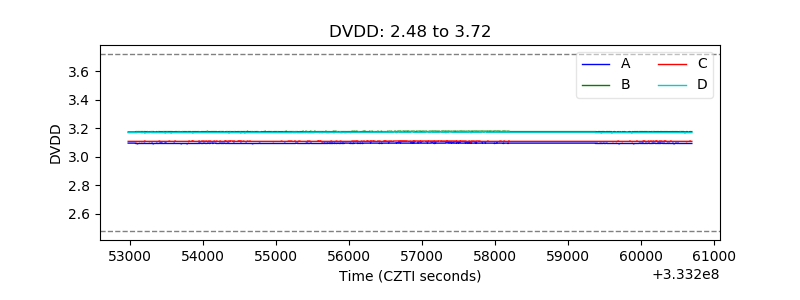 |
| Temperature 1 | 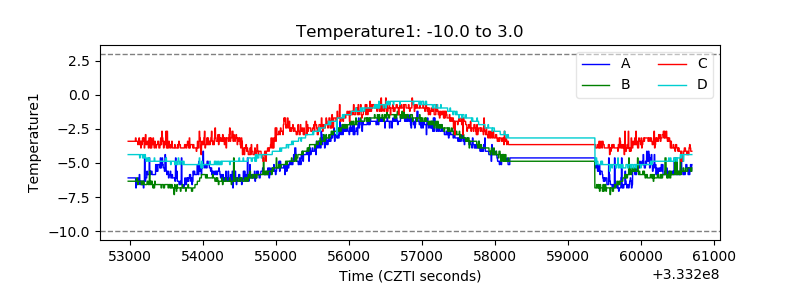 |
| Veto HV Monitor |  |
| Veto LLD | 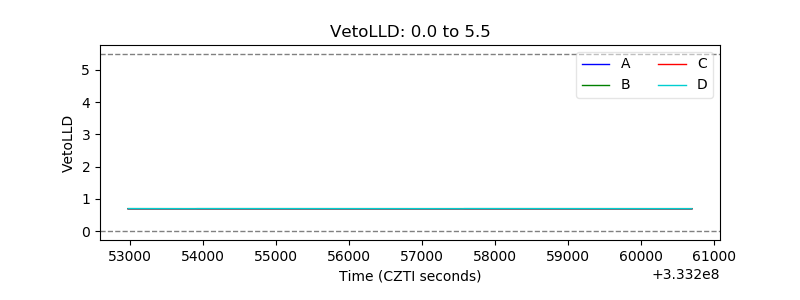 |
| Alpha Counter | 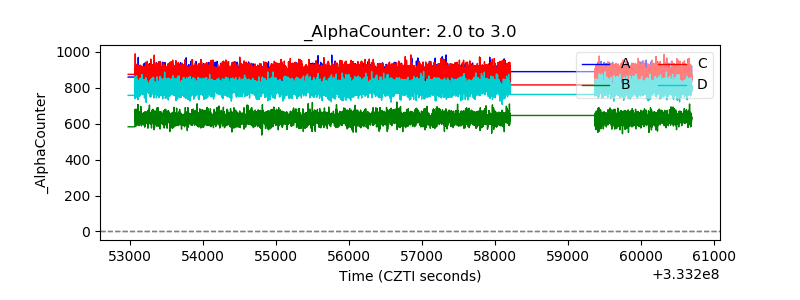 |
| _CPM_Rate | 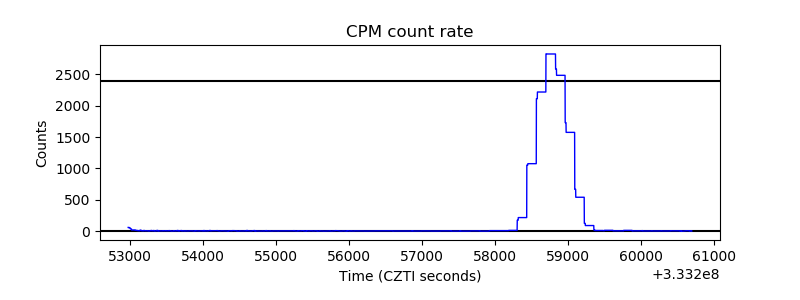 |
| CZT Counter |  |
| +2.5 Volts monitor | 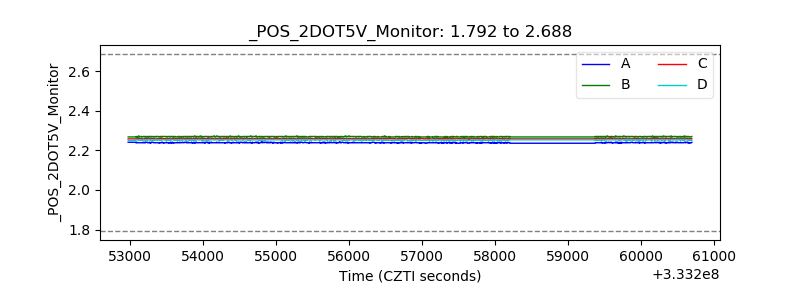 |
| +5 Volts monitor |  |
| _ROLL_ROT | 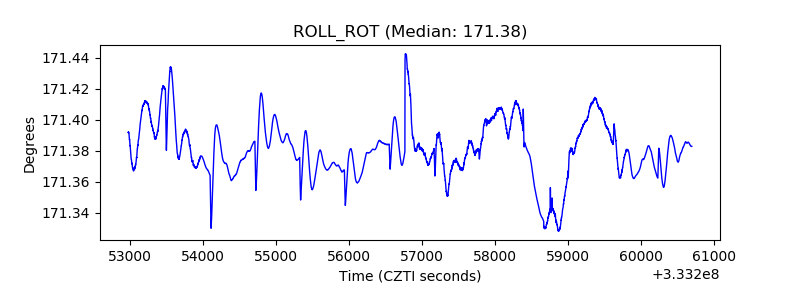 |
| _Roll_DEC | 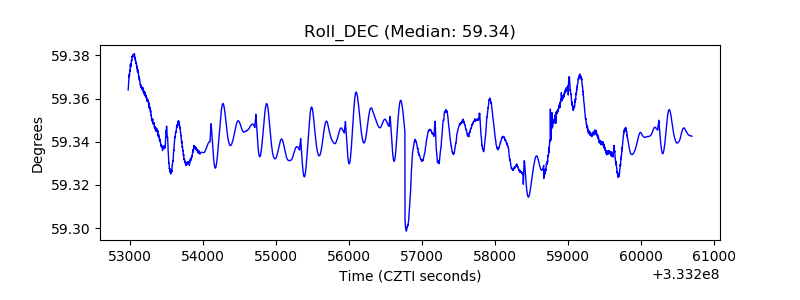 |
| _Roll_RA | 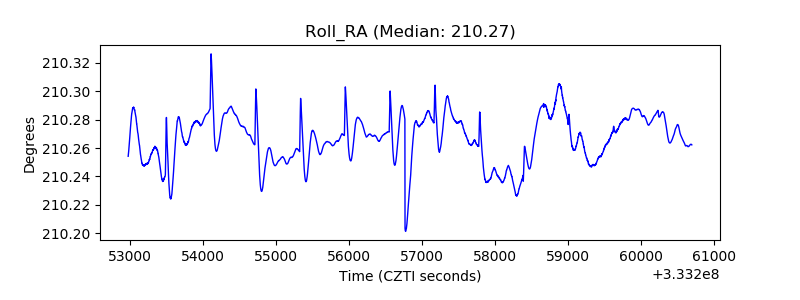 |
| Veto Counter | 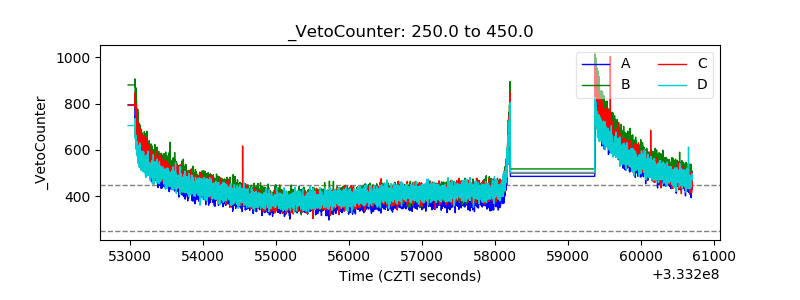 |