| Param | Original file | Final file |
|---|---|---|
| Filename | modeM0/AS1A09_142T01_9000003766_26067cztM0_level2.evt | modeM0/AS1A09_142T01_9000003766_26067cztM0_level2_quad_clean.evt |
| Size (bytes) | 574,364,160 | 83,352,960 |
| Size | 547.8 MB | 79.5 MB |
| Events in quadrant A | 3,322,470 | 541,500 |
| Events in quadrant B | 3,365,953 | 545,369 |
| Events in quadrant C | 3,278,194 | 510,936 |
| Events in quadrant D | 7,002,357 | 487,929 |
| Mode M9 | |||
|---|---|---|---|
| Quadrant | BADHDUFLAG | Total packets | Discarded packets |
| A | 0 | 17 | 0 |
| B | 0 | 18 | 0 |
| C | 0 | 18 | 0 |
| D | 0 | 18 | 0 |
| Mode M0 | |||
|---|---|---|---|
| Quadrant | BADHDUFLAG | Total packets | Discarded packets |
| A | 0 | 13758 | 0 |
| B | 0 | 13916 | 0 |
| C | 0 | 13626 | 0 |
| D | 0 | 24929 | 0 |
| Quadrant | Total seconds | Saturated seconds | Saturation percentage |
|---|---|---|---|
| A | 6276 | 46 | 0.732951% |
| B | 6276 | 61 | 0.971957% |
| C | 6276 | 74 | 1.179095% |
| D | 6276 | 1551 | 24.713193% |
Noise dominated data is calculated using 1-second bins in cleaned event files. If a bin has >2000 counts, and if more than 50% of those come from <1% of pixels, then it is considered to be noise-dominated and hence unusable.
| Quadrant | # 1 sec bins | Bins with >0 counts | Bins with >2000 counts | High rate bins dominated by noise | Noise dominated (total time) | Noise dominated (detector-on time) | Marked lightcurve |
|---|---|---|---|---|---|---|---|
| A | 7541 | 6276 | 0 | 0 | 0.00% | 0.00% | 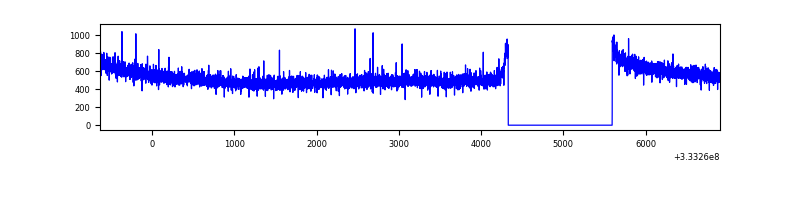 |
| B | 7541 | 6276 | 5 | 5 | 0.07% | 0.08% | 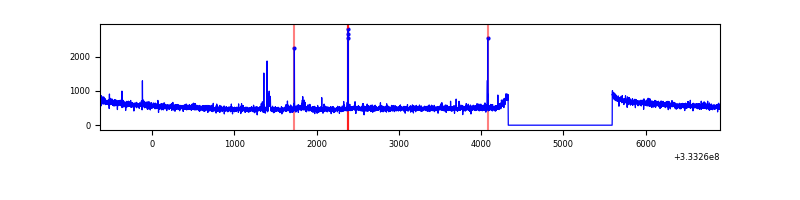 |
| C | 7541 | 6276 | 3 | 3 | 0.04% | 0.05% | 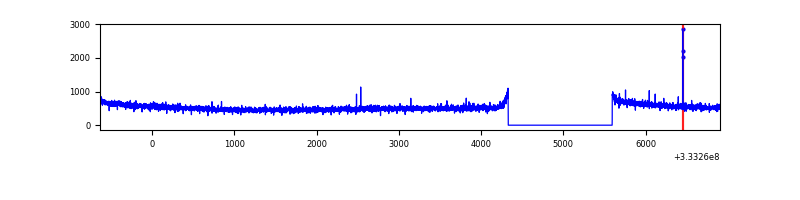 |
| D | 7541 | 6276 | 1478 | 1478 | 19.60% | 23.55% | 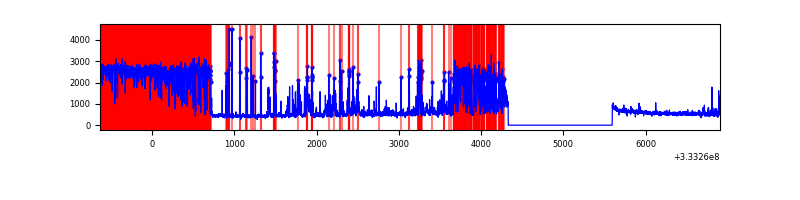 |
Top three noisy pixels from each quadrant. If the there are fewer than three noisy pixels in the level2.evt file, extra rows are filled as -1
| Pixel properties | Quadrant properties | ||||||
|---|---|---|---|---|---|---|---|
| Quadrant | DetID | PixID | Counts | Sigma | Mean | Median | Sigma |
| A | 13 | 254 | 10932 | 59.5 | 861 | 847 | 169.5 |
| A | 0 | 226 | 7610 | 39.9 | 861 | 847 | 169.5 |
| A | 3 | 137 | 7041 | 36.55 | 861 | 847 | 169.5 |
| B | 12 | 111 | 17986 | 109.92 | 848 | 828 | 156.1 |
| B | 11 | 111 | 16274 | 98.95 | 848 | 828 | 156.1 |
| B | 0 | 229 | 15377 | 93.21 | 848 | 828 | 156.1 |
| C | 14 | 238 | 132717 | 715.17 | 802 | 809 | 184.4 |
| C | 2 | 16 | 10117 | 50.47 | 802 | 809 | 184.4 |
| C | 3 | 233 | 8278 | 40.49 | 802 | 809 | 184.4 |
| D | 1 | 3 | 2751638 | 14094.62 | 729 | 715 | 195.2 |
| D | 12 | 233 | 771173 | 3947.52 | 729 | 715 | 195.2 |
| D | 1 | 52 | 630713 | 3227.86 | 729 | 715 | 195.2 |
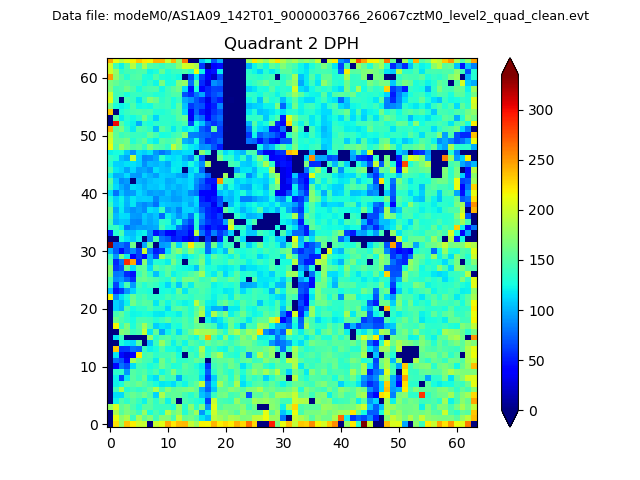
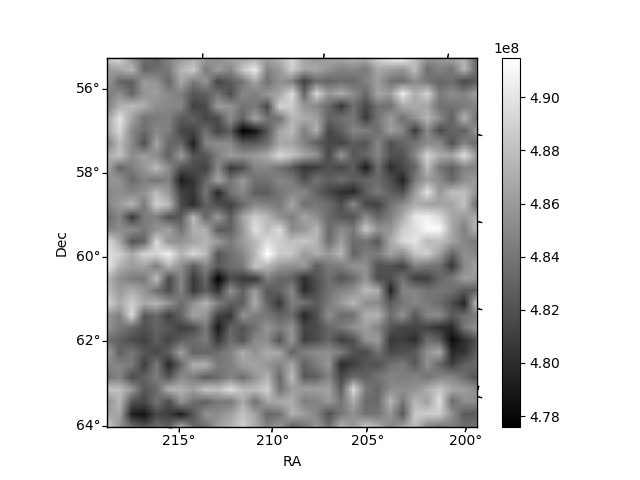
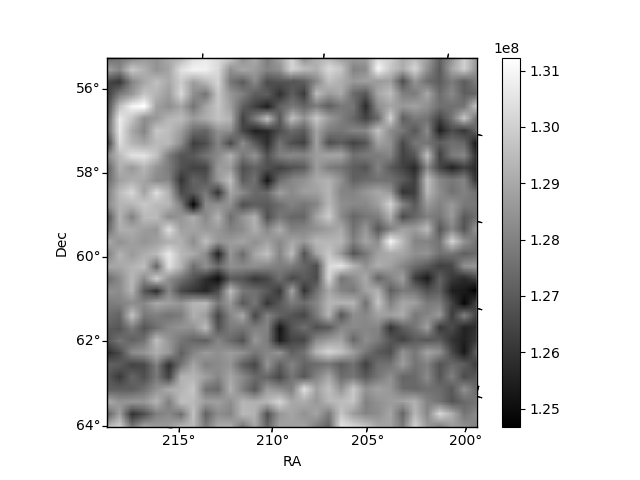
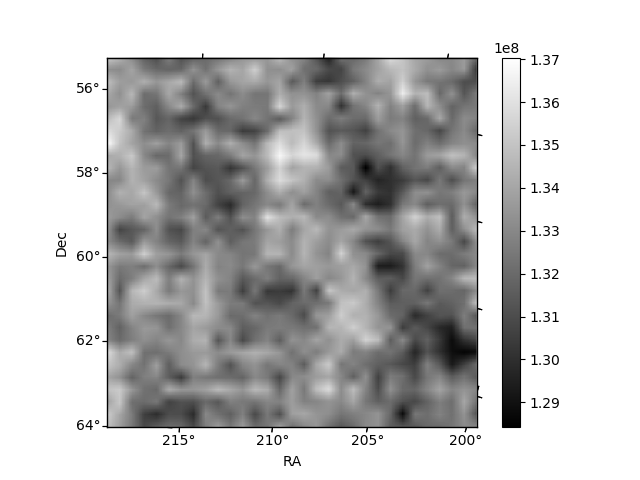
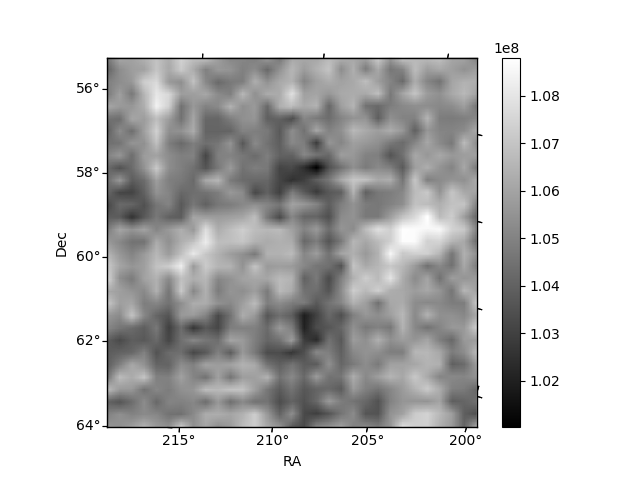
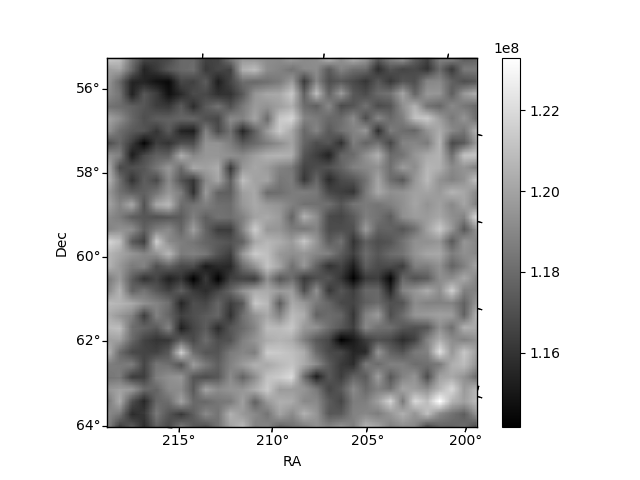
Histogram calculated using DETX and DETY for each event in the final _common_clean file
| Quadrant A | 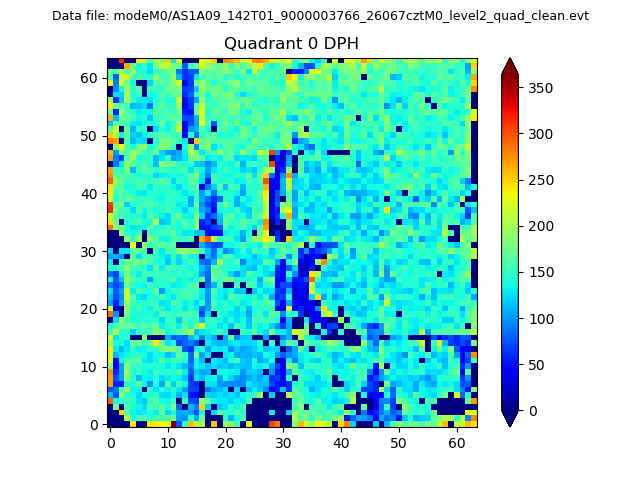 |
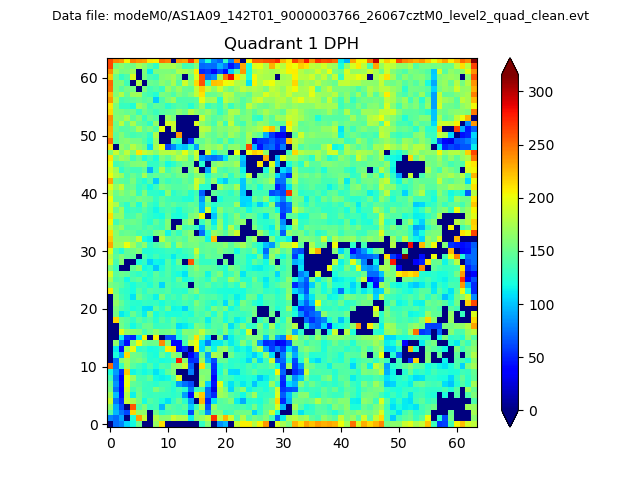 |
Quadrant B |
|---|---|---|---|
| Quadrant D | 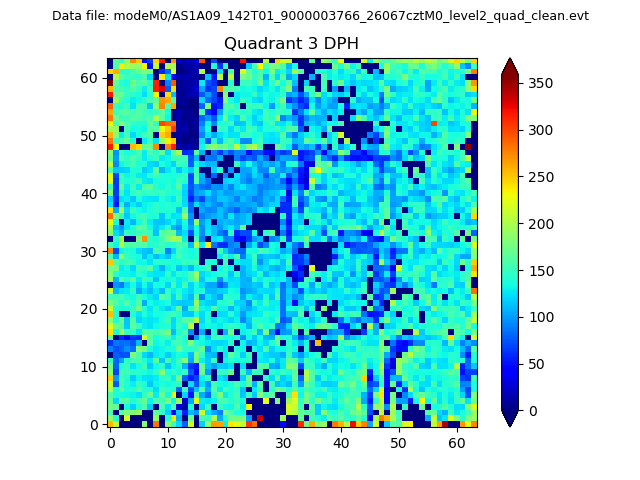 |
 |
Quadrant C |
| Plot type | Count rate plots | Images |
|---|---|---|
| Comparison with Poisson distribution Blue bars denote a histogram of data divided into 1 sec bins. Red curve is a Poisson curve with rate = median count rate of data. |
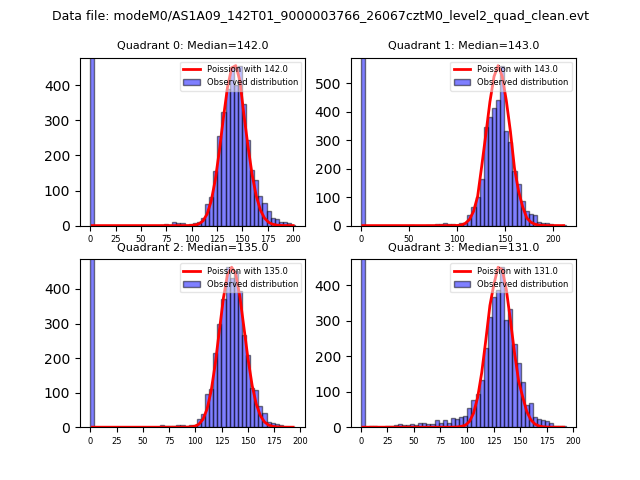 |
 |
| Quadrant-wise count rates Data is divided into 100 sec bins |
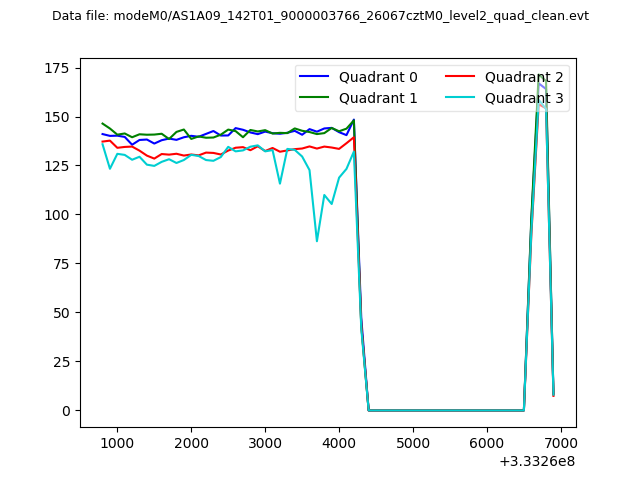 |
|
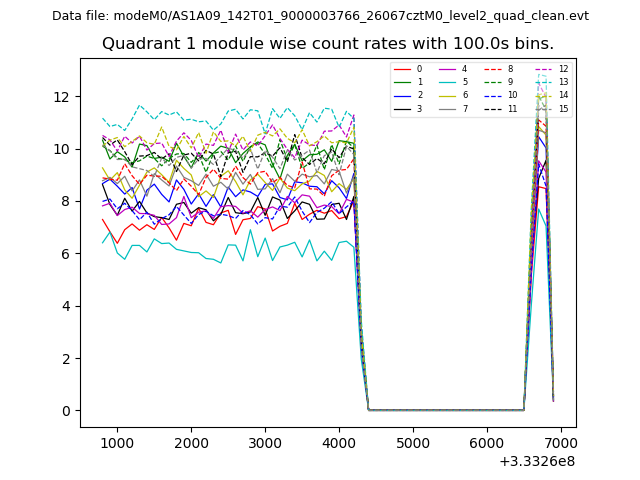
| Module-wise count rates for Quadrant A Data is divided into 100 sec bins |
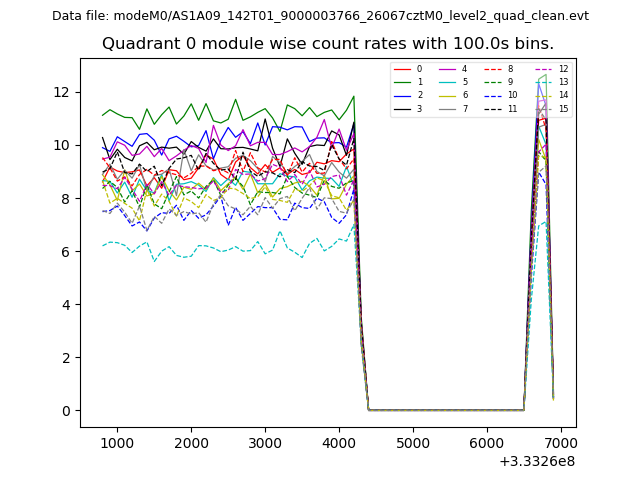 |
 |
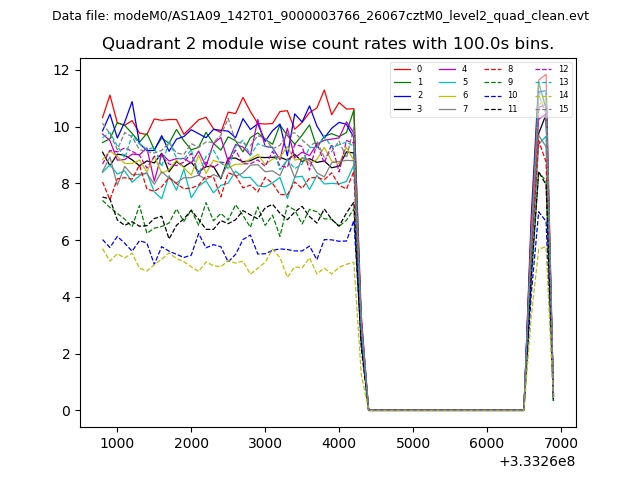
| Module-wise count rates for Quadrant B Data is divided into 100 sec bins |
 |
 |
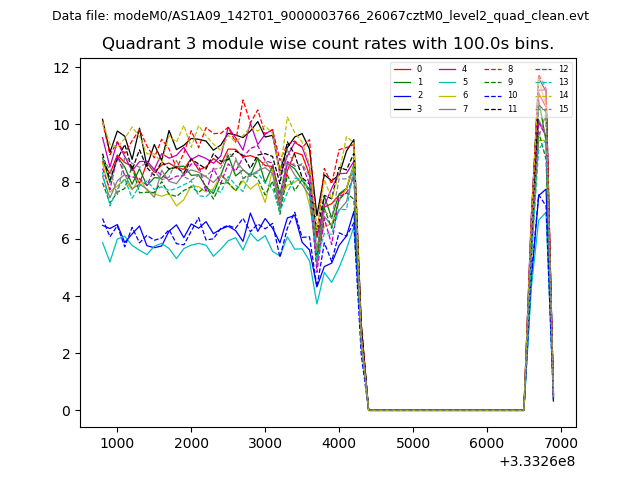
| Module-wise count rates for Quadrant C Data is divided into 100 sec bins |
 |
 |
| Module-wise count rates for Quadrant D Data is divided into 100 sec bins |
 |
 |
| Parameter | Plot |
|---|---|
| CZT HV Monitor | 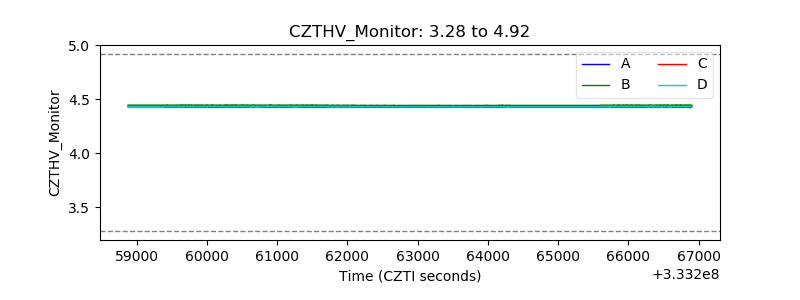 |
| D_VDD | 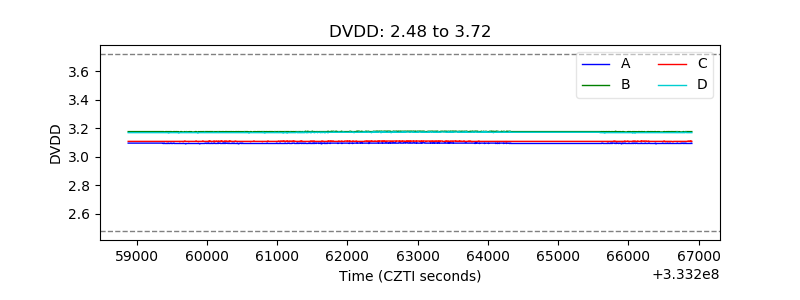 |
| Temperature 1 | 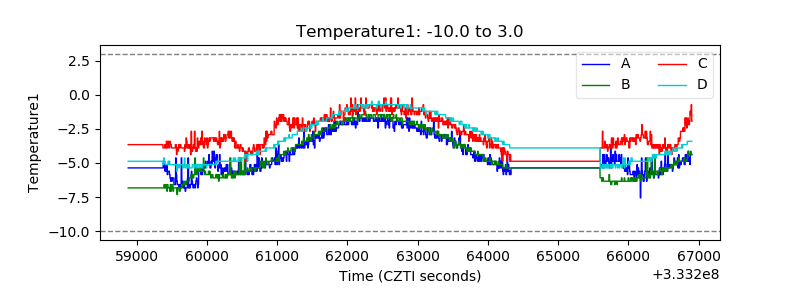 |
| Veto HV Monitor | 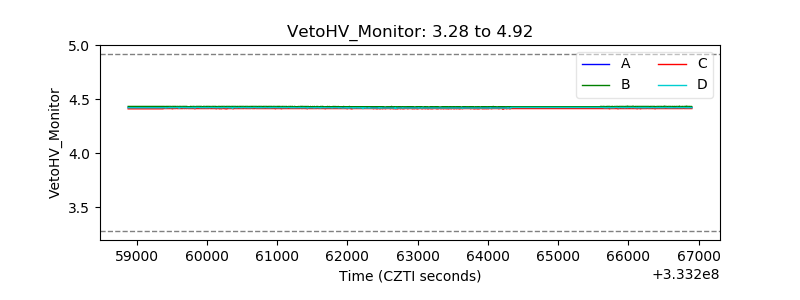 |
| Veto LLD | 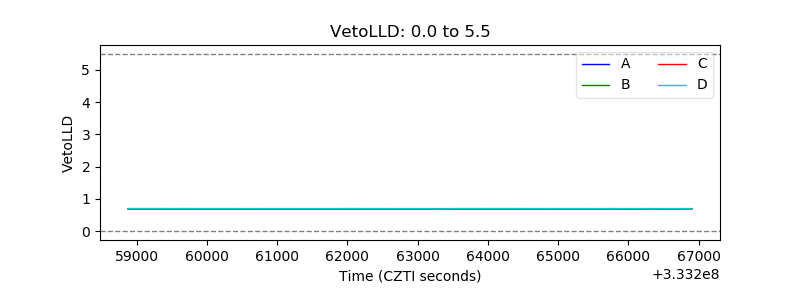 |
| Alpha Counter | 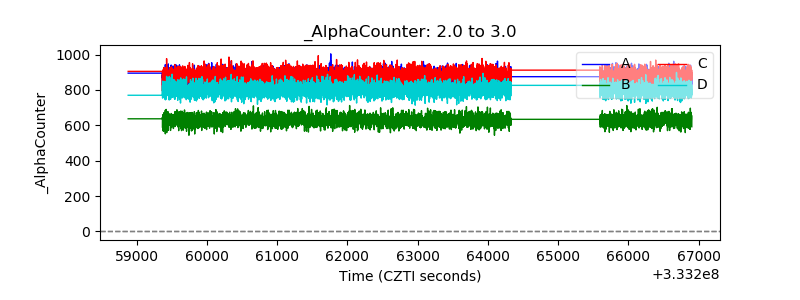 |
| _CPM_Rate | 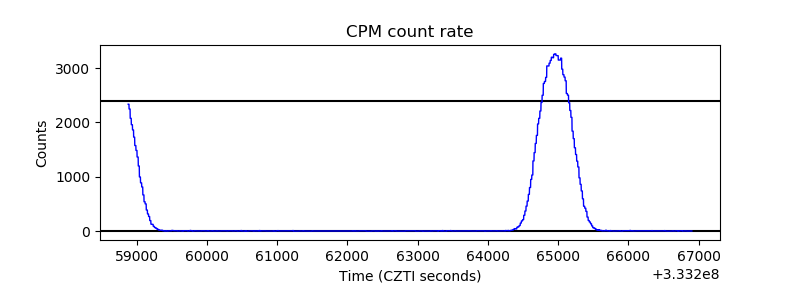 |
| CZT Counter | 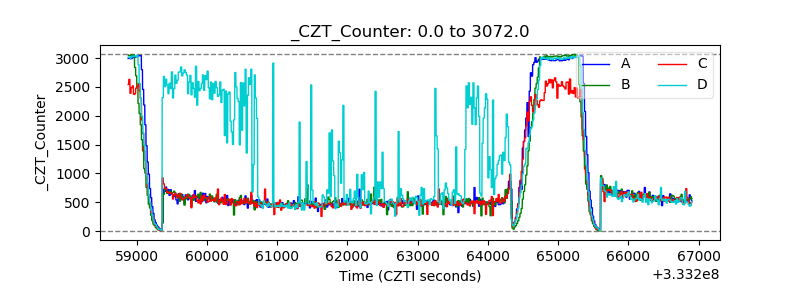 |
| +2.5 Volts monitor | 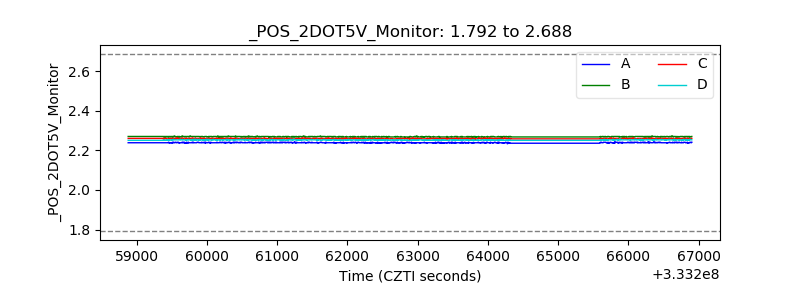 |
| +5 Volts monitor | 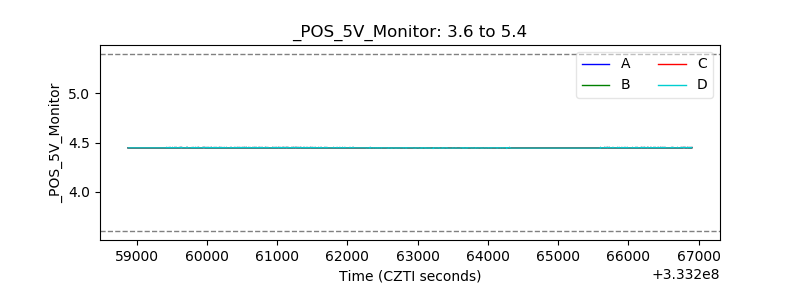 |
| _ROLL_ROT | 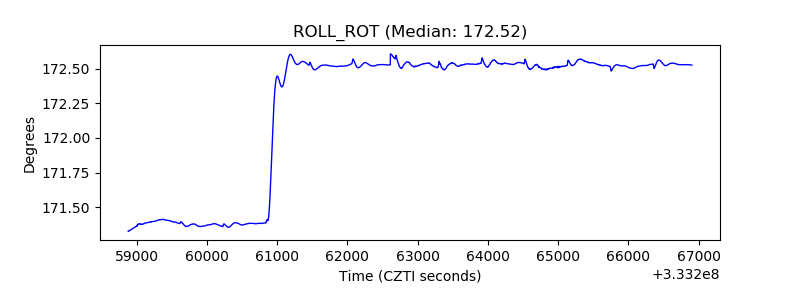 |
| _Roll_DEC |  |
| _Roll_RA | 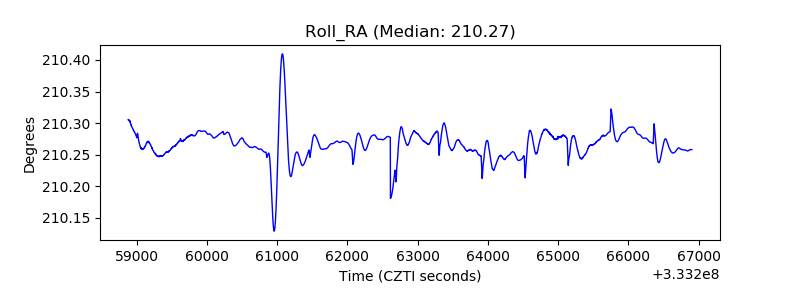 |
| Veto Counter | 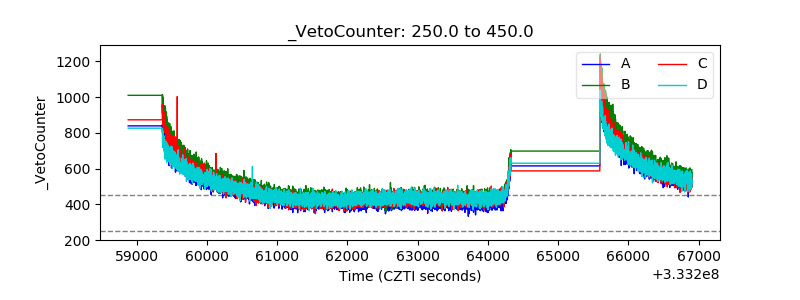 |